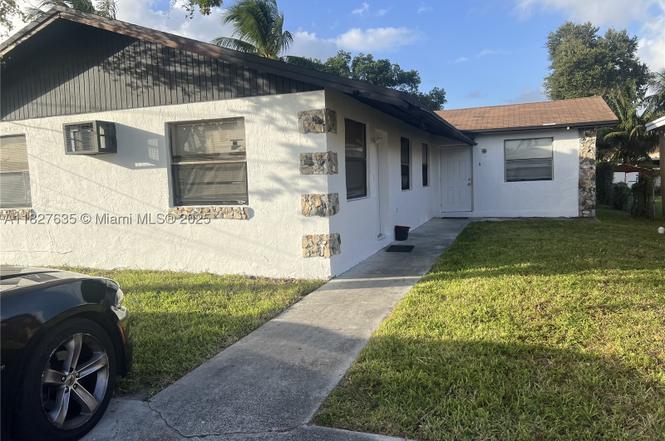
4809 SW 25th St · West Park, FL
Flood risk 1/10 · Minimal
- FEMA flood zone
- X (unshaded)
- Chance of flooding over 30 yrs
- 0.0%
- Est. flood insurance / yr
- $507 – $1,088
Fire risk 1/10 · Minimal
- Est. fire insurance / yr
- $947 – $1,759
Heat risk 10/10 · Severe
- Hot days now (above 105°F)
- 7 days/yr
- Hot days in 30 yrs
- 26 days/yr
Wind risk 10/10 · Severe
- Chance of severe wind over 30 yrs
- 99.0%
Air-quality risk 2/10 · Minimal
- Unhealthy air days now
- 2 days/yr
- Unhealthy air days in 30 yrs
- 2 days/yr
Risk factors via First Street. Map © Google.
Why this score? — see what drove the D grade
The composite is a weighted blend of 9 inputs, each scored 0–100. Each bar is that input's sub-score; the figure is the points it added to the 100-point composite (weight × sub-score).
- Cash flow +12.6/30.0
- ARV discount +7.5/15.0
- Schools +4.1/10.0
- 1% rule +3.9/10.0
- DSCR +3.8/10.0
- Livability +3.7/5.0
- Rent growth +2.6/5.0
- Condition / age +2.5/5.0
- Appreciation +0.0/10.0
$614,000
🖨 Deal sheet 📄 Offer letter ✓ Due diligence
Listing remarks
Great investment property or rental. located in a great area. Near shopping centers and more. Very spacious. Selling AS-IS CASH ONLY. needs a little TLC. Tenant Occupied. Please refer to the broker remarks for further instructions.
Key facts
- 7,153 sq ft lot
- Parking
- Built 1985
Property features AI
Exterior
- Parking: Carport (1 space); Driveway parking; Guest parking
- Utilities: Public water; Public sewer
- Home design: Single-story; Faces southwest
- Construction: Block construction; Shingle roof; Effective year built listed
- Exterior features: No notable exterior features listed
Interior
- Kitchen: Dishwasher
- Bedrooms: Bedroom on main level
- Flooring: Ceramic tile
- Bathrooms: 3 full bathrooms
- Heating & cooling: Central heating; Central air conditioning
- Interior features: First-floor entry; Attic
- Laundry & utility: Washer hookup; Dryer hookup
Neighborhood map
What this means for you Summary
Snapshot
- This is a 6-bed/3.0-bath single-family listed at $614k.
Deal economics
- At list price, monthly cash flow is $-77 ($-929/yr) — negative.
- To cash-flow at today's rent, offer at most $600k (2.2% below list).
- To meet the 1% rule (rent ≥ 1% of price), the offer needs to be $545k (11.2% below list).
- Recommended offer: $540k (12.0% below list) — sets the bar for market timing.
Location & tenants
- Location reads 74/100 on livability (#280 in FL, #4,501 nationally) — a middle-class / working-renter tenant base. Strengths: housing A+, health & safety A+, cost of living A; Watch: employment D+, amenities F.
- Broward (suburban): math 42% / reading 53% proficiency, ranked #46 of 73 in FL (top 63%) — families likely to look elsewhere, expect single-tenant / working-renter base with shorter leases.
- Market conditions: Rents flat; 286 active listings in the ZIP; 3 comparable units currently listed for rent nearby; rentals at typical pace (median 18d on market — plan ~3-4 weeks tenant-placement turnaround); 2,111 units permitted in Broward County in 2024 (1,265 in 5+ unit buildings).
- At $5,454/mo this rent would consume 88% of the median local household income ($75k/yr) (locally 2567% of renters already pay >50% of income on rent) — very limited rent-growth headroom before tenants either downsize or default.
Forward outlook
- Local home prices are declining (-3.0%/yr); year-one equity from $4k of loan paydown is wiped out by about $18k of value loss. Plan a longer hold.
- Broward County population projected at +34% by 2050 — long-run rental-demand tailwind backs the buy-and-hold thesis.
Negotiation context
- It's been on market 360 days — a 12% lower offer ($540k) is reasonable based on typical stale-listing flexibility.
- 3 sale attempts since 11y ago with the ask held roughly flat each time — persistent listings suggest the price (not the market) is what's stuck; bring a comps-based counter.
- Current owner paid $479k; 28% above their basis — modest negotiation headroom, anchor on the comps not their cost.
Risks & watch-outs
- Climate carrying-cost: severe wind risk, 99% chance of damaging wind over 30y; extreme-heat days projected 7→26/yr by 2055 (HVAC capex compounding) — expect insurance premiums to compound above CPI over the hold.
Questions for the listing agent
- What do current leases actually rent for vs. the listed asking? Can we see a recent rent roll and the last 12 months of T-12 income?
- It's been on market 360 days. Have you received any prior offers? Is the seller open to a 12% concession, seller financing, or rate buy-down credit?
- Why hasn't it sold? Are there any deal-killer items the seller is aware of (foundation, flood, title, zoning, code violations)?
- Is there a deadline driving the sale (1031 exchange, divorce, estate, relocation)? That informs how much negotiation room exists.
- Schools are B-rated — typically a magnet for longer-tenancy family renters. What's the average tenant stay here, and is there a school-zone premium baked into asking?
- The area grade is low — what's the realistic commute time and amenity access for the typical tenant pool here? Any planned neighborhood developments (good or bad) we should know about?
- What's the average days-on-market for RENTAL listings here right now (not sales)? A rising rental-DOM trend means longer vacancies and softer asking-rent achievability than the comps imply.
- What's the recent tenant-quality profile in this submarket — average credit score on applications, eviction rate, late-payment / NSF rate, and stable-employment percentage? A property-management company in the area should have these aggregated.
- How much new for-sale + rental construction is in the pipeline within 1–3 miles? Heavy new supply typically softens prices + rents 12–24 months out; constrained supply supports both.
Investment metrics
- 1% rule
- 0.89% ✗
- Cap rate
- 6.14%
- Cash-on-cash
- -0.54%
- DSCR
- 0.98
- GRM
- 9.4
CMA / ARV
No comps found within radius.
Projected returns pro-forma
-3.0% appreciation · 0.34% rent growth · sell at horizon
- IRR
- -20.3%
- Equity multiple
- 0.31×
- Total profit
- $-118,474
- Equity at exit
- $91,549
- IRR
- -20.9%
- Equity multiple
- 0.05×
- Total profit
- $-164,146
- Equity at exit
- $53,087
Cash invested: $171,920 (down + closing). Projections, not guarantees.
Landlord ↔ Tenant lean methodology
- Overall (STATE)
- 87 Strongly Landlord-Friendly
- State Florida
- 87 Strongly Landlord-Friendly · R+3
- County
- — inherits STATE
- City
- — inherits STATE
ZIP-level market 33023
- Rents YoY
- 0.3%
- Active inventory
- 286
- Price-to-rent
- 9.4×
Monthly cashflow live
- Estimated rent
- $5,454 medium interval (Pro) →
- Mortgage (P&I)
- −$3,220
- Tax from tax record
- −$910 /mo · $10,925/yr
- Insurance
- −$256
- HOA
- −$0
- Vacancy / Maint / Mgmt
- −$1,145
- Net cashflow
- $-77
Break-even live
UW: 25.0% down · 7.5% · 30yr · 1.5% tax · 5.0% vac · 8.0% maint · 8.0% mgmt
Financing live
Cash to close
- Down payment
- $153,500
- Closing costs
- $18,420
- Reserves months
- —
- Total cash needed
- —
Loan-product check · same deal, 3 products live
Conventional
25% down · 7.5% · 30yr
- Down + closing
- —
- Monthly P&I
- —
- Monthly cashflow
- —
- DSCR
- —
- Eligible?
- —
Personal DTI + credit; lowest rate.
DSCR
20% down · 8.5% · 30yr
- Down + closing
- —
- Monthly P&I
- —
- Monthly cashflow
- —
- DSCR
- —
- Eligible?
- —
No personal income docs; deal must DSCR.
Hard money
10% down · 12.0% · 12mo
- Down + closing
- —
- Monthly P&I
- —
- Monthly cashflow
- —
- DSCR
- —
- Eligible?
- —
Short-term bridge; refi at stabilization.
Rent comps 3 comps
| Address | Beds | Baths | Sqft | Rent | $/sqft | DOM | Units | Dist |
|---|---|---|---|---|---|---|---|---|
| 4426 Greenway Dr Hollywood, FL | 5.0 | 3.0 | 2501 | $9,900 | $3.96 | 17d | 1 | 0.73mi |
| 4400 SW 36th St West Park, FL | 5.0 | 3.0 | 1508 | $4,200 | $2.79 | 17d | 1 | 0.78mi |
| 3825 SW 33rd St West Park, FL | 5.0 | 2.0 | 2061 | $4,000 | $1.94 | 24d | 1 | 0.93mi |
Listing history 24 events
-
2026-06-18days on market $614,000 Active 360 DOM
-
2026-06-17days on market $614,000 Active 359 DOM
-
2026-06-16days on market $614,000 Active 358 DOM
-
2026-06-15days on market $614,000 Active 357 DOM
-
2026-06-13days on market $614,000 Active 355 DOM
-
2026-06-09days on market $614,000 Active 351 DOM
-
2026-06-07days on market $614,000 Active 349 DOM
-
2026-06-04days on market $614,000 Active 346 DOM
-
2026-06-03days on market $614,000 Active 345 DOM
-
2026-06-02days on market $614,000 Active 344 DOM
-
2026-06-01days on market $614,000 Active 343 DOM
-
2026-05-31days on market $614,000 Active 342 DOM
-
2025-09-24price $614,000
-
2025-08-27price $615,000
-
2025-06-23$630,000 Active
-
2024-10-25soldstatus $479,000
-
2016-10-31historical
-
2016-05-22price $275,000
-
2016-05-04$299,000 Active
-
2016-04-29historical
-
2015-08-11price $300,000
-
2015-02-08$245,000 Active
-
2012-05-30soldstatus $90,000
-
1998-07-27soldstatus $72,500
ⓘ Source: listings_history table (triggers on properties + properties_extension) + one-shot
backfill from property_details.listing_events for pre-trigger history.
Tax reassessment forecast FL · Resets to sale price
- Current annual tax
- $10,925 · $910/mo
- Projected year-2 tax
- $10,925 · $910/mo
- Expected delta
- $0/yr ($0/mo · 0.0%)
ⓘ Screening estimate from a state-policy table — verify with the county assessor before closing.
Climate risk First Street
- Flood 1/10 Low FEMA zone X (unshaded) · 0% chance over 30 yrs
- Wildfire 1/10 Low
- Heat 10/10 Extreme 7 d/yr ≥105°F today · 26 d/yr by 30 yrs out
- Wind 10/10 Extreme 99% chance of damaging wind over 30 yrs
- Air quality 2/10 Low 2 unhealthy d/yr today · 2 by 30 yrs out
Nearby sold comps map
Loading sold comps map…
Walkable amenities ~0.75 mi
Loading nearby amenities…
Taxation est. · year 1
- Rental income
- $65,449
- − Mortgage interest
- −$34,394
- − Property taxes
- −$10,925
- − Insurance
- −$3,070
- − Repairs & maintenance
- −$5,236
- − Management
- −$5,236
- − Depreciation
- −$17,862
- Taxable loss
- −$11,273
- Est. tax savings @ 24.0%
- +$2,706
- After-tax cash flow
- $1,777/yr
For passive investors: Depreciation is non-cash, so a rental often shows a tax loss while cash-flowing — sheltering income. Rental losses are passive: they offset passive income freely, and up to $25,000/yr can offset ordinary (W-2) income if you actively participate and your MAGI is under $100k (phasing out to $0 by $150k); unused losses carry forward. On sale, claimed depreciation is recaptured at up to 25%, and gains may owe capital-gains tax (a 1031 exchange can defer both). Figures are a year-1 estimate at your 24.0% rate — not tax advice; consult a CPA.
Schools (NCES district)
- District
- Broward
- NCES district ID
- 1200180
- Math proficiency
- 42% ▼ -18.00%
- Reading proficiency
- 53% ▼ -5.00%
- Median HH income
- $52,139
- Composite
- 40.88/100
- National rank
- #3621
- State rank
- #46 of 73 in FL
Livability — West Park
- Score
- 74/100
- State rank
- #280
- US rank
- #4501
Category grades
Schools grade is shown separately in the Schools card above.
Census & demographics
- Census place
- West Park, FL
- County
- Broward County · 1,963,430 people
- Metro
- Miami-Fort Lauderdale-Pompano Beach, FL
- Population (ZIP)
- 72,344
- Household income
- $74,709
- Rent vs Own
- Severe rent burden
- 2567.0
Population outlook (Broward County) Hauer SSP2
- Today (2025)
- 2,207,033 people
- By 2030
- 2,360,704 · +7.0%
- By 2040
- 2,661,208 · +20.6%
- By 2050
- 2,946,698 · +33.5%
- By 2075
- 3,602,273 · +63.2%
- By 2100
- 3,970,984 · +79.9%
Race, ethnicity, and origin ACS 2023
- Neighborhood character
- Diverse neighborhood (Simpson 0.60)
- Race & ethnicity
- Black 51% Hispanic / Latino 37% Two or more races 19% White 8% Asian 2%
- Hispanic origin (detail)
- Mexican 2% Puerto Rican 5% Cuban 9% Dominican 6%
- Common ancestry
- Hispanic 14%
- Foreign-born
- 44% · Canada, Jamaica, Dominican Republic
- Languages at home
- 50% English-only · Spanish 32% French/Haitian/Cajun 13% Other Indo-European 1%
Political lean MEDSL · Broward
- 2024 margin
- D (+17.0) · D 58.0% · R 41.0%
- 2008→2024 swing
- -17.8pp toward R · 2008: 34.7pp · 2024: 17.0pp
- All cycles
- 2024: D+17.0 2020: D+29.8 2016: D+35.0 2012: D+34.9 2008: D+34.7
Not yet ingested
- Civics
- —
Market trends
- HPI YoY
- ▼ -442.33%
- Current HPI
- 534.7664
- Rent YoY
- ▲ 0.34%
- Metro
- Miami-Fort Lauderdale-Pompano Beach, FL
- State GDP YoY
- ▲ 3.28%
- F500 in state
- 36
Industry mix (Fortune 500 HQ in FL)
| Industry | F500 HQs | Revenue |
|---|---|---|
| Industrial Technology | 2 | $29B |
|
||
| Insurance | 2 | $17B |
|
||
| Retail | 1 | $60B |
|
||
| Technology Distribution | 1 | $58B |
|
||
| Homebuilding | 1 | $35B |
|
||
| Technology Manufacturing | 1 | $35B |
|
||
Price history
+746.9% since first listed12 events — show timeline
- 2025-09-24 Price Changed $614,000 MARMLS
- 2025-08-27 Price Changed $615,000 MARMLS
- 2025-06-23 Listed $630,000 MARMLS
- 2024-10-25 Sold (Public Records) $479,000 Public Records
- 2016-10-31 Listing Removed — MARMLS
- 2016-05-22 Price Changed $275,000 MARMLS
- 2016-05-04 Listed $299,000 MARMLS
- 2016-04-29 Listing Removed — MARMLS
- 2015-08-11 Price Changed $300,000 MARMLS
- 2015-02-08 Listed $245,000 MARMLS
- 2012-05-30 Sold (Public Records) $90,000 Public Records
- 1998-07-27 Sold (Public Records) $72,500 Public Records
Property tax history
+13.3%/yrLatest (2025): $10,925 · +55.8% YoY. Source: county tax records.
Cash-flow waterfall
monthlySold comps — $/sqft
last 12 mo · ≤1 miLoading sold comps…