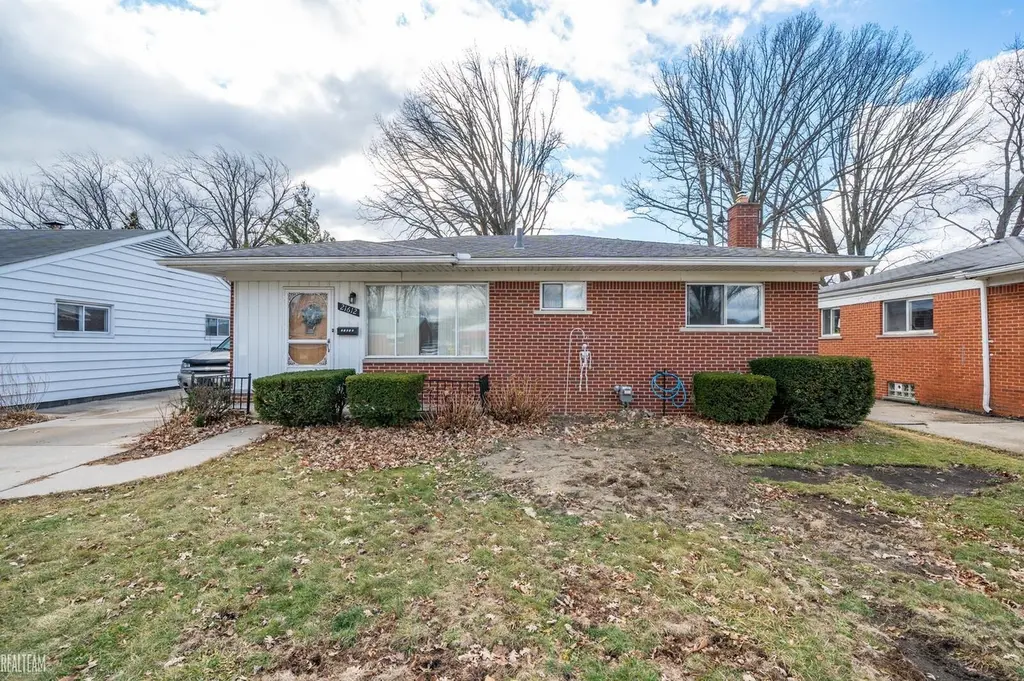
21612 Bon Brae St · St. Clair Shores, MI
Flood risk 1/10 · Minimal
- FEMA flood zone
- X (unshaded)
- Chance of flooding over 30 yrs
- 0.0%
- Est. flood insurance / yr
- $473 – $860
Fire risk 1/10 · Minimal
- Est. fire insurance / yr
- $784 – $1,456
Heat risk 3/10 · Minor
- Hot days now (above 96°F)
- 7 days/yr
- Hot days in 30 yrs
- 15 days/yr
Wind risk 1/10 · Minimal
- Chance of severe wind over 30 yrs
- —
Air-quality risk 4/10 · Minor
- Unhealthy air days now
- 4 days/yr
- Unhealthy air days in 30 yrs
- 5 days/yr
Risk factors via First Street. Map © Google.
Why this score? — see what drove the F grade
The composite is a weighted blend of 9 inputs, each scored 0–100. Each bar is that input's sub-score; the figure is the points it added to the 100-point composite (weight × sub-score).
- Cash flow +4.5/30.0
- ARV discount +3.8/15.0
- Schools +3.6/10.0
- Rent growth +2.5/5.0
- Livability +2.5/5.0
- Condition / age +2.5/5.0
- 1% rule +1.3/10.0
- DSCR +0.0/10.0
- Appreciation +0.0/10.0
$217,500
🖨 Deal sheet (PDF) 📄 Offer letter ✓ Due diligence
Listing remarks MLS
Welcome home to this charming ranch in St. Clair Shores, ideally located near Lake St. Clair and the vibrant Nautical Mile. This home features three bedrooms and one and a half bathrooms, offering a comfortable and functional layout. The spacious living room provides plenty of room for relaxing or entertaining, while the eat-in kitchen offers ample space for everyday dining. The finished basement adds valuable additional living space and includes a bathroom already prepped for a future remodel. Outside, enjoy a fenced yard perfect for pets or gatherings, along with a detached two-car garage for added convenience and storage. A fantastic opportunity to experience lakeside living, just steps from the Nautical Mile and scenic waterfront parks. Conveniently located near downtown St. Clair Shores, with easy access to shopping, dining, and vibrant local activities. Additional updates include a brand new sewer line summer of 2025.
Key facts
- Fenced yard
- Finished basement
- Near lake st. clair
Tags
Property features AI
Finance
- Other: Lot dimensions approximately 50 x 125 (0.14 acres)
- HOA & community: Homeowners association present
Exterior
- Parking: Detached covered garage; 2 garage spaces; Assigned paved parking
- Utilities: Public water; Public sewer
- Home design: Single-family residence; One story
- Construction: Brick construction
- Exterior features: Patio; Fenced yard; Paved road access
Interior
- Kitchen: Oven; Range; Refrigerator
- Bathrooms: 1 full bathroom; 1 half bathroom
- Heating & cooling: Forced air heating (natural gas); Central air conditioning
- Interior features: Eat-in kitchen; Finished basement; 6 total rooms
Neighborhood map
What this means for you Summary
Snapshot
- This is a 3-bed/2.5-bath single-family listed at $218k.
Deal economics
- At list price, monthly cash flow is $-559 ($-7k/yr) — negative.
- To cash-flow at today's rent, offer at most $119k (45.4% below list).
- To meet the 1% rule (rent ≥ 1% of price), the offer needs to be $137k (37.2% below list).
- Recommended offer: $119k (45.4% below list) — sets the bar for cash-flow.
- Cap rate 3.2% vs local median 4.0% in St. Clair Shores — below-typical yield; the buyer is paying a premium for something (appreciation thesis, condition, location) that the cap rate doesn't capture.
Location & tenants
- Location reads: area grade F — affects rentability + tenant quality, not the cash-flow math above.
- Lakeview Public Schools (Macomb) (suburban): math 32% / reading 51% proficiency, ranked #180 of 540 in MI (top 33%) — families likely to look elsewhere, expect single-tenant / working-renter base with shorter leases.
- Zoned schools: Ardmore Elementary School (math 47% / reading 52%, grade D, #382 of 1,397 statewide, top 30%, 381 students, 35% FRL); Jefferson Middle School (math 33% / reading 52%, grade D-, #183 of 493 statewide, top 37%, 956 students, 50% FRL); Lakeview High School (math 30% / reading 64%, grade D-, #187 of 713 statewide, top 29%, 1,465 students, 42% FRL).
- Market conditions: 118 active listings in the ZIP; 8 comparable units currently listed for rent nearby; rentals at typical pace (median 26d on market — plan ~3-4 weeks tenant-placement turnaround); 1,321 units permitted in Macomb County in 2024 (86 in 5+ unit buildings).
Forward outlook
- Local home prices are declining (-3.0%/yr); year-one equity from $2k of loan paydown is wiped out by about $7k of value loss. Plan a longer hold.
- Macomb County population projected at +9% by 2050 — modest demand growth; plan on rents tracking national, not racing it.
Negotiation context
- Only 7 days on market — expect competitive offers; lowballing is unlikely to land.
- 6 sale attempts since 2y ago with the ask held roughly flat each time — persistent listings suggest the price (not the market) is what's stuck; bring a comps-based counter.
Risks & watch-outs
- Watch-outs: built in 1959 — expect roof / HVAC / electrical / plumbing capex.
Questions for the listing agent
- What do current leases actually rent for vs. the listed asking? Can we see a recent rent roll and the last 12 months of T-12 income?
- Built in 1959 — when were the roof, HVAC, electrical panel, plumbing, and water heater last replaced?
- Is there a deadline driving the sale (1031 exchange, divorce, estate, relocation)? That informs how much negotiation room exists.
- The area grade is low — what's the realistic commute time and amenity access for the typical tenant pool here? Any planned neighborhood developments (good or bad) we should know about?
- What's the average days-on-market for RENTAL listings here right now (not sales)? A rising rental-DOM trend means longer vacancies and softer asking-rent achievability than the comps imply.
- What's the recent tenant-quality profile in this submarket — average credit score on applications, eviction rate, late-payment / NSF rate, and stable-employment percentage? A property-management company in the area should have these aggregated.
- How much new for-sale + rental construction is in the pipeline within 1–3 miles? Heavy new supply typically softens prices + rents 12–24 months out; constrained supply supports both.
Investment metrics
- 1% rule
- 0.63% ✗
- Cap rate
- 3.21%
- Cash-on-cash
- -11.02%
- DSCR
- 0.51
- GRM
- 13.3
CMA / ARV
- ARV (on-the-fly)
- $201,144
- Comps found
- 12
Show comp detail 12 sales within ~0.75 mi
| Address | Dist | Beds/Ba | Sqft | Sold | Price | $/sf | Match |
|---|---|---|---|---|---|---|---|
| 21100 Bon Brae St | 0.30mi | 3/2.0 | 924 (-6%) | 1mo | $249,900 | $270 | 73 |
| 21232 Ardmore Park Dr | 0.33mi | 3/1.0 | 1,037 (+5%) | 0mo | $205,000 | $198 | 69 |
| 22006 Maple St | 0.42mi | 3/2.0 | 1,070 (+8%) | 4mo | $199,999 | $187 | 61 |
| 22301 Bon Heur St | 0.33mi | 2/1.0 (-1) | 892 (-10%) | 1mo | $190,000 | $213 | 56 |
| 21601 Kramer St | 0.63mi | 3/1.0 | 1,025 (+4%) | 2mo | $172,500 | $168 | 56 |
| 20835 Ardmore Park Dr | 0.55mi | 3/2.0 | 1,076 (+9%) | 3mo | $250,000 | $232 | 54 |
| 21800 Maple Ave | 0.36mi | 2/1.0 (-1) | 888 (-10%) | 2mo | $171,000 | $193 | 54 |
| 22459 Daniels St | 0.58mi | 2/1.0 (-1) | 921 (-7%) | 1mo | $149,000 | $162 | 50 |
| 22417 Maple St | 0.65mi | 2/1.0 (-1) | 945 (-4%) | 3mo | $247,500 | $262 | 50 |
| 21520 Maple St | 0.36mi | 3/1.0 | 1,125 (+14%) | 5mo | $230,000 | $204 | 50 |
| 20899 Sunnydale St | 0.50mi | 3/1.0 | 1,100 (+12%) | 4mo | $227,000 | $206 | 48 |
| 22445 Wildwood St | 0.51mi | 2/1.0 (-1) | 1,100 (+12%) | 2mo | $222,000 | $202 | 44 |
Match score weights: distance 35% · size 25% · config 20% · recency 20%. Top-matched comps best support the ARV.
Projected returns pro-forma
-3.0% appreciation · 3.0% rent growth · sell at horizon
- IRR
- -36.3%
- Equity multiple
- -0.16×
- Total profit
- $-70,757
- Equity at exit
- $32,430
- IRR
- -49.8%
- Equity multiple
- -0.76×
- Total profit
- $-107,053
- Equity at exit
- $18,805
Cash invested: $60,900 (down + closing). Projections, not guarantees.
Landlord ↔ Tenant lean methodology
- Overall (STATE)
- 62 Landlord-Friendly
- State Michigan
- 62 Landlord-Friendly · EVEN
- County
- — inherits STATE
- City
- — inherits STATE
ZIP-level market 48081
- Active inventory
- 118
- Price-to-rent
- 13.3×
Monthly cashflow live
- Estimated rent
- $1,366 high interval (Pro) →
- Mortgage (P&I)
- −$1,141
- Tax from tax record
- −$408 /mo · $4,890/yr
- Insurance
- −$91
- HOA
- −$0
- Vacancy / Maint / Mgmt
- −$287
- Net cashflow
- $-559
Break-even live
Sensitivity live
| Price | -10% $-436 | -5% $-498 | +0% $-559 | +5% $-621 | +10% $-682 |
|---|---|---|---|---|---|
| Rent | -10% $-667 | -5% $-613 | +0% $-559 | +5% $-505 | +10% $-451 |
| Rate | -1.0pp $-450 | -0.5pp $-504 | base $-559 | +0.5pp $-616 | +1.0pp $-673 |
UW: 25.0% down · 7.5% · 30yr · 1.5% tax · 5.0% vac · 8.0% maint · 8.0% mgmt
Financing live
Cash to close
- Down payment
- $54,375
- Closing costs
- $6,525
- Reserves months
- —
- Total cash needed
- —
Loan-product check · same deal, 3 products live
Conventional
25% down · 7.5% · 30yr
- Down + closing
- —
- Monthly P&I
- —
- Monthly cashflow
- —
- DSCR
- —
- Eligible?
- —
Personal DTI + credit; lowest rate.
DSCR
20% down · 8.5% · 30yr
- Down + closing
- —
- Monthly P&I
- —
- Monthly cashflow
- —
- DSCR
- —
- Eligible?
- —
No personal income docs; deal must DSCR.
Hard money
10% down · 12.0% · 12mo
- Down + closing
- —
- Monthly P&I
- —
- Monthly cashflow
- —
- DSCR
- —
- Eligible?
- —
Short-term bridge; refi at stabilization.
Rent comps 8 comps
| Address | Beds | Baths | Sqft | Rent | $/sqft | DOM | Units | Dist |
|---|---|---|---|---|---|---|---|---|
| 26324 Harper Unit 4 St Clair Shores, MI | 2.0 | 1.0 | 700 | $1,195 | $1.71 | 26d | 1 | 0.11mi |
| 26324 Harper Ave Unit 6 St Clair Shores, MI | 3.0 | 1.0 | 1100 | $1,345 | $1.22 | 26d | 1 | 0.11mi |
| 22412 Milner St Saint Clair Shores, MI | 3.0 | 1.0 | 1060 | $2,000 | $1.89 | 3d | 1 | 0.74mi |
| 24901 Jefferson Ave Unit 210 St Clair Shores, MI | 2.0 | 1.0 | 700 | $1,250 | $1.79 | 1d | 1 | 0.75mi |
| 401 Northshore Dr St Clair Shores, MI | 2.0 | 1.0–1.5 | 970 | $1,554 | $1.60 | 0d | 4 | 1.13mi |
| 21540 Saint Gertrude St #12 Saint Clair Shores, MI | 2.0 | 1.5 | 871 | $1,200 | $1.38 | 26d | 1 | 1.34mi |
| 24000 Jefferson Ave Unit 218 St Clair Shores, MI | 2.0 | 2.0 | 1000 | $1,800 | $1.80 | 45d | 1 | 1.42mi |
| 218 Riviera Dr St Clair Shores, MI | 2.0 | 2.0 | 1000 | $1,800 | $1.80 | 45d | 1 | 1.42mi |
Listing history 33 events
-
2026-06-21days on market $217,500 Active 7 DOM
-
2026-06-18days on market $217,500 Active 4 DOM
-
2026-06-17days on market $217,500 Active 3 DOM
-
2026-06-16days on market $217,500 Active 2 DOM
-
2026-06-15days on market $217,500 Active 1 DOM
-
2026-06-15pricedays on market $217,500 Active 3 DOM
-
2026-06-13days on market $220,000 Active 43 DOM
-
2026-06-13days on market $220,000 Active 42 DOM
-
2026-06-09days on market $220,000 Active 39 DOM
-
2026-06-08days on market $220,000 Active 38 DOM
-
2026-06-07days on market $220,000 Active 37 DOM
-
2026-06-04days on market $220,000 Active 34 DOM
-
2026-06-03days on market $220,000 Active 33 DOM
-
2026-06-02pricedays on market $220,000 Active 32 DOM
-
2026-06-01days on market $225,000 Active 31 DOM
-
2026-05-31days on market $225,000 Active 30 DOM
-
2026-05-01$225,000 Active
Show marketing remark (937 chars)
Welcome home to this charming ranch in St. Clair Shores, ideally located near Lake St. Clair and the vibrant Nautical Mile. This home features three bedrooms and one and a half bathrooms, offering a comfortable and functional layout. The spacious living room provides plenty of room for relaxing or entertaining, while the eat-in kitchen offers ample space for everyday dining. The finished basement adds valuable additional living space and includes a bathroom already prepped for a future remodel. Outside, enjoy a fenced yard perfect for pets or gatherings, along with a detached two-car garage for added convenience and storage. A fantastic opportunity to experience lakeside living, just steps from the Nautical Mile and scenic waterfront parks. Conveniently located near downtown St. Clair Shores, with easy access to shopping, dining, and vibrant local activities. Additional updates include a brand new sewer line summer of 2025.
-
2026-05-01$225,000 Active 937-char remark
Show marketing remark (937 chars)
Welcome home to this charming ranch in St. Clair Shores, ideally located near Lake St. Clair and the vibrant Nautical Mile. This home features three bedrooms and one and a half bathrooms, offering a comfortable and functional layout. The spacious living room provides plenty of room for relaxing or entertaining, while the eat-in kitchen offers ample space for everyday dining. The finished basement adds valuable additional living space and includes a bathroom already prepped for a future remodel. Outside, enjoy a fenced yard perfect for pets or gatherings, along with a detached two-car garage for added convenience and storage. A fantastic opportunity to experience lakeside living, just steps from the Nautical Mile and scenic waterfront parks. Conveniently located near downtown St. Clair Shores, with easy access to shopping, dining, and vibrant local activities. Additional updates include a brand new sewer line summer of 2025.
-
2026-03-17historical
-
2026-03-17historical
-
2026-02-13price $225,000
-
2026-02-12price $225,000
-
2026-01-30price $227,500
-
2026-01-29price $227,500
-
2026-01-13$230,000 Active
-
2026-01-13$230,000 Active
-
2024-07-24soldstatus $225,000
-
2024-07-23soldstatus $225,000
-
2024-07-23soldstatus $225,000 Closed
-
2024-06-23status Pending
-
2024-06-18historical Accepting Backup Offers
-
2024-06-14$218,000
-
2024-06-14$218,000 Active
ⓘ Source: listings_history table (triggers on properties + properties_extension) + one-shot
backfill from property_details.listing_events for pre-trigger history.
Tax reassessment forecast MI · Partial reset (capped growth)
- Current annual tax
- $4,890 · $408/mo
- Projected year-2 tax
- $4,890 · $408/mo
- Expected delta
- $0/yr ($0/mo · 0.0%)
ⓘ Screening estimate from a state-policy table — verify with the county assessor before closing.
Climate risk First Street
- Flood 1/10 Low FEMA zone X (unshaded) · 0% chance over 30 yrs
- Wildfire 1/10 Low
- Heat 3/10 Moderate 7 d/yr ≥96°F today · 15 d/yr by 30 yrs out
- Wind 1/10 Low
- Air quality 4/10 Moderate 4 unhealthy d/yr today · 5 by 30 yrs out
Nearby sold comps map
Loading sold comps map…
Walkable amenities ~0.75 mi
Loading nearby amenities…
Taxation est. · year 1
- Rental income
- $16,398
- − Mortgage interest
- −$12,183
- − Property taxes
- −$4,890
- − Insurance
- −$1,088
- − Repairs & maintenance
- −$1,312
- − Management
- −$1,312
- − Depreciation
- −$6,327
- Taxable loss
- −$10,714
- Est. tax savings @ 24.0%
- +$2,571
- After-tax cash flow
- $-4,139/yr
For passive investors: Depreciation is non-cash, so a rental often shows a tax loss while cash-flowing — sheltering income. Rental losses are passive: they offset passive income freely, and up to $25,000/yr can offset ordinary (W-2) income if you actively participate and your MAGI is under $100k (phasing out to $0 by $150k); unused losses carry forward. On sale, claimed depreciation is recaptured at up to 25%, and gains may owe capital-gains tax (a 1031 exchange can defer both). Figures are a year-1 estimate at your 24.0% rate — not tax advice; consult a CPA.
Schools (NCES district)
- District
- Lakeview Public Schools (Macomb)
- NCES district ID
- 2620880
- Math proficiency
- 32% ▼ -14.00%
- Reading proficiency
- 51% ▼ -4.00%
- Median HH income
- $54,411
- Composite
- 36.09/100
- National rank
- #4759
- State rank
- #180 of 540 in MI
Livability — St. Clair Shores
No livability data for this city. (Only ~50 U.S. cities are tracked.)
Census & demographics
- Census place
- St. Clair Shores, MI
- City population
- 58,217
- Population (ZIP)
- 20,254
Population outlook (Macomb County) Hauer SSP2
- Today (2025)
- 925,296 people
- By 2030
- 948,226 · +2.5%
- By 2040
- 983,961 · +6.3%
- By 2050
- 1,010,200 · +9.2%
- By 2075
- 1,076,222 · +16.3%
- By 2100
- 1,077,065 · +16.4%
Race, ethnicity, and origin ACS 2023
- Neighborhood character
- Predominantly White (92%)
- Race & ethnicity
- White 92% Two or more races 4% Black 3% Hispanic / Latino 2%
- Common ancestry
- Romanian 17% Lithuanian 6% Iranian 2%
- Foreign-born
- 3% · Canada
- Languages at home
- 96% English-only · Russian/Polish/Slavic 1% Other Indo-European 1% Other Asian/Pacific 1%
Political lean MEDSL · Macomb
- 2024 margin
- R (+13.7) · D 42.2% · R 55.9% · Other 1.9%
- 2008→2024 swing
- -22.3pp toward R · 2008: 8.6pp · 2024: -13.7pp
- All cycles
- 2024: R+13.7 2020: R+8.1 2016: R+11.6 2012: D+4.0 2008: D+8.6
Not yet ingested
- Civics
- —
Market trends
- HPI YoY
- ▼ -271.01%
- Current HPI
- 206.6455
- Rent YoY
- —
- Metro
- —
- State GDP YoY
- ▲ 1.37%
- F500 in state
- 28
Industry mix (Fortune 500 HQ in MI)
| Industry | F500 HQs | Revenue |
|---|---|---|
| Automotive Parts | 3 | $48B |
|
||
| Automotive | 2 | $372B |
|
||
| Chemicals | 1 | $45B |
|
||
| Automotive Retail | 1 | $29B |
|
||
| Healthcare / Medical Devices | 1 | $23B |
|
||
| Automotive Technology | 1 | $20B |
|
||
Price history
+3.2% since first listed17 events — show timeline
- 2026-05-01 Listed $225,000 MiRealSource-MiMLS
- 2026-05-01 Listed $225,000 REALCOMP
- 2026-03-17 Listing Removed — MiRealSource-MiMLS
- 2026-03-17 Listing Removed — REALCOMP
- 2026-02-13 Price Changed $225,000 MiRealSource-MiMLS
- 2026-02-12 Price Changed $225,000 REALCOMP
- 2026-01-30 Price Changed $227,500 MiRealSource-MiMLS
- 2026-01-29 Price Changed $227,500 REALCOMP
- 2026-01-13 Listed $230,000 REALCOMP
- 2026-01-13 Listed $230,000 MiRealSource-MiMLS
- 2024-07-24 Sold (Public Records) $225,000 Public Records
- 2024-07-23 Sold (MLS) $225,000 MiRealSource-MiMLS
- 2024-07-23 Sold (MLS) $225,000 REALCOMP
- 2024-06-23 Pending — MiRealSource-MiMLS
- 2024-06-18 Contingent — MiRealSource-MiMLS
- 2024-06-14 Listed $218,000 MiRealSource-MiMLS
- 2024-06-14 Listed $218,000 REALCOMP
Property tax history
+9.1%/yrLatest (2025): $4,890 · +106.0% YoY. Source: county tax records.
Cash-flow waterfall
monthlySold comps — $/sqft
last 12 mo · ≤1 miLoading sold comps…