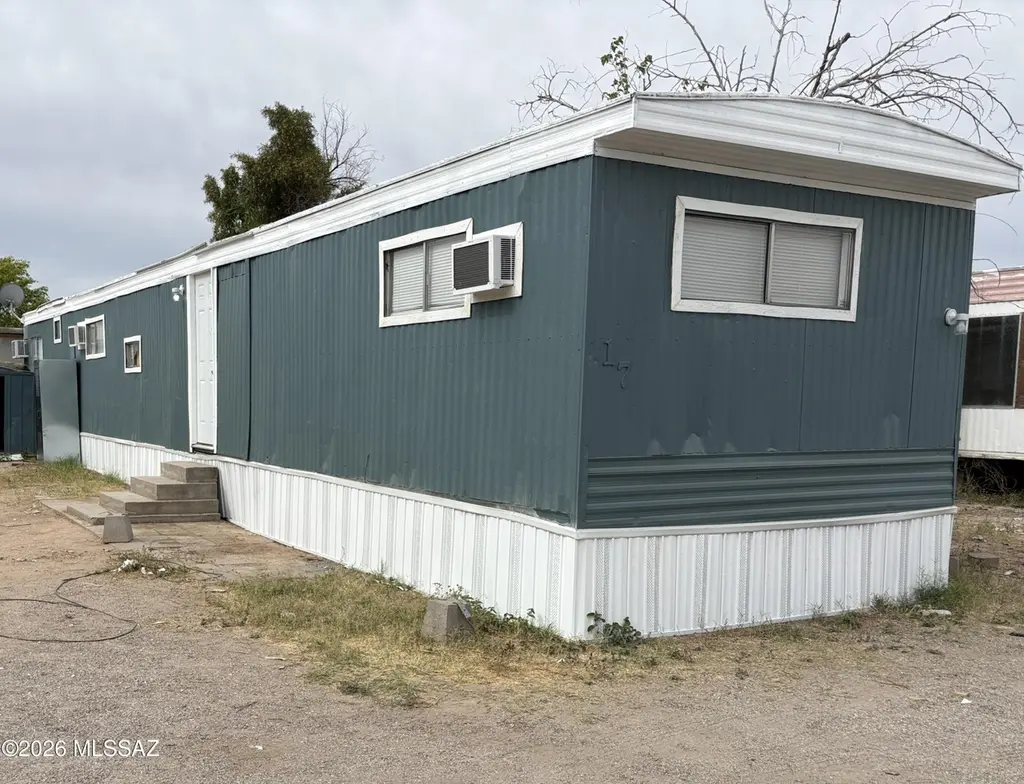
1741 W Wetmore Rd #17 · Flowing Wells, AZ
Flood risk 1/10 · Minimal
- FEMA flood zone
- X (unshaded)
- Chance of flooding over 30 yrs
- 0.0%
- Est. flood insurance / yr
- $507 – $1,088
Fire risk 4/10 · Minor
- Est. fire insurance / yr
- $610 – $1,132
Heat risk 8/10 · Major
- Hot days now (above 107°F)
- 6 days/yr
- Hot days in 30 yrs
- 17 days/yr
Wind risk 1/10 · Minimal
- Chance of severe wind over 30 yrs
- —
Air-quality risk 1/10 · Minimal
- Unhealthy air days now
- 0 days/yr
- Unhealthy air days in 30 yrs
- 0 days/yr
Risk factors via First Street. Map © Google.
Why this score? — see what drove the D+ grade
The composite is a weighted blend of 9 inputs, each scored 0–100. Each bar is that input's sub-score; the figure is the points it added to the 100-point composite (weight × sub-score).
- Cash flow +15.0/30.0
- ARV discount +11.6/15.0
- 1% rule +5.0/10.0
- DSCR +5.0/10.0
- Livability +3.7/5.0
- Rent growth +2.6/5.0
- Condition / age +2.5/5.0
- Schools +2.2/10.0
- Appreciation +0.0/10.0
$17,000
🖨 Deal sheet 📄 Offer letter ✓ Due diligence
Listing remarks
Renovated mobile home in Desert Sun Mobile Home Park - 3 bedrooms - Family Park - $515/mo lot rent - buyer must qualify - Window ACs plus Mini Split - newer flooring, cabinets, fixtures, nice unit
Key facts
- Newer cabinets
- Newer flooring
- Mini split
Tags
Property features AI
Finance
- Other: Lot dimensions approximately 12 x 60; Lot size approximately 1,500 sq ft; Zoned Pima County - MU
Exterior
- Utilities: Water from a water company; Sewer connected
- Home design: Mobile home; One story; Faces north
- Construction: Metal siding; Built-up roof; Originally built as a mobile home
- Exterior features: Paved road access; Owner-maintained road; North/South exposure
Interior
- Kitchen: Refrigerator; Gas range
- Flooring: Laminate
- Bathrooms: 1 full bathroom
- Heating & cooling: Mini-split heating; Ceiling fans; Window cooling unit(s)
- Interior features: Refrigerator; Gas range; Laminate flooring
Neighborhood map
What this means for you Summary
Snapshot
- This is a 3-bed/1.0-bath manufactured listed at $17k.
Deal economics
- At list price, monthly cash flow is $793 ($10k/yr) — positive.
- The deal already cash-flows at list — no discount required.
- Meets the 1% rule at list price ($1k rent vs $17k).
- Recommended offer: $17k (1.5% below list) — sets the bar for market timing.
- Cap rate 62.2% vs local median 6.1% in Flowing Wells — top-decile yield for the area; either an underpriced asset or a hidden risk that comps aren't pricing in. Stress-test before assuming the spread holds.
Location & tenants
- Location reads 73/100 on livability (#21 in AZ) — a middle-class / working-renter tenant base. Strengths: commute A+, cost of living A+, health & safety A+; Watch: crime F, amenities F, employment F.
- Flowing Wells Unified District (4405) (suburban): math 23% / reading 30% proficiency, ranked #143 of 249 in AZ (top 57%) — low school quality limits family demand, transient renter base, plan for 1-2y turnover; 64% free/reduced lunch — lower-income household profile, screen leases tightly.
- Zoned schools: Centennial Elementary School (math 25% / reading 32%, grade F, #580 of 1,109 statewide, top 53%, 448 students, 81% FRL); Flowing Wells Junior High School (math 24% / reading 28%, grade F, #100 of 218 statewide, top 47%, 818 students, 74% FRL); Flowing Wells High School (math 22% / reading 24%, grade F, #208 of 381 statewide, top 55%, 1,694 students, 65% FRL).
- Market conditions: Rents flat; 177 active listings in the ZIP; 6 comparable units currently listed for rent nearby; rentals lingering (median 44d on market — plan ~5-8 weeks vacancy on turnover, expect pricing pressure); 67% of comp listings sitting > 30 days — soft ceiling on asking rent; lower-income renter base — watch delinquency; 5,268 units permitted in Pima County in 2024 (996 in 5+ unit buildings).
- This rent runs 37% of the median local income ($37k/yr) — at the standard rent-burdened threshold; future hikes will face affordability resistance.
Forward outlook
- Local home prices are declining (-3.0%/yr); year-one equity from $118 of loan paydown is wiped out by about $510 of value loss. Plan a longer hold.
- Pima County population projected at +8% by 2050 — modest demand growth; plan on rents tracking national, not racing it.
- At projected returns (-3.0% appreciation + 0.3% rent growth), your $5k cash investment doubles in ~1 year — after that, you're playing with house money.
Negotiation context
- It's been on market 27 days — a 2% lower offer ($17k) is reasonable based on typical stale-listing flexibility.
Risks & watch-outs
- Climate carrying-cost: extreme-heat days projected 6→17/yr by 2055 (HVAC capex compounding) — expect insurance premiums to compound above CPI over the hold.
Questions for the listing agent
- Built in 1971 — when were the roof, HVAC, electrical panel, plumbing, and water heater last replaced?
- Is there a deadline driving the sale (1031 exchange, divorce, estate, relocation)? That informs how much negotiation room exists.
- Schools are D-rated, which usually means shorter tenancies and higher turnover. Who's the typical renter profile here, and what's been the actual vacancy rate?
- Crime grade is F in this area — have there been break-ins, vandalism, or insurance claims at this property in the last 3 years? What carrier currently insures it and at what premium?
- The area grade is low — what's the realistic commute time and amenity access for the typical tenant pool here? Any planned neighborhood developments (good or bad) we should know about?
- What's the average days-on-market for RENTAL listings here right now (not sales)? A rising rental-DOM trend means longer vacancies and softer asking-rent achievability than the comps imply.
- What's the recent tenant-quality profile in this submarket — average credit score on applications, eviction rate, late-payment / NSF rate, and stable-employment percentage? A property-management company in the area should have these aggregated.
- How much new for-sale + rental construction is in the pipeline within 1–3 miles? Heavy new supply typically softens prices + rents 12–24 months out; constrained supply supports both.
Investment metrics
- 1% rule
- 6.78% ✓
- Cap rate
- 62.24%
- Cash-on-cash
- 199.81%
- DSCR
- 9.89
- GRM
- 1.2
CMA / ARV
- ARV (on-the-fly)
- $18,720
- Comps found
- 10
Show comp detail 10 sales within ~0.75 mi
| Address | Dist | Beds/Ba | Sqft | Sold | Price | $/sf | Match |
|---|---|---|---|---|---|---|---|
| 1741 W Wetmore Rd #34 | 0.00mi | 3/2.0 | 720 (0%) | 0mo | $19,000 | $26 | 96 |
| 1741 W Wetmore Rd #23 | 0.04mi | 3/1.5 | 720 (0%) | 8mo | $17,500 | $24 | 89 |
| 1741 W Wetmore Rd #33 | 0.04mi | 2/2.0 (-1) | 720 (0%) | 5mo | $16,000 | $22 | 85 |
| 1741 W Wetmore Rd #15 | 0.04mi | 3/1.5 | 720 (0%) | 22mo | $17,500 | $24 | 78 |
| 1741 W Wetmore Rd #22 | 0.04mi | 3/1.5 | 720 (0%) | 23mo | $17,500 | $24 | 77 |
| 4439 N Old Romero Rd #18 | 0.32mi | 3/2.0 | 750 (+4%) | 8mo | $45,000 | $60 | 68 |
| 1358 W Mohawk Dr | 0.67mi | 2/1.0 (-1) | 720 (0%) | 0mo | $115,000 | $160 | 63 |
| 1741 W Wetmore Rd #5 | 0.04mi | 2/1.0 (-1) | 800 (+11%) | 16mo | $3,000 | $4 | 61 |
| 4737 N Kenwood Ct | 0.52mi | 2/1.0 (-1) | 784 (+9%) | 4mo | $199,900 | $255 | 52 |
| 1537 W Wabash St | 0.43mi | 2/2.0 (-1) | 780 (+8%) | 8mo | $150,000 | $192 | 50 |
Match score weights: distance 35% · size 25% · config 20% · recency 20%. Top-matched comps best support the ARV.
Projected returns pro-forma
-3.0% appreciation · 0.3% rent growth · sell at horizon
- IRR
- —
- Equity multiple
- 10.39×
- Total profit
- $44,695
- Equity at exit
- $2,535
- IRR
- —
- Equity multiple
- 20.36×
- Total profit
- $92,143
- Equity at exit
- $1,470
Cash invested: $4,760 (down + closing). Projections, not guarantees.
Landlord ↔ Tenant lean methodology
- Overall (STATE)
- 87 Strongly Landlord-Friendly
- State Arizona
- 87 Strongly Landlord-Friendly · R+3
- County
- — inherits STATE
- City
- — inherits STATE
ZIP-level market 85705
- Rents YoY
- 0.3%
- Active inventory
- 177
- Price-to-rent
- 1.2×
Monthly cashflow live
- Estimated rent
- $1,152 high interval (Pro) →
- Mortgage (P&I)
- −$89
- Tax est. 1.5%
- −$21 /mo · $255/yr
- Insurance
- −$7
- HOA
- −$0
- Vacancy / Maint / Mgmt
- −$242
- Net cashflow
- $793
Break-even live
UW: 25.0% down · 7.5% · 30yr · 1.5% tax · 5.0% vac · 8.0% maint · 8.0% mgmt
Financing live
Cash to close
- Down payment
- $4,250
- Closing costs
- $510
- Reserves months
- —
- Total cash needed
- —
Loan-product check · same deal, 3 products live
Conventional
25% down · 7.5% · 30yr
- Down + closing
- —
- Monthly P&I
- —
- Monthly cashflow
- —
- DSCR
- —
- Eligible?
- —
Personal DTI + credit; lowest rate.
DSCR
20% down · 8.5% · 30yr
- Down + closing
- —
- Monthly P&I
- —
- Monthly cashflow
- —
- DSCR
- —
- Eligible?
- —
No personal income docs; deal must DSCR.
Hard money
10% down · 12.0% · 12mo
- Down + closing
- —
- Monthly P&I
- —
- Monthly cashflow
- —
- DSCR
- —
- Eligible?
- —
Short-term bridge; refi at stabilization.
Rent comps 6 comps
| Address | Beds | Baths | Sqft | Rent | $/sqft | DOM | Units | Dist |
|---|---|---|---|---|---|---|---|---|
| 1355 W Roger Rd Tucson, AZ | 1.0–2.0 | 1.0–2.0 | 627 | $1,084 | $1.73 | 43d | 4 | 0.70mi |
| 3802 N Flowing Wells Rd Tucson, AZ | 1.0–2.0 | 1.0 | 555 | $1,100 | $1.98 | 43d | 5 | 0.80mi |
| 1700 W Prince Rd Tucson, AZ | 1.0–2.0 | 1.0 | 618 | $1,099 | $1.78 | 1d | 25 | 0.85mi |
| 620 W Limberlost Dr Unit E24 Tucson, AZ | 2.0 | 1.0 | 672 | $1,200 | $1.79 | 23d | 1 | 1.16mi |
| 822 W Thurber Rd Unit B Tucson, AZ | 2.0 | 1.0 | 750 | $825 | $1.10 | 43d | 1 | 1.27mi |
| 570 W Prince Rd Tucson, AZ | 1.0–2.0 | 1.0 | 788 | $975 | $1.24 | 43d | 13 | 1.49mi |
Listing history 15 events
-
2026-06-18days on market $17,000 Active 27 DOM
-
2026-06-17days on market $17,000 Active 26 DOM
-
2026-06-16days on market $17,000 Active 25 DOM
-
2026-06-15days on market $17,000 Active 24 DOM
-
2026-06-13days on market $17,000 Active 22 DOM
-
2026-06-10days on market $17,000 Active 19 DOM
-
2026-06-09days on market $17,000 Active 18 DOM
-
2026-06-08days on market $17,000 Active 17 DOM
-
2026-06-07days on market $17,000 Active 16 DOM
-
2026-06-05days on market $17,000 Active 13 DOM
-
2026-06-03days on market $17,000 Active 12 DOM
-
2026-06-02days on market $17,000 Active 11 DOM
-
2026-06-01days on market $17,000 Active 10 DOM
-
2026-05-31days on market $17,000 Active 9 DOM
-
2026-05-21$17,000 Active
ⓘ Source: listings_history table (triggers on properties + properties_extension) + one-shot
backfill from property_details.listing_events for pre-trigger history.
Climate risk First Street
- Flood 1/10 Low FEMA zone X (unshaded) · 0% chance over 30 yrs
- Wildfire 4/10 Moderate
- Heat 8/10 Severe 6 d/yr ≥107°F today · 17 d/yr by 30 yrs out
- Wind 1/10 Low
- Air quality 1/10 Low 0 unhealthy d/yr today · 0 by 30 yrs out
Nearby sold comps map
Loading sold comps map…
Walkable amenities ~0.75 mi
Loading nearby amenities…
Taxation est. · year 1
- Rental income
- $13,824
- − Mortgage interest
- −$952
- − Property taxes
- −$255
- − Insurance
- −$85
- − Repairs & maintenance
- −$1,106
- − Management
- −$1,106
- − Depreciation
- −$495
- Taxable income
- $9,825
- Est. tax owed @ 24.0%
- −$2,358
- After-tax cash flow
- $7,153/yr
For passive investors: Depreciation is non-cash, so a rental often shows a tax loss while cash-flowing — sheltering income. Rental losses are passive: they offset passive income freely, and up to $25,000/yr can offset ordinary (W-2) income if you actively participate and your MAGI is under $100k (phasing out to $0 by $150k); unused losses carry forward. On sale, claimed depreciation is recaptured at up to 25%, and gains may owe capital-gains tax (a 1031 exchange can defer both). Figures are a year-1 estimate at your 24.0% rate — not tax advice; consult a CPA.
Schools (NCES district)
- District
- Flowing Wells Unified District (4405)
- NCES district ID
- 0403010
- Math proficiency
- 23% ▼ -19.00%
- Reading proficiency
- 30% ▼ -14.00%
- Median HH income
- $33,361
- Composite
- 21.69/100
- National rank
- #8271
- State rank
- #143 of 249 in AZ
Livability — Flowing Wells
- Score
- 73/100
- State rank
- #21
- US rank
- #5288
Category grades
Schools grade is shown separately in the Schools card above.
Census & demographics
- Census place
- Flowing Wells, AZ
- County
- Pima County · 1,012,107 people
- Metro
- Tucson, AZ
- Population (ZIP)
- 54,700
- Household income
- $37,194
- Rent vs Own
- Severe rent burden
- 4240.0
Population outlook (Pima County) Hauer SSP2
- Today (2025)
- 1,066,056 people
- By 2030
- 1,086,684 · +1.9%
- By 2040
- 1,117,160 · +4.8%
- By 2050
- 1,149,778 · +7.9%
- By 2075
- 1,271,480 · +19.3%
- By 2100
- 1,321,160 · +23.9%
Race, ethnicity, and origin ACS 2023
- Neighborhood character
- Diverse neighborhood (Simpson 0.63)
- Race & ethnicity
- Hispanic / Latino 45% White 41% Two or more races 18% Asian 4% Black 3% Native American 3%
- Hispanic origin (detail)
- Mexican 41%
- Common ancestry
- Portuguese 2% Romanian 2% Lithuanian 2%
- Foreign-born
- 18% · Canada, China, Vietnam
- Languages at home
- 65% English-only · Spanish 30% Chinese 1% Vietnamese 1%
Political lean MEDSL · Pima
- 2024 margin
- D (+15.2) · D 57.0% · R 41.8% · Other 1.2%
- 2008→2024 swing
- +9.1pp toward D · 2008: 6.1pp · 2024: 15.2pp
- All cycles
- 2024: D+15.2 2020: D+18.7 2016: D+13.5 2012: D+5.8 2008: D+6.1
Not yet ingested
- Civics
- —
Market trends
- HPI YoY
- ▼ -163.31%
- Current HPI
- 283.0647
- Rent YoY
- ▲ 0.30%
- Metro
- Tucson, AZ
- State GDP YoY
- ▲ 4.54%
- F500 in state
- 20
Industry mix (Fortune 500 HQ in AZ)
| Industry | F500 HQs | Revenue |
|---|---|---|
| Technology | 2 | $13B |
|
||
| Mining / Metals | 1 | $23B |
|
||
| Environmental Services | 1 | $16B |
|
||
| Metals / Steel | 1 | $14B |
|
||
| Technology Distribution | 1 | $9B |
|
||
| Homebuilding | 1 | $8B |
|
||
Price history
1 event — show timeline
- 2026-05-21 Listed $17,000 MLSSAZ
Cash-flow waterfall
monthlySold comps — $/sqft
last 12 mo · ≤1 miLoading sold comps…