2160 Jones Rd · Jacks Creek, TN
Flood risk 1/10 · Minimal
- FEMA flood zone
- X (unshaded)
- Chance of flooding over 30 yrs
- 0.0%
- Est. flood insurance / yr
- $473 – $860
Fire risk 4/10 · Minor
- Est. fire insurance / yr
- $949 – $1,763
Heat risk 6/10 · Moderate
- Hot days now (above 109°F)
- 7 days/yr
- Hot days in 30 yrs
- 21 days/yr
Wind risk 4/10 · Minor
- Chance of severe wind over 30 yrs
- 14.0%
Air-quality risk 1/10 · Minimal
- Unhealthy air days now
- 0 days/yr
- Unhealthy air days in 30 yrs
- 0 days/yr
Risk factors via First Street. Map © Google.
Why this score? — see what drove the B+ grade
The composite is a weighted blend of 9 inputs, each scored 0–100. Each bar is that input's sub-score; the figure is the points it added to the 100-point composite (weight × sub-score).
- Cash flow +30.0/30.0
- 1% rule +10.0/10.0
- DSCR +10.0/10.0
- Appreciation +10.0/10.0
- ARV discount +7.5/15.0
- Schools +3.3/10.0
- Rent growth +2.5/5.0
- Livability +2.5/5.0
- Condition / age +2.5/5.0
$55,000
🖨 Deal sheet 📄 Offer letter ✓ Due diligence
Listing remarks MLS
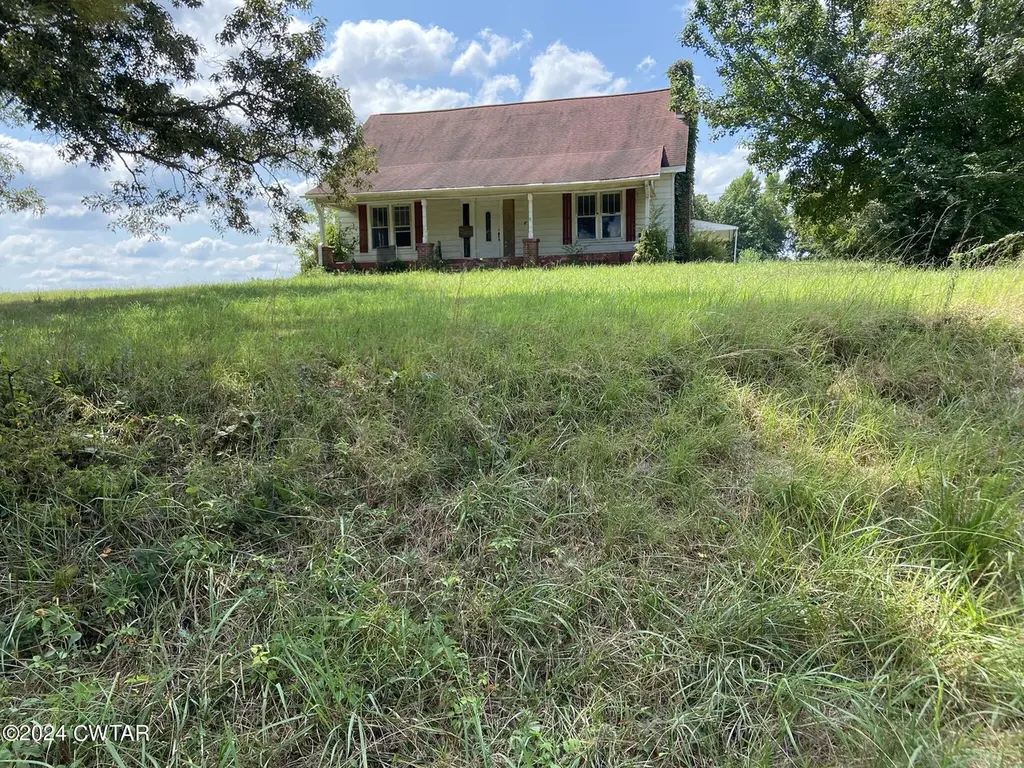
Renovations have been started on this large country home sitting on one acre. Staircase to unfinished attic area could also be finished. Needs complete remodel including floors. New well installed June 2022. TWO ADDITIONAL LOTS ARE AVAILABLE FOR PURCHASE BY BUYER, BUT ACREAGE CANT BE SOLD UNTIL HOUSE SITTING ON 1 ACRE CLOSED
Key facts
- 1 acre lot
- Parking
- Built 1924
Neighborhood map
What this means for you Summary
Snapshot
- This is a 2-bed/1.0-bath other listed at $55k.
Deal economics
- At list price, monthly cash flow is $499 ($6k/yr) — positive.
- The deal already cash-flows at list — no discount required.
- Meets the 1% rule at list price ($1k rent vs $55k).
- Recommended offer: $48k (12.0% below list) — sets the bar for market timing.
Location & tenants
- Location reads: area grade B — affects rentability + tenant quality, not the cash-flow math above.
- Chester County (rural): math 42% / reading 37% proficiency, ranked #15 of 139 in TN (top 11%) — families likely to look elsewhere, expect single-tenant / working-renter base with shorter leases.
- Market conditions: 4 active listings in the ZIP; 18 units permitted in Chester County in 2024 (0 in 5+ unit buildings).
Forward outlook
- In year one you build about $6k of equity ($380 loan paydown + $6k appreciation (10.0% local appreciation)).
- At projected returns (10.0% appreciation + 3.0% rent growth), your $15k cash investment doubles in ~2 years — after that, you're playing with house money.
- By year 6, paydown + projected appreciation supports a ~$35k cash-out refi (75% LTV) — recoverable capital for the next deal without selling this one.
Negotiation context
- It's been on market 675 days — a 12% lower offer ($48k) is reasonable based on typical stale-listing flexibility.
- Current owner paid $26k; list at $55k implies a 108% gain — meaningful room to come down on a strong offer.
Risks & watch-outs
- Watch-outs: built in 1924 — expect roof / HVAC / electrical / plumbing capex.
- Climate carrying-cost: extreme-heat days projected 7→21/yr by 2055 (HVAC capex compounding) — expect insurance premiums to compound above CPI over the hold.
Questions for the listing agent
- It's been on market 675 days. Have you received any prior offers? Is the seller open to a 12% concession, seller financing, or rate buy-down credit?
- Built in 1924 — when were the roof, HVAC, electrical panel, plumbing, and water heater last replaced?
- Why hasn't it sold? Are there any deal-killer items the seller is aware of (foundation, flood, title, zoning, code violations)?
- Is there a deadline driving the sale (1031 exchange, divorce, estate, relocation)? That informs how much negotiation room exists.
- What's the average days-on-market for RENTAL listings here right now (not sales)? A rising rental-DOM trend means longer vacancies and softer asking-rent achievability than the comps imply.
- What's the recent tenant-quality profile in this submarket — average credit score on applications, eviction rate, late-payment / NSF rate, and stable-employment percentage? A property-management company in the area should have these aggregated.
- How much new for-sale + rental construction is in the pipeline within 1–3 miles? Heavy new supply typically softens prices + rents 12–24 months out; constrained supply supports both.
Investment metrics
- 1% rule
- 1.90% ✓
- Cap rate
- 17.17%
- Cash-on-cash
- 38.86%
- DSCR
- 2.73
- GRM
- 4.4
CMA / ARV
- ARV (median comp)
- $277,766
- List price
- $55,000
- Delta
- -80.20%
- Verdict
- UNDERPRICED
- Comps
- 4 within 2.0 mi
Projected returns pro-forma
10.0% appreciation · 3.0% rent growth · sell at horizon
- IRR
- 54.3%
- Equity multiple
- 5.01×
- Total profit
- $61,699
- Equity at exit
- $49,548
- IRR
- 47.8%
- Equity multiple
- 11.17×
- Total profit
- $156,684
- Equity at exit
- $106,853
Cash invested: $15,400 (down + closing). Projections, not guarantees.
Landlord ↔ Tenant lean methodology
- Overall (STATE)
- 87 Strongly Landlord-Friendly
- State Tennessee
- 87 Strongly Landlord-Friendly · R+13
- County
- — inherits STATE
- City
- — inherits STATE
ZIP-level market 38352
- Home prices YoY
- 4.4%
- Active inventory
- 4
- Price-to-rent
- 4.4×
Monthly cashflow live
- Estimated rent
- $1,047 medium interval (Pro) →
- Mortgage (P&I)
- −$288
- Tax from tax record
- −$17 /mo · $201/yr
- Insurance
- −$23
- HOA
- −$0
- Vacancy / Maint / Mgmt
- −$220
- Net cashflow
- $499
Break-even live
UW: 25.0% down · 7.5% · 30yr · 1.5% tax · 5.0% vac · 8.0% maint · 8.0% mgmt
Financing live
Cash to close
- Down payment
- $13,750
- Closing costs
- $1,650
- Reserves months
- —
- Total cash needed
- —
Loan-product check · same deal, 3 products live
Conventional
25% down · 7.5% · 30yr
- Down + closing
- —
- Monthly P&I
- —
- Monthly cashflow
- —
- DSCR
- —
- Eligible?
- —
Personal DTI + credit; lowest rate.
DSCR
20% down · 8.5% · 30yr
- Down + closing
- —
- Monthly P&I
- —
- Monthly cashflow
- —
- DSCR
- —
- Eligible?
- —
No personal income docs; deal must DSCR.
Hard money
10% down · 12.0% · 12mo
- Down + closing
- —
- Monthly P&I
- —
- Monthly cashflow
- —
- DSCR
- —
- Eligible?
- —
Short-term bridge; refi at stabilization.
Listing history 17 events
-
2026-06-18days on market $55,000 Active 675 DOM
-
2026-06-17days on market $55,000 Active 674 DOM
-
2026-06-16days on market $55,000 Active 673 DOM
-
2026-06-15days on market $55,000 Active 672 DOM
-
2026-06-13days on market $55,000 Active 670 DOM
-
2026-06-12days on market $55,000 Active 669 DOM
-
2026-06-09days on market $55,000 Active 666 DOM
-
2026-06-08days on market $55,000 Active 665 DOM
-
2026-06-08days on market $55,000 Active 664 DOM
-
2026-06-07pricedays on market $55,000 Active 663 DOM
-
2026-06-04days on market $59,900 Active 660 DOM
-
2026-06-02days on market $59,900 Active 659 DOM
-
2026-06-01days on market $59,900 Active 658 DOM
-
2026-05-31days on market $59,900 Active 657 DOM
-
2025-10-22price $59,900 328-char remark
Show marketing remark (328 chars)
Renovations have been started on this large country home sitting on one acre. Staircase to unfinished attic area could also be finished. Needs complete remodel including floors. New well installed June 2022. TWO ADDITIONAL LOTS ARE AVAILABLE FOR PURCHASE BY BUYER, BUT ACREAGE CANT BE SOLD UNTIL HOUSE SITTING ON 1 ACRE CLOSED
-
2024-08-09$65,000 Active 328-char remark
Show marketing remark (328 chars)
Renovations have been started on this large country home sitting on one acre. Staircase to unfinished attic area could also be finished. Needs complete remodel including floors. New well installed June 2022. TWO ADDITIONAL LOTS ARE AVAILABLE FOR PURCHASE BY BUYER, BUT ACREAGE CANT BE SOLD UNTIL HOUSE SITTING ON 1 ACRE CLOSED
-
1999-07-16soldstatus $26,500
ⓘ Source: listings_history table (triggers on properties + properties_extension) + one-shot
backfill from property_details.listing_events for pre-trigger history.
Tax reassessment forecast TN · Resets to sale price
- Current annual tax
- $201 · $17/mo
- Projected year-2 tax
- $390 · $33/mo
- Expected delta
- +$190/yr (+$16/mo · 94.3%)
ⓘ Screening estimate from a state-policy table — verify with the county assessor before closing.
Climate risk First Street
- Flood 1/10 Low FEMA zone X (unshaded) · 0% chance over 30 yrs
- Wildfire 4/10 Moderate
- Heat 6/10 Major 7 d/yr ≥109°F today · 21 d/yr by 30 yrs out
- Wind 4/10 Moderate 14% chance of damaging wind over 30 yrs
- Air quality 1/10 Low 0 unhealthy d/yr today · 0 by 30 yrs out
Nearby sold comps map
Loading sold comps map…
Walkable amenities ~0.75 mi
Loading nearby amenities…
Taxation est. · year 1
- Rental income
- $12,558
- − Mortgage interest
- −$3,081
- − Property taxes
- −$201
- − Insurance
- −$275
- − Repairs & maintenance
- −$1,005
- − Management
- −$1,005
- − Depreciation
- −$1,600
- Taxable income
- $5,392
- Est. tax owed @ 24.0%
- −$1,294
- After-tax cash flow
- $4,690/yr
For passive investors: Depreciation is non-cash, so a rental often shows a tax loss while cash-flowing — sheltering income. Rental losses are passive: they offset passive income freely, and up to $25,000/yr can offset ordinary (W-2) income if you actively participate and your MAGI is under $100k (phasing out to $0 by $150k); unused losses carry forward. On sale, claimed depreciation is recaptured at up to 25%, and gains may owe capital-gains tax (a 1031 exchange can defer both). Figures are a year-1 estimate at your 24.0% rate — not tax advice; consult a CPA.
Schools (NCES district)
- District
- Chester County
- NCES district ID
- 4700600
- Math proficiency
- 42% ▼ -4.00%
- Reading proficiency
- 37% ▼ -4.00%
- Median HH income
- $41,740
- Composite
- 33.32/100
- National rank
- #5502
- State rank
- #15 of 139 in TN
Livability — Jacks Creek
No livability data for this city. (Only ~50 U.S. cities are tracked.)
Census & demographics
- Population (ZIP)
- 623
Population outlook (Chester County) Hauer SSP2
- Today (2025)
- 17,948 people
- By 2030
- 18,156 · +1.2%
- By 2040
- 18,392 · +2.5%
- By 2050
- 18,411 · +2.6%
- By 2075
- 18,385 · +2.4%
- By 2100
- 18,211 · +1.5%
Race, ethnicity, and origin ACS 2023
- Neighborhood character
- Predominantly White (100%)
- Race & ethnicity
- White 100%
- Common ancestry
- Italian 13%
Political lean MEDSL · Chester
- 2024 margin
- Solid R (+64.9) · D 17.0% · R 81.9% · Other 1.1%
- 2008→2024 swing
- -21.7pp toward R · 2008: -43.2pp · 2024: -64.9pp
- All cycles
- 2024: R+64.9 2020: R+59.9 2016: R+60.3 2012: R+47.7 2008: R+43.2
Not yet ingested
- Civics
- —
Market trends
- HPI YoY
- ▲ 10.23%
- Current HPI
- 241.5676
- Rent YoY
- —
- Metro
- —
- State GDP YoY
- ▲ 2.78%
- F500 in state
- 22
Industry mix (Fortune 500 HQ in TN)
| Industry | F500 HQs | Revenue |
|---|---|---|
| Healthcare | 3 | $91B |
|
||
| Retail | 3 | $72B |
|
||
| Transportation / Logistics | 1 | $88B |
|
||
| Paper / Packaging | 1 | $19B |
|
||
| Insurance | 1 | $13B |
|
||
| Energy | 1 | $12B |
|
||
Price history
+126.0% since first listed3 events — show timeline
- 2025-10-22 Price Changed $59,900 CWTAR
- 2024-08-09 Listed $65,000 CWTAR
- 1999-07-16 Sold (Public Records) $26,500 Public Records
Property tax history
-6.6%/yrLatest (2025): $201 · -49.2% YoY. Source: county tax records.
Cash-flow waterfall
monthlySold comps — $/sqft
last 12 mo · ≤1 miLoading sold comps…