6995 State Route 17C · Crest View Heights, NY
Flood risk 1/10 · Minimal
- FEMA flood zone
- X (unshaded)
- Chance of flooding over 30 yrs
- 0.0%
- Est. flood insurance / yr
- $507 – $1,088
Fire risk 2/10 · Minimal
- Est. fire insurance / yr
- $691 – $1,283
Heat risk 3/10 · Minor
- Hot days now (above 95°F)
- 8 days/yr
- Hot days in 30 yrs
- 17 days/yr
Wind risk 2/10 · Minimal
- Chance of severe wind over 30 yrs
- 1.0%
Air-quality risk 2/10 · Minimal
- Unhealthy air days now
- 0 days/yr
- Unhealthy air days in 30 yrs
- 1 days/yr
Risk factors via First Street. Map © Google.
Why this score? — see what drove the D- grade
The composite is a weighted blend of 9 inputs, each scored 0–100. Each bar is that input's sub-score; the figure is the points it added to the 100-point composite (weight × sub-score).
- Cash flow +12.3/30.0
- Schools +5.3/10.0
- 1% rule +4.3/10.0
- Rent growth +4.3/5.0
- DSCR +3.7/10.0
- Livability +2.5/5.0
- Condition / age +2.5/5.0
- ARV discount +1.8/15.0
- Appreciation +0.0/10.0
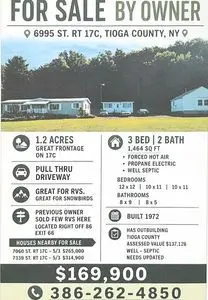
$169,900
🖨 Deal sheet (PDF) 📄 Offer letter ✓ Due diligence
Listing remarks
Great for rvs large pull through u drive country setting close to 86 exit 66 . Needs updating sold as-is no financing . Nice property . Drive by take a look. Then call for appointment.
Key facts
- Large pull through
- Country setting
- Built 1972
Tags
Neighborhood map
What this means for you Summary
Snapshot
- This is a 3-bed/1.0-bath single-family listed at $170k.
Deal economics
- At list price, monthly cash flow is $-31 ($-368/yr) — negative.
- To cash-flow at today's rent, offer at most $164k (3.2% below list).
- To meet the 1% rule (rent ≥ 1% of price), the offer needs to be $157k (7.5% below list).
- Recommended offer: $157k (7.5% below list) — sets the bar for 1% rule.
Location & tenants
- Location reads: area grade D — affects rentability + tenant quality, not the cash-flow math above.
- Owego-Apalachin Central School District (town): math 62% / reading 62% proficiency, ranked #204 of 590 in NY (top 35%) — acceptable for families but not a draw, mixed tenant base, ~2y average lease.
- Zoned schools: Apalachin Elementary School (math 72% / reading 67%, grade A-, #447 of 2,108 statewide, top 24%, 388 students, 35% FRL); Owego-Apalachin Middle School (math 36% / reading 57%, grade D+, #330 of 729 statewide, top 46%, 443 students, 45% FRL); Owego Free Academy (math 98% / reading 75%, grade A, #342 of 1,100 statewide, top 31%, 606 students, 41% FRL).
- Market conditions: Rents rising fast (+7.1%/yr); 217 active listings in the ZIP; 139 units permitted in Tioga County in 2024 (65 in 5+ unit buildings).
Forward outlook
- Local home prices are declining (-3.0%/yr); year-one equity from $1k of loan paydown is wiped out by about $5k of value loss. Plan a longer hold.
- Tioga County population projected at -27% by 2050 — secular population decline; favor cash flow + early exit over multi-decade hold.
Negotiation context
- It's been on market 32 days — a 3% lower offer ($165k) is reasonable based on typical stale-listing flexibility.
- 2 sale attempts with the ask held roughly flat each time — persistent listings suggest the price (not the market) is what's stuck; bring a comps-based counter.
Questions for the listing agent
- What do current leases actually rent for vs. the listed asking? Can we see a recent rent roll and the last 12 months of T-12 income?
- It's been on market 32 days. Have you received any prior offers? Is the seller open to a 7% concession, seller financing, or rate buy-down credit?
- Built in 1972 — when were the roof, HVAC, electrical panel, plumbing, and water heater last replaced?
- Is there a deadline driving the sale (1031 exchange, divorce, estate, relocation)? That informs how much negotiation room exists.
- The area grade is low — what's the realistic commute time and amenity access for the typical tenant pool here? Any planned neighborhood developments (good or bad) we should know about?
- What's the average days-on-market for RENTAL listings here right now (not sales)? A rising rental-DOM trend means longer vacancies and softer asking-rent achievability than the comps imply.
- What's the recent tenant-quality profile in this submarket — average credit score on applications, eviction rate, late-payment / NSF rate, and stable-employment percentage? A property-management company in the area should have these aggregated.
- How much new for-sale + rental construction is in the pipeline within 1–3 miles? Heavy new supply typically softens prices + rents 12–24 months out; constrained supply supports both.
Investment metrics
- 1% rule
- 0.93% ✗
- Cap rate
- 6.08%
- Cash-on-cash
- -0.77%
- DSCR
- 0.97
- GRM
- 9.0
CMA / ARV
- ARV (on-the-fly)
- $150,792
- Comps found
- 4
Show comp detail 4 sales within ~0.75 mi
| Address | Dist | Beds/Ba | Sqft | Sold | Price | $/sf | Match |
|---|---|---|---|---|---|---|---|
| 178 Belknap Rd | 0.09mi | 3/2.0 | 1,482 (+1%) | 15mo | $140,000 | $94 | 77 |
| 36 Deming Dr | 0.33mi | 3/1.0 | 1,575 (+8%) | 22mo | $180,000 | $114 | 53 |
| 598 Main St | 0.71mi | 4/1.5 (+1) | 1,560 (+7%) | 9mo | $75,000 | $48 | 42 |
| 185 Pennsylvania Ave | 0.75mi | 4/1.5 (+1) | 1,504 (+3%) | 23mo | $155,000 | $103 | 34 |
Match score weights: distance 35% · size 25% · config 20% · recency 20%. Top-matched comps best support the ARV.
Projected returns pro-forma
-3.0% appreciation · 7.09% rent growth · sell at horizon
- IRR
- -12.7%
- Equity multiple
- 0.52×
- Total profit
- $-22,665
- Equity at exit
- $25,333
- IRR
- 2.0%
- Equity multiple
- 1.17×
- Total profit
- $8,159
- Equity at exit
- $14,690
Cash invested: $47,572 (down + closing). Projections, not guarantees.
Landlord ↔ Tenant lean methodology
- Overall (STATE)
- 15 Strongly Tenant-Friendly
- State New York
- 15 Strongly Tenant-Friendly · D+10
- County
- — inherits STATE
- City
- — inherits STATE
ZIP-level market 13760
- Home prices YoY
- -32.7%
- Rents YoY
- 7.1%
- Active inventory
- 217
- Price-to-rent
- 9.0×
Monthly cashflow live
- Estimated rent
- $1,572 medium interval (Pro) →
- Mortgage (P&I)
- −$891
- Tax from tax record
- −$311 /mo · $3,727/yr
- Insurance
- −$71
- HOA
- −$0
- Vacancy / Maint / Mgmt
- −$330
- Net cashflow
- $-31
Break-even live
Sensitivity live
| Price | -10% $66 | -5% $17 | +0% $-31 | +5% $-79 | +10% $-127 |
|---|---|---|---|---|---|
| Rent | -10% $-155 | -5% $-93 | +0% $-31 | +5% $31 | +10% $94 |
| Rate | -1.0pp $55 | -0.5pp $13 | base $-31 | +0.5pp $-75 | +1.0pp $-119 |
UW: 25.0% down · 7.5% · 30yr · 1.5% tax · 5.0% vac · 8.0% maint · 8.0% mgmt
Financing live
Cash to close
- Down payment
- $42,475
- Closing costs
- $5,097
- Reserves months
- —
- Total cash needed
- —
Loan-product check · same deal, 3 products live
Conventional
25% down · 7.5% · 30yr
- Down + closing
- —
- Monthly P&I
- —
- Monthly cashflow
- —
- DSCR
- —
- Eligible?
- —
Personal DTI + credit; lowest rate.
DSCR
20% down · 8.5% · 30yr
- Down + closing
- —
- Monthly P&I
- —
- Monthly cashflow
- —
- DSCR
- —
- Eligible?
- —
No personal income docs; deal must DSCR.
Hard money
10% down · 12.0% · 12mo
- Down + closing
- —
- Monthly P&I
- —
- Monthly cashflow
- —
- DSCR
- —
- Eligible?
- —
Short-term bridge; refi at stabilization.
Listing history 21 events
-
2026-06-21days on market $169,900 Active 32 DOM
-
2026-06-19days on market $169,900 Active 30 DOM
-
2026-06-18days on market $169,900 Active 29 DOM
-
2026-06-17days on market $169,900 Active 28 DOM
-
2026-06-16days on market $169,900 Active 27 DOM
-
2026-06-15days on market $169,900 Active 26 DOM
-
2026-06-14days on market $169,900 Active 24 DOM
-
2026-06-13days on market $169,900 Active 23 DOM
-
2026-06-10days on market $169,900 Active 21 DOM
-
2026-06-09days on market $169,900 Active 20 DOM
-
2026-06-08days on market $169,900 Active 19 DOM
-
2026-06-07days on market $169,900 Active 18 DOM
-
2026-06-05days on market $169,900 Active 15 DOM
-
2026-06-03days on market $169,900 Active 14 DOM
-
2026-06-02days on market $169,900 Active 13 DOM
-
2026-06-01days on market $169,900 Active 12 DOM
-
2026-05-31days on market $169,900 Active 11 DOM
-
2026-05-30days on market $169,900 Active 10 DOM
-
2026-05-21$169,900 Active
-
2025-11-18price $189,000
-
2025-11-06$199,000 Active
ⓘ Source: listings_history table (triggers on properties + properties_extension) + one-shot
backfill from property_details.listing_events for pre-trigger history.
Tax reassessment forecast NY · Partial reset (capped growth)
- Current annual tax
- $3,727 · $311/mo
- Projected year-2 tax
- $3,727 · $311/mo
- Expected delta
- $0/yr ($0/mo · 0.0%)
ⓘ Screening estimate from a state-policy table — verify with the county assessor before closing.
Climate risk First Street
- Flood 1/10 Low FEMA zone X (unshaded) · 0% chance over 30 yrs
- Wildfire 2/10 Low
- Heat 3/10 Moderate 8 d/yr ≥95°F today · 17 d/yr by 30 yrs out
- Wind 2/10 Low 100% chance of damaging wind over 30 yrs
- Air quality 2/10 Low 0 unhealthy d/yr today · 1 by 30 yrs out
Nearby sold comps map
Loading sold comps map…
Walkable amenities ~0.75 mi
Loading nearby amenities…
Taxation est. · year 1
- Rental income
- $18,861
- − Mortgage interest
- −$9,517
- − Property taxes
- −$3,727
- − Insurance
- −$850
- − Repairs & maintenance
- −$1,509
- − Management
- −$1,509
- − Depreciation
- −$4,943
- Taxable loss
- −$3,193
- Est. tax savings @ 24.0%
- +$766
- After-tax cash flow
- $398/yr
For passive investors: Depreciation is non-cash, so a rental often shows a tax loss while cash-flowing — sheltering income. Rental losses are passive: they offset passive income freely, and up to $25,000/yr can offset ordinary (W-2) income if you actively participate and your MAGI is under $100k (phasing out to $0 by $150k); unused losses carry forward. On sale, claimed depreciation is recaptured at up to 25%, and gains may owe capital-gains tax (a 1031 exchange can defer both). Figures are a year-1 estimate at your 24.0% rate — not tax advice; consult a CPA.
Schools (NCES district)
- District
- Owego-Apalachin Central School District
- NCES district ID
- 3622170
- Math proficiency
- 62% ▼ -1.00%
- Reading proficiency
- 62% ▲ 6.00%
- Median HH income
- $57,425
- Composite
- 53.45/100
- National rank
- #1464
- State rank
- #204 of 590 in NY
Livability — Crest View Heights
No livability data for this city. (Only ~50 U.S. cities are tracked.)
Census & demographics
- County
- Broome County · 126,805 people
- Metro
- Binghamton, NY
- Population (ZIP)
- 42,896
- Household income
- $66,095
- Rent vs Own
- Severe rent burden
- 1480.0
Population outlook (Tioga County) Hauer SSP2
- Today (2025)
- 45,155 people
- By 2030
- 42,801 · -5.2%
- By 2040
- 37,960 · -15.9%
- By 2050
- 33,071 · -26.8%
- By 2075
- 24,144 · -46.5%
- By 2100
- 16,545 · -63.4%
Race, ethnicity, and origin ACS 2023
- Neighborhood character
- Predominantly White (84%)
- Race & ethnicity
- White 84% Two or more races 7% Hispanic / Latino 6% Black 4% Asian 2%
- Hispanic origin (detail)
- Puerto Rican 2%
- Common ancestry
- Romanian 6% Lithuanian 2% Slovak 2%
- Foreign-born
- 5% · Canada, China
- Languages at home
- 94% English-only · Spanish 2% Other Indo-European 1% Russian/Polish/Slavic 1%
Political lean MEDSL · Tioga
- 2024 margin
- Strong R (+22.9) · D 38.6% · R 61.4%
- 2008→2024 swing
- -12.7pp toward R · 2008: -10.2pp · 2024: -22.9pp
- All cycles
- 2024: R+22.9 2020: R+20.6 2016: R+27.6 2012: R+15.1 2008: R+10.2
Not yet ingested
- Civics
- —
Market trends
- HPI YoY
- ▼ -131.29%
- Current HPI
- 270.2661
- Rent YoY
- ▲ 7.09%
- Metro
- Binghamton, NY
- State GDP YoY
- ▲ 2.60%
- F500 in state
- 92
Industry mix (Fortune 500 HQ in NY)
| Industry | F500 HQs | Revenue |
|---|---|---|
| Financial Services | 10 | $950B |
|
||
| Consumer Goods | 9 | $162B |
|
||
| Insurance | 4 | $225B |
|
||
| Telecommunications | 2 | $144B |
|
||
| Pharmaceuticals | 2 | $112B |
|
||
| Media / Entertainment | 2 | $69B |
|
||
Price history
-14.6% since first listed3 events — show timeline
- 2026-05-21 Listed $169,900 FSBO.com
- 2025-11-18 Price Changed $189,000 GBAOR
- 2025-11-06 Listed $199,000 GBAOR
Property tax history
+3.4%/yrLatest (2025): $3,727 · +19.0% YoY. Source: county tax records.
Cash-flow waterfall
monthlySold comps — $/sqft
last 12 mo · ≤1 miLoading sold comps…