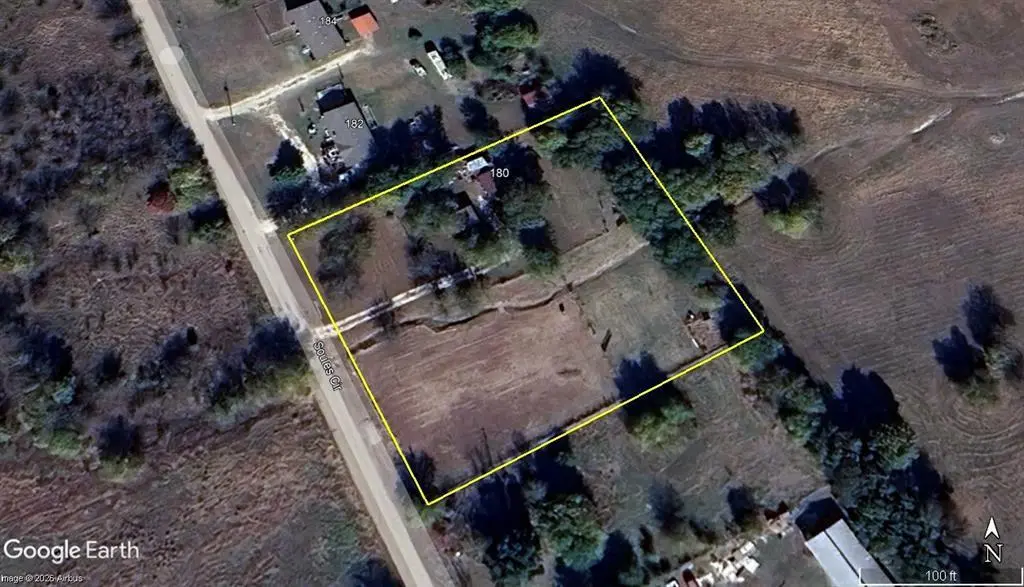
180 Soules Cir · Bruceville-Eddy, TX
Flood risk 1/10 · Minimal
- FEMA flood zone
- X (unshaded)
- Chance of flooding over 30 yrs
- 0.0%
- Est. flood insurance / yr
- $507 – $1,088
Fire risk 4/10 · Minor
- Est. fire insurance / yr
- $1,222 – $2,270
Heat risk 7/10 · Major
- Hot days now (above 109°F)
- 7 days/yr
- Hot days in 30 yrs
- 24 days/yr
Wind risk 6/10 · Moderate
- Chance of severe wind over 30 yrs
- 71.0%
Air-quality risk 1/10 · Minimal
- Unhealthy air days now
- 0 days/yr
- Unhealthy air days in 30 yrs
- 0 days/yr
Risk factors via First Street. Map © Google.
Why this score? — see what drove the B- grade
The composite is a weighted blend of 9 inputs, each scored 0–100. Each bar is that input's sub-score; the figure is the points it added to the 100-point composite (weight × sub-score).
- Cash flow +25.1/30.0
- Appreciation +10.0/10.0
- DSCR +8.2/10.0
- 1% rule +8.0/10.0
- ARV discount +7.4/15.0
- Rent growth +2.5/5.0
- Schools +2.5/10.0
- Livability +2.5/5.0
- Condition / age +2.5/5.0
$65,000
🖨 Deal sheet (PDF) 📄 Offer letter ✓ Due diligence
Listing remarks
1.3 Acres of land in the Bruceville-Eddy school district. Close proximity to schools and I-35. Old home place on the property is various stages of repair. Lot big enough for two potential build sites. Lot currently has multiple outbuildings and sheds.
Key facts
- 1.3 acres of land
- Sheds
- 1.3 acre lot
Tags
Neighborhood map
What this means for you Summary
Snapshot
- This is a 1-bed/1.0-bath single-family listed at $65k.
Deal economics
- At list price, monthly cash flow is $144 ($2k/yr) — positive.
- The deal already cash-flows at list — no discount required.
- Meets the 1% rule at list price ($842 rent vs $65k).
Location & tenants
- Location reads: area grade B — affects rentability + tenant quality, not the cash-flow math above.
- Bruceville-Eddy ISD (rural): math 26% / reading 30% proficiency, ranked #654 of 826 in TX (top 79%) — low school quality limits family demand, transient renter base, plan for 1-2y turnover.
- Zoned schools: Bruceville-Eddy El (115 students, 63% FRL); Bruceville-Eddy J H (math 17% / reading 17%, grade F, #1,520 of 1,662 statewide, top 92%, 162 students, 57% FRL); Bruceville-Eddy H S (math 34% / reading 44%, grade F, #821 of 1,632 statewide, top 53%, 191 students, 55% FRL).
- Market conditions: 38 active listings in the ZIP; 1,014 units permitted in McLennan County in 2024 (200 in 5+ unit buildings).
Forward outlook
- In year one you build about $7k of equity ($449 loan paydown + $6k appreciation (10.0% local appreciation)).
- McLennan County population projected at +17% by 2050 — long-run rental-demand tailwind backs the buy-and-hold thesis.
- At projected returns (10.0% appreciation + 3.0% rent growth), your $18k cash investment doubles in ~2 years — after that, you're playing with house money.
- By year 5, paydown + projected appreciation supports a ~$32k cash-out refi (75% LTV) — recoverable capital for the next deal without selling this one.
Negotiation context
- Only 10 days on market — expect competitive offers; lowballing is unlikely to land.
Risks & watch-outs
- Watch-outs: property tax is 2.8% of price.
- Climate carrying-cost: major wind risk, 71% chance of damaging wind over 30y; extreme-heat days projected 7→24/yr by 2055 (HVAC capex compounding) — expect insurance premiums to compound above CPI over the hold.
Questions for the listing agent
- Property tax is high relative to price — has the assessment been appealed recently, and will the sale trigger a re-assessment?
- Is there a deadline driving the sale (1031 exchange, divorce, estate, relocation)? That informs how much negotiation room exists.
- What's the average days-on-market for RENTAL listings here right now (not sales)? A rising rental-DOM trend means longer vacancies and softer asking-rent achievability than the comps imply.
- What's the recent tenant-quality profile in this submarket — average credit score on applications, eviction rate, late-payment / NSF rate, and stable-employment percentage? A property-management company in the area should have these aggregated.
- How much new for-sale + rental construction is in the pipeline within 1–3 miles? Heavy new supply typically softens prices + rents 12–24 months out; constrained supply supports both.
Investment metrics
- 1% rule
- 1.30% ✓
- Cap rate
- 8.95%
- Cash-on-cash
- 9.48%
- DSCR
- 1.42
- GRM
- 6.4
CMA / ARV
- ARV (on-the-fly)
- $64,860
- Comps found
- 1
Show comp detail 1 sale within ~0.75 mi
| Address | Dist | Beds/Ba | Sqft | Sold | Price | $/sf | Match |
|---|---|---|---|---|---|---|---|
| 180 Soules Cir | 0.00mi | 1/1.0 | 690 (0%) | 1mo | $65,000 | $94 | 99 |
Match score weights: distance 35% · size 25% · config 20% · recency 20%. Top-matched comps best support the ARV.
Projected returns pro-forma
10.0% appreciation · 3.0% rent growth · sell at horizon
- IRR
- 31.2%
- Equity multiple
- 3.45×
- Total profit
- $44,615
- Equity at exit
- $58,557
- IRR
- 27.0%
- Equity multiple
- 7.83×
- Total profit
- $124,296
- Equity at exit
- $126,281
Cash invested: $18,200 (down + closing). Projections, not guarantees.
Landlord ↔ Tenant lean methodology
- Overall (STATE)
- 87 Strongly Landlord-Friendly
- State Texas
- 87 Strongly Landlord-Friendly · R+5
- County
- — inherits STATE
- City
- — inherits STATE
ZIP-level market 76524
- Home prices YoY
- 6.5%
- Active inventory
- 38
- Price-to-rent
- 6.4×
Monthly cashflow live
- Estimated rent
- $842 medium interval (Pro) →
- Mortgage (P&I)
- −$341
- Tax from tax record
- −$153 /mo · $1,841/yr
- Insurance
- −$27
- HOA
- −$0
- Vacancy / Maint / Mgmt
- −$177
- Net cashflow
- $144
Break-even live
Sensitivity live
| Price | -10% $181 | -5% $162 | +0% $144 | +5% $125 | +10% $107 |
|---|---|---|---|---|---|
| Rent | -10% $77 | -5% $111 | +0% $144 | +5% $177 | +10% $210 |
| Rate | -1.0pp $177 | -0.5pp $160 | base $144 | +0.5pp $127 | +1.0pp $110 |
UW: 25.0% down · 7.5% · 30yr · 1.5% tax · 5.0% vac · 8.0% maint · 8.0% mgmt
Financing live
Cash to close
- Down payment
- $16,250
- Closing costs
- $1,950
- Reserves months
- —
- Total cash needed
- —
Loan-product check · same deal, 3 products live
Conventional
25% down · 7.5% · 30yr
- Down + closing
- —
- Monthly P&I
- —
- Monthly cashflow
- —
- DSCR
- —
- Eligible?
- —
Personal DTI + credit; lowest rate.
DSCR
20% down · 8.5% · 30yr
- Down + closing
- —
- Monthly P&I
- —
- Monthly cashflow
- —
- DSCR
- —
- Eligible?
- —
No personal income docs; deal must DSCR.
Hard money
10% down · 12.0% · 12mo
- Down + closing
- —
- Monthly P&I
- —
- Monthly cashflow
- —
- DSCR
- —
- Eligible?
- —
Short-term bridge; refi at stabilization.
Listing history 4 events
-
2026-04-23status Pending
-
2026-04-13$65,000 Active
-
2019-06-21soldstatus
-
2002-11-13soldstatus
ⓘ Source: listings_history table (triggers on properties + properties_extension) + one-shot
backfill from property_details.listing_events for pre-trigger history.
Tax reassessment forecast TX · Resets to sale price
- Current annual tax
- $1,841 · $153/mo
- Projected year-2 tax
- $1,841 · $153/mo
- Expected delta
- $0/yr ($0/mo · 0.0%)
ⓘ Screening estimate from a state-policy table — verify with the county assessor before closing.
Climate risk First Street
- Flood 1/10 Low FEMA zone X (unshaded) · 0% chance over 30 yrs
- Wildfire 4/10 Moderate
- Heat 7/10 Severe 7 d/yr ≥109°F today · 24 d/yr by 30 yrs out
- Wind 6/10 Major 71% chance of damaging wind over 30 yrs
- Air quality 1/10 Low 0 unhealthy d/yr today · 0 by 30 yrs out
Nearby sold comps map
Loading sold comps map…
Walkable amenities ~0.75 mi
Loading nearby amenities…
Taxation est. · year 1
- Rental income
- $10,104
- − Mortgage interest
- −$3,641
- − Property taxes
- −$1,841
- − Insurance
- −$325
- − Repairs & maintenance
- −$808
- − Management
- −$808
- − Depreciation
- −$1,891
- Taxable income
- $789
- Est. tax owed @ 24.0%
- −$189
- After-tax cash flow
- $1,536/yr
For passive investors: Depreciation is non-cash, so a rental often shows a tax loss while cash-flowing — sheltering income. Rental losses are passive: they offset passive income freely, and up to $25,000/yr can offset ordinary (W-2) income if you actively participate and your MAGI is under $100k (phasing out to $0 by $150k); unused losses carry forward. On sale, claimed depreciation is recaptured at up to 25%, and gains may owe capital-gains tax (a 1031 exchange can defer both). Figures are a year-1 estimate at your 24.0% rate — not tax advice; consult a CPA.
Schools (NCES district)
- District
- Bruceville-Eddy ISD
- NCES district ID
- 4811730
- Math proficiency
- 26% ▼ -10.00%
- Reading proficiency
- 30% ▼ -7.00%
- Median HH income
- $50,064
- Composite
- 24.54/100
- National rank
- #7645
- State rank
- #654 of 826 in TX
Livability — Bruceville-Eddy
No livability data for this city. (Only ~50 U.S. cities are tracked.)
Census & demographics
- Census place
- Bruceville-Eddy, TX
- Population (ZIP)
- 3,855
Population outlook (McLennan County) Hauer SSP2
- Today (2025)
- 264,191 people
- By 2030
- 273,578 · +3.6%
- By 2040
- 291,506 · +10.3%
- By 2050
- 308,044 · +16.6%
- By 2075
- 349,648 · +32.3%
- By 2100
- 364,779 · +38.1%
Race, ethnicity, and origin ACS 2023
- Neighborhood character
- Predominantly White (66%)
- Race & ethnicity
- White 66% Hispanic / Latino 27% Two or more races 19% Black 2%
- Hispanic origin (detail)
- Mexican 22%
- Common ancestry
- Lithuanian 2% Italian 2% Serbian 1%
- Foreign-born
- 10% · Canada
- Languages at home
- 85% English-only · Spanish 15%
Political lean MEDSL · McLennan
- 2024 margin
- Solid R (+30.9) · D 34.0% · R 64.9% · Other 1.0%
- 2008→2024 swing
- -7.0pp toward R · 2008: -23.9pp · 2024: -30.9pp
- All cycles
- 2024: R+30.9 2020: R+23.4 2016: R+27.1 2012: R+29.8 2008: R+23.9
Not yet ingested
- Civics
- —
Market trends
- HPI YoY
- ▲ 16.26%
- Current HPI
- 267.33
- Rent YoY
- —
- Metro
- —
- State GDP YoY
- ▲ 3.95%
- F500 in state
- 110
Industry mix (Fortune 500 HQ in TX)
| Industry | F500 HQs | Revenue |
|---|---|---|
| Energy | 16 | $1,198B |
|
||
| Technology | 5 | $198B |
|
||
| Engineering / Construction | 4 | $72B |
|
||
| Energy Services | 3 | $60B |
|
||
| Utilities | 3 | $41B |
|
||
| Healthcare | 2 | $330B |
|
||
Price history
4 events — show timeline
- 2026-04-23 Pending — NTREIS
- 2026-04-13 Listed $65,000 NTREIS
- 2019-06-21 Sold (Public Records) — Public Records
- 2002-11-13 Sold (Public Records) — Public Records
Property tax history
+11.7%/yrLatest (2025): $1,841 · +16.5% YoY. Source: county tax records.
Cash-flow waterfall
monthlySold comps — $/sqft
last 12 mo · ≤1 miLoading sold comps…