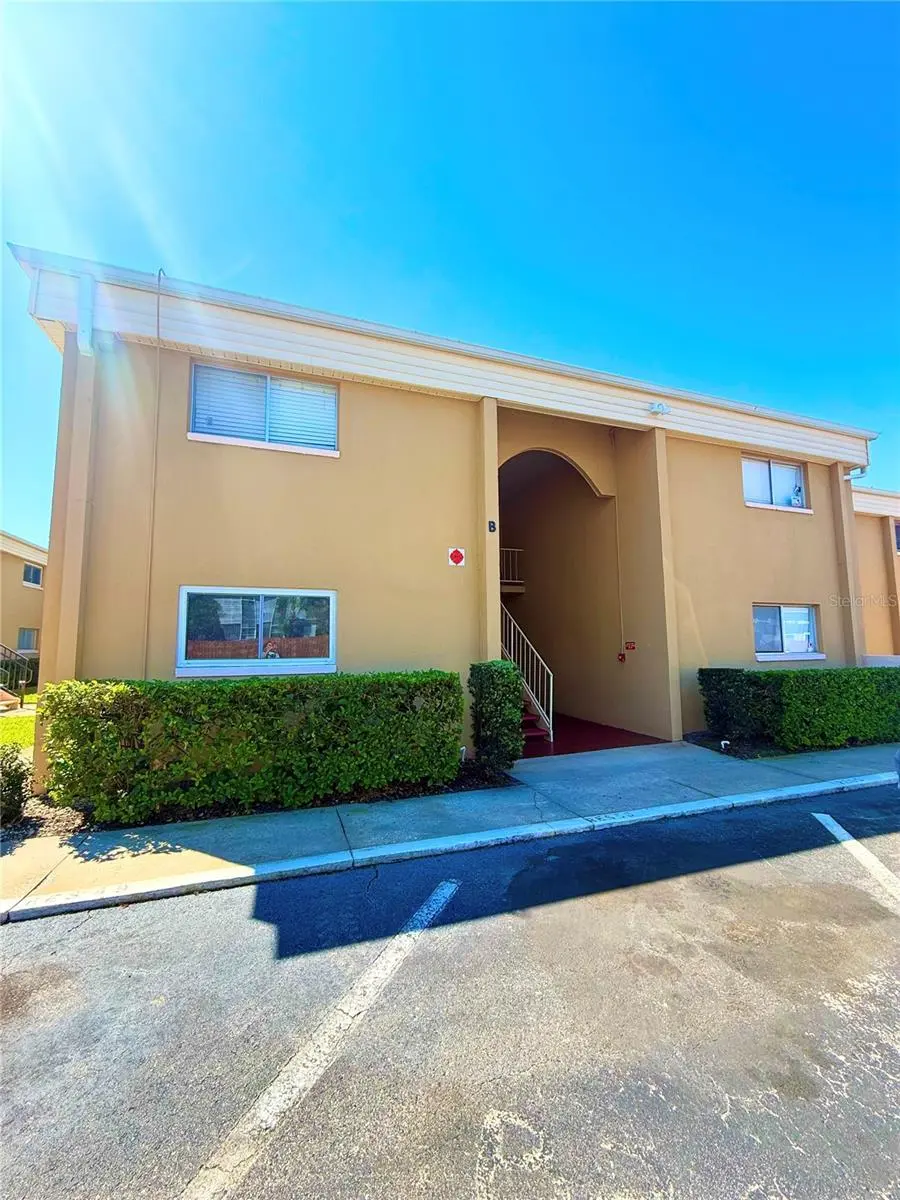
1000 Lake OF The Woods Blvd Unit 101B · Fern Park, FL
Flood risk 1/10 · Minimal
- FEMA flood zone
- X (unshaded)
- Chance of flooding over 30 yrs
- 0.0%
- Est. flood insurance / yr
- $507 – $1,088
Fire risk 1/10 · Minimal
- Est. fire insurance / yr
- $947 – $1,759
Heat risk 9/10 · Severe
- Hot days now (above 108°F)
- 7 days/yr
- Hot days in 30 yrs
- 23 days/yr
Wind risk 9/10 · Severe
- Chance of severe wind over 30 yrs
- 99.0%
Air-quality risk 2/10 · Minimal
- Unhealthy air days now
- 1 days/yr
- Unhealthy air days in 30 yrs
- 2 days/yr
Risk factors via First Street. Map © Google.
Why this score? — see what drove the C- grade
The composite is a weighted blend of 9 inputs, each scored 0–100. Each bar is that input's sub-score; the figure is the points it added to the 100-point composite (weight × sub-score).
- Cash flow +14.9/30.0
- 1% rule +9.1/10.0
- ARV discount +7.5/15.0
- Schools +5.1/10.0
- DSCR +4.6/10.0
- Livability +3.9/5.0
- Rent growth +2.5/5.0
- Condition / age +2.5/5.0
- Appreciation +0.0/10.0
$95,990
🖨 Deal sheet 📄 Offer letter ✓ Due diligence
Listing remarks
Great opportunity for a primary residence ONLY! JUST REDUCED!!!! Motivated seller! Open to offers. !This first-floor unit is offered at an excellent price within a well-maintained condominium community. The apartment is in good condition and provides a perfect canvas to personalize and make it your own. It includes one reserved parking space conveniently located directly in front of the unit, along with additional resident and guest parking available within the community. Don’t miss this opportunity to own a comfortable and well-located home!
Key facts
- First-floor unit
- $393 HOA
- Community pool
Tags
Property features AI
Finance
- Other: Unfurnished; Living area about 768 sq ft; Building area about 852 sq ft
- Financial info: Total annual fees: $4,716
- HOA & community: Monthly condo fee of $393 (includes maintenance—structure and grounds, pool, private road, sewer, trash, water); Association name: Marie Anderson; Community clubhouse and pool; Community mailbox; Deed-restricted community; Buyer approval required; Pets allowed (max 40 lbs)
Exterior
- Parking: Details not provided
- Security: Gate at community entrance
- Utilities: Public water; Public sewer; Public utilities
- Home design: Condominium; One-story; Faces north; Building B
- Construction: Stucco construction; Shingle roof; Other foundation
- Exterior features: Asphalt road access; Lot approximately 0.01 acres (condo land included)
Interior
- Kitchen: Dishwasher; Microwave; Range
- Bedrooms: 1 bedroom (first floor)
- Flooring: Tile
- Bathrooms: 1 full bathroom
- Heating & cooling: Central heating; Central air
- Interior features: Open floorplan; Central heating; Central air
- Laundry & utility: No laundry in unit
Neighborhood map
What this means for you Summary
Snapshot
- This is a 1-bed/1.0-bath condo listed at $96k.
Deal economics
- At list price, monthly cash flow is $28 ($334/yr) — positive.
- The deal already cash-flows at list — no discount required.
- Meets the 1% rule at list price ($1k rent vs $96k).
- Recommended offer: $90k (6.0% below list) — sets the bar for market timing.
- Cap rate 6.6% vs local median 3.8% in Fern Park — top-decile yield for the area; either an underpriced asset or a hidden risk that comps aren't pricing in. Stress-test before assuming the spread holds.
Location & tenants
- Location reads 77/100 on livability (#204 in FL, #3,165 nationally) — a middle-class / working-renter tenant base. Strengths: housing A+, health & safety A+, crime A; Watch: amenities D, commute F.
- Seminole (suburban): math 57% / reading 61% proficiency, ranked #13 of 73 in FL (top 18%) — acceptable for families but not a draw, mixed tenant base, ~2y average lease.
- Market conditions: 26 active listings in the ZIP; 16 comparable units currently listed for rent nearby; rentals at typical pace (median 22d on market — plan ~3-4 weeks tenant-placement turnaround); 1,979 units permitted in Seminole County in 2024 (1,191 in 5+ unit buildings).
- This rent runs 34% of the median local income ($48k/yr) — at the standard rent-burdened threshold; future hikes will face affordability resistance.
Forward outlook
- Local home prices are declining (-3.0%/yr); year-one equity from $664 of loan paydown is wiped out by about $3k of value loss. Plan a longer hold.
- Seminole County population projected at +24% by 2050 — long-run rental-demand tailwind backs the buy-and-hold thesis.
Negotiation context
- It's been on market 62 days — a 6% lower offer ($90k) is reasonable based on typical stale-listing flexibility.
- 2 sale attempts since 16y ago; this cycle's ask has dropped $9k (9%) from the opening price — seller is motivated, your offer sets the floor, not the list.
Risks & watch-outs
- Watch-outs: HOA is 29% of rent.
- Climate carrying-cost: severe wind risk, 99% chance of damaging wind over 30y; extreme-heat days projected 7→23/yr by 2055 (HVAC capex compounding) — expect insurance premiums to compound above CPI over the hold.
Questions for the listing agent
- It's been on market 62 days. Have you received any prior offers? Is the seller open to a 6% concession, seller financing, or rate buy-down credit?
- Built in 1969 — when were the roof, HVAC, electrical panel, plumbing, and water heater last replaced?
- What does the HOA fee cover, when was the last increase, and are there any pending special assessments or reserve-fund shortfalls?
- Any open or pending special assessments — roof, HVAC, plumbing, elevator, façade? What's the per-unit balance and payoff schedule, and is the seller paying it off at close or rolling it to the buyer?
- Why hasn't it sold? Are there any deal-killer items the seller is aware of (foundation, flood, title, zoning, code violations)?
- Is there a deadline driving the sale (1031 exchange, divorce, estate, relocation)? That informs how much negotiation room exists.
- Schools are B-rated — typically a magnet for longer-tenancy family renters. What's the average tenant stay here, and is there a school-zone premium baked into asking?
- What's the average days-on-market for RENTAL listings here right now (not sales)? A rising rental-DOM trend means longer vacancies and softer asking-rent achievability than the comps imply.
- What's the recent tenant-quality profile in this submarket — average credit score on applications, eviction rate, late-payment / NSF rate, and stable-employment percentage? A property-management company in the area should have these aggregated.
- How much new apartment / multifamily construction is in the pipeline within 1–3 miles? Heavy new supply (>2% of stock underway) typically softens rents 12–24 months out; light construction supports rent growth.
Investment metrics
- 1% rule
- 1.41% ✓
- Cap rate
- 6.64%
- Cash-on-cash
- 1.24%
- DSCR
- 1.06
- GRM
- 5.9
CMA / ARV
No comps found within radius.
Projected returns pro-forma
-3.0% appreciation · 3.0% rent growth · sell at horizon
- IRR
- -14.0%
- Equity multiple
- 0.50×
- Total profit
- $-13,526
- Equity at exit
- $14,312
- IRR
- -4.7%
- Equity multiple
- 0.69×
- Total profit
- $-8,463
- Equity at exit
- $8,299
Cash invested: $26,877 (down + closing). Projections, not guarantees.
Landlord ↔ Tenant lean methodology
- Overall (STATE)
- 87 Strongly Landlord-Friendly
- State Florida
- 87 Strongly Landlord-Friendly · R+3
- County
- — inherits STATE
- City
- — inherits STATE
ZIP-level market 32730
- Home prices YoY
- -22.4%
- Active inventory
- 26
- Price-to-rent
- 5.9×
Monthly cashflow live
- Estimated rent
- $1,355 high interval (Pro) →
- Mortgage (P&I)
- −$503
- Tax from tax record
- −$106 /mo · $1,278/yr
- Insurance
- −$40
- HOA
- −$393
- Vacancy / Maint / Mgmt
- −$285
- Net cashflow
- $28
Break-even live
UW: 25.0% down · 7.5% · 30yr · 1.5% tax · 5.0% vac · 8.0% maint · 8.0% mgmt
Financing live
Cash to close
- Down payment
- $23,998
- Closing costs
- $2,880
- Reserves months
- —
- Total cash needed
- —
Loan-product check · same deal, 3 products live
Conventional
25% down · 7.5% · 30yr
- Down + closing
- —
- Monthly P&I
- —
- Monthly cashflow
- —
- DSCR
- —
- Eligible?
- —
Personal DTI + credit; lowest rate.
DSCR
20% down · 8.5% · 30yr
- Down + closing
- —
- Monthly P&I
- —
- Monthly cashflow
- —
- DSCR
- —
- Eligible?
- —
No personal income docs; deal must DSCR.
Hard money
10% down · 12.0% · 12mo
- Down + closing
- —
- Monthly P&I
- —
- Monthly cashflow
- —
- DSCR
- —
- Eligible?
- —
Short-term bridge; refi at stabilization.
Rent comps 16 comps
| Address | Beds | Baths | Sqft | Rent | $/sqft | DOM | Units | Dist |
|---|---|---|---|---|---|---|---|---|
| 1000 Lake of the Woods Blvd Fern Park, FL | 2.0 | 1.0–2.0 | 945 | $1,525 | $1.61 | 24d | 2 | 0.04mi |
| 1000 Lake of the Woods Blvd Fern Park, FL | 1.0–2.0 | 1.0–2.0 | 886 | $1,100 | $1.24 | 5d | 3 | 0.04mi |
| 2174 Sharp Ct Fern Park, FL | 1.0–2.0 | 1.0 | 664 | $1,129 | $1.70 | 2d | 20 | 0.11mi |
| 2155 Fontebranda Loop Unit 150212 Casselberry, FL | 1.0 | 1.0 | 794 | $1,599 | $2.01 | 24d | 1 | 0.15mi |
| 2155 Fontebranda Loop Unit 180100 Casselberry, FL | 2.0 | 2.0 | 1020 | $1,799 | $1.76 | 24d | 1 | 0.15mi |
| 210 Welcome Way Fern Park, FL | 2.0 | 1.0–2.0 | 880 | $1,284 | $1.46 | 2d | 12 | 0.40mi |
| 229 Summerwood Trl Maitland, FL | 1.0 | 1.0 | 725 | $1,380 | $1.90 | 24d | 1 | 0.85mi |
| 400 Sandpiper Ln Casselberry, FL | 1.0–3.0 | 1.0–2.0 | 937 | $1,130 | $1.21 | 3d | 11 | 0.93mi |
| 202 Esplanade Way Unit Esplanade Way-202 Casselberry, FL | 1.0 | 1.0 | 722 | $1,200 | $1.66 | 24d | 1 | 1.06mi |
| 1166 Pointe Newport Ter Casselberry, FL | 1.0–3.0 | 1.0–2.0 | 961 | $1,400 | $1.46 | 5d | 16 | 1.20mi |
| 131 Lemon Ln Casselberry, FL | 2.0 | 1.0 | 572 | $1,550 | $2.71 | 18d | 1 | 1.21mi |
| 660 Jasmine Rd Casselberry, FL | 2.0 | 1.0 | 953 | $1,725 | $1.81 | 5d | 1 | 1.27mi |
| 117 Georgetown Dr Unit C Casselberry, FL | 2.0 | 2.0 | 1095 | $1,550 | $1.42 | 24d | 1 | 1.39mi |
| 828 Orienta Ave Altamonte Springs, FL | 1.0–2.0 | 1.0–2.0 | 845 | $1,182 | $1.40 | 22d | 30 | 1.40mi |
| 1157 Calle del Norte Unit B Casselberry, FL | 1.0 | 1.0 | 751 | $1,175 | $1.56 | 5d | 1 | 1.49mi |
| 1167 Calle del Rey Unit A Casselberry, FL | 1.0 | 1.0 | 781 | $1,250 | $1.60 | 24d | 1 | 1.50mi |
HOA detail condo
- Monthly dues
- $393 · $4,716/yr
- Assessments
- None detected in remarks — confirm with the listing agent.
Listing history 18 events
-
2026-06-18days on market $95,990 Active 62 DOM
-
2026-06-17days on market $95,990 Active 61 DOM
-
2026-06-16days on market $95,990 Active 60 DOM
-
2026-06-15days on market $95,990 Active 59 DOM
-
2026-06-13days on market $95,990 Active 57 DOM
-
2026-06-09days on market $95,990 Active 53 DOM
-
2026-06-08days on market $95,990 Active 52 DOM
-
2026-06-07days on market $95,990 Active 51 DOM
-
2026-06-04days on market $95,990 Active 48 DOM
-
2026-06-03days on market $95,990 Active 47 DOM
-
2026-06-02days on market $95,990 Active 46 DOM
-
2026-06-01days on market $95,990 Active 45 DOM
-
2026-05-31days on market $95,990 Active 44 DOM
-
2026-04-17$104,999 Active
-
2010-11-19historical
-
2010-01-11$19,900
-
2005-11-22soldstatus $96,000
-
2002-09-16soldstatus $31,000
ⓘ Source: listings_history table (triggers on properties + properties_extension) + one-shot
backfill from property_details.listing_events for pre-trigger history.
Tax reassessment forecast FL · Resets to sale price
- Current annual tax
- $1,278 · $106/mo
- Projected year-2 tax
- $1,278 · $106/mo
- Expected delta
- $0/yr ($0/mo · 0.0%)
ⓘ Screening estimate from a state-policy table — verify with the county assessor before closing.
Climate risk First Street
- Flood 1/10 Low FEMA zone X (unshaded) · 0% chance over 30 yrs
- Wildfire 1/10 Low
- Heat 9/10 Extreme 7 d/yr ≥108°F today · 23 d/yr by 30 yrs out
- Wind 9/10 Extreme 99% chance of damaging wind over 30 yrs
- Air quality 2/10 Low 1 unhealthy d/yr today · 2 by 30 yrs out
Nearby sold comps map
Loading sold comps map…
Walkable amenities ~0.75 mi
Loading nearby amenities…
Taxation est. · year 1
- Rental income
- $16,264
- − Mortgage interest
- −$5,377
- − Property taxes
- −$1,278
- − Insurance
- −$480
- − Repairs & maintenance
- −$1,301
- − Management
- −$1,301
- − HOA
- −$4,716
- − Depreciation
- −$2,792
- Taxable loss
- −$981
- Est. tax savings @ 24.0%
- +$236
- After-tax cash flow
- $570/yr
For passive investors: Depreciation is non-cash, so a rental often shows a tax loss while cash-flowing — sheltering income. Rental losses are passive: they offset passive income freely, and up to $25,000/yr can offset ordinary (W-2) income if you actively participate and your MAGI is under $100k (phasing out to $0 by $150k); unused losses carry forward. On sale, claimed depreciation is recaptured at up to 25%, and gains may owe capital-gains tax (a 1031 exchange can defer both). Figures are a year-1 estimate at your 24.0% rate — not tax advice; consult a CPA.
Schools (NCES district)
- District
- Seminole
- NCES district ID
- 1201710
- Math proficiency
- 57% ▼ -7.00%
- Reading proficiency
- 61% ▼ -1.00%
- Median HH income
- $58,478
- Composite
- 51.05/100
- National rank
- #1769
- State rank
- #13 of 73 in FL
Livability — Fern Park
- Score
- 77/100
- State rank
- #204
- US rank
- #3165
Category grades
Schools grade is shown separately in the Schools card above.
Census & demographics
- Census place
- Fern Park, FL
- County
- Seminole County · 436,154 people
- City population
- 6,158
- Metro
- Orlando-Kissimmee-Sanford, FL
- Population (ZIP)
- 6,091
- Household income
- $47,500
- Rent vs Own
- Severe rent burden
- 481.0
Population outlook (Seminole County) Hauer SSP2
- Today (2025)
- 515,494 people
- By 2030
- 545,713 · +5.9%
- By 2040
- 598,068 · +16.0%
- By 2050
- 640,663 · +24.3%
- By 2075
- 724,461 · +40.5%
- By 2100
- 755,530 · +46.6%
Race, ethnicity, and origin ACS 2023
- Neighborhood character
- Diverse neighborhood (Simpson 0.55)
- Race & ethnicity
- White 63% Hispanic / Latino 21% Black 11% Two or more races 10% Asian 4%
- Hispanic origin (detail)
- Mexican 2% Puerto Rican 4% Dominican 5%
- Common ancestry
- Romanian 3% Italian 3% American 2%
- Foreign-born
- 17% · Canada, Vietnam, Jamaica
- Languages at home
- 76% English-only · Spanish 15% Russian/Polish/Slavic 4% Other Asian/Pacific 2%
Political lean MEDSL · Seminole
- 2024 margin
- Toss-up / Even · D 47.6% · R 51.1% · Other 1.3%
- 2008→2024 swing
- -0.8pp no change · 2008: -2.8pp · 2024: -3.5pp
- All cycles
- 2024: R+3.5 2020: D+2.8 2016: R+1.6 2012: R+6.5 2008: R+2.8
Not yet ingested
- Civics
- —
Market trends
- HPI YoY
- ▼ -91.62%
- Current HPI
- 316.6766
- Rent YoY
- —
- Metro
- Orlando-Kissimmee-Sanford, FL
- State GDP YoY
- ▲ 3.28%
- F500 in state
- 36
Industry mix (Fortune 500 HQ in FL)
| Industry | F500 HQs | Revenue |
|---|---|---|
| Industrial Technology | 2 | $29B |
|
||
| Insurance | 2 | $17B |
|
||
| Retail | 1 | $60B |
|
||
| Technology Distribution | 1 | $58B |
|
||
| Homebuilding | 1 | $35B |
|
||
| Technology Manufacturing | 1 | $35B |
|
||
Price history
+238.7% since first listed5 events — show timeline
- 2026-04-17 Listed $104,999 Stellar MLS as Distributed by MLS Grid
- 2010-11-19 Listing Removed — Stellar MLS as Distributed by MLS Grid
- 2010-01-11 Listed $19,900 Stellar MLS as Distributed by MLS Grid
- 2005-11-22 Sold (Public Records) $96,000 Public Records
- 2002-09-16 Sold (Public Records) $31,000 Public Records
Property tax history
+12.8%/yrLatest (2025): $1,278 · +1.8% YoY. Source: county tax records.
Cash-flow waterfall
monthlySold comps — $/sqft
last 12 mo · ≤1 miLoading sold comps…