 Fourplex
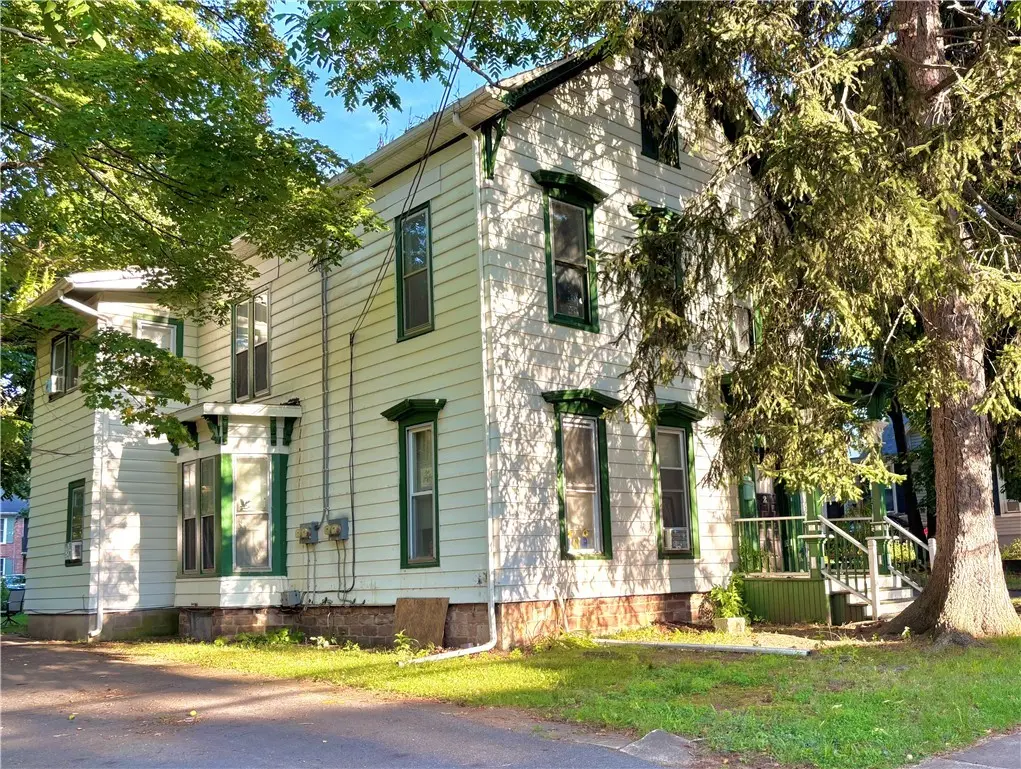
45 Chappell St · Brockport, NY
Flood risk No data
- FEMA flood zone
- —
- Chance of flooding over 30 yrs
- —
- Est. flood insurance / yr
- —
Fire risk No data
- Est. fire insurance / yr
- —
Heat risk No data
- Hot days now (above threshold)
- —
- Hot days in 30 yrs
- —
Wind risk No data
- Chance of severe wind over 30 yrs
- —
Air-quality risk No data
- Unhealthy air days now
- —
- Unhealthy air days in 30 yrs
- —
Risk factors via First Street. Map © Google.
Why this score? — see what drove the C+ grade
The composite is a weighted blend of 9 inputs, each scored 0–100. Each bar is that input's sub-score; the figure is the points it added to the 100-point composite (weight × sub-score).
- Cash flow +30.0/30.0
- 1% rule +10.0/10.0
- DSCR +10.0/10.0
- Schools +4.3/10.0
- Livability +3.7/5.0
- Rent growth +3.2/5.0
- Condition / age +2.5/5.0
- ARV discount +0.0/15.0
- Appreciation +0.0/10.0
$349,900
🖨 Deal sheet 📄 Offer letter ✓ Due diligence
Multi-family units
County records classify this as Multi-Family (2-4 Unit). Listing-text estimate: 4 units. confirmed
Listing remarks MLS
A Multi-Unit Gem with Vintage Charm in the Heart of Brockport Nestled just steps from the tranquil Erie Canal and the vibrant heart of historic Brockport, this distinguished Quadplex residence offers timeless vintage character with original trims, crown molding, and elegant architecture that create a truly unique exterior. The separate entrances and separate driveways for each half allow for flexibility amongst the residents. Inside, the property blends classic charm with modern updates. Several units have undergone thoughtful rehabilitation, including fresh paint, refinished floors, remodeled bathrooms, updated kitchens, and more, making it an appealing choice for investors or future owner occupants. Currently, three of the four units are leased, providing steady income from day one while leaving one unit available for personal use or additional rental potential. Tailored to the seasoned investor seeking immediate performance or the new landlord eager to offset living costs with rental revenue, this home offers real opportunity. With SUNY Brockport only a five minute walk or a one minute drive, the property benefits from strong demand from the college community. Just beyond campus, the Erie Canal and Main Street offer scenic trails, water recreation, cafés, shops, and the historic Strand Theater, adding to the long term appeal for renters and residents alike. The perfect balance of character and investment opportunity is waiting, don’t miss your chance to see it.
Key facts
- Vintage charm
- Separate driveways
- Updated kitchens
Tags
Neighborhood map
What this means for you Summary
Snapshot
- This is a 4 × 4-bed/4.0-bath units multifamily listed at $350k.
Deal economics
- At list price, monthly cash flow is $4k ($45k/yr) — positive. Per door: $941/mo.
- The deal already cash-flows at list — no discount required.
- Meets the 1% rule at list price ($8k rent vs $350k).
- Recommended offer: $308k (12.0% below list) — sets the bar for market timing.
- Cap rate 19.2% vs local median 5.1% in Brockport — top-decile yield for the area; either an underpriced asset or a hidden risk that comps aren't pricing in. Stress-test before assuming the spread holds.
Location & tenants
- Location reads 73/100 on livability (#313 in NY) — a middle-class / working-renter tenant base. Strengths: health & safety A+, cost of living A, housing A; Watch: employment D+, crime F, amenities F.
- Brockport Central School District (town): math 45% / reading 55% proficiency, ranked #369 of 590 in NY (top 62%) — acceptable for families but not a draw, mixed tenant base, ~2y average lease.
- Market conditions: Rents rising (+2.7%/yr); 79 active listings in the ZIP; solid renter incomes; 1,169 units permitted in Monroe County in 2024 (591 in 5+ unit buildings).
- At $8,448/mo this rent would consume 134% of the median local household income ($76k/yr) (locally 472% of renters already pay >50% of income on rent) — very limited rent-growth headroom before tenants either downsize or default.
Forward outlook
- Local home prices are declining (-3.0%/yr); year-one equity from $2k of loan paydown is wiped out by about $10k of value loss. Plan a longer hold.
- Monroe County population projected to shrink 6% by 2050 — rents likely to lag national; underwrite the cash flow, not the appreciation.
- At projected returns (-3.0% appreciation + 2.7% rent growth), your $98k cash investment doubles in ~3 years — after that, you're playing with house money.
Negotiation context
- It's been on market 291 days — a 12% lower offer ($308k) is reasonable based on typical stale-listing flexibility.
Risks & watch-outs
- Watch-outs: property tax is 3.2% of price; built in 1890 — expect roof / HVAC / electrical / plumbing capex.
Questions for the listing agent
- It's been on market 291 days. Have you received any prior offers? Is the seller open to a 12% concession, seller financing, or rate buy-down credit?
- Can we see the unit-by-unit rent roll, current vacancy, and any below-market leases? What's the average tenancy length?
- What capital expenditures (roof, boiler, parking lot, exteriors) have been made in the last 5 years, and what's planned in the next 2?
- Built in 1890 — when were the roof, HVAC, electrical panel, plumbing, and water heater last replaced?
- Property tax is high relative to price — has the assessment been appealed recently, and will the sale trigger a re-assessment?
- Why hasn't it sold? Are there any deal-killer items the seller is aware of (foundation, flood, title, zoning, code violations)?
- Is there a deadline driving the sale (1031 exchange, divorce, estate, relocation)? That informs how much negotiation room exists.
- Schools are A-rated — typically a magnet for longer-tenancy family renters. What's the average tenant stay here, and is there a school-zone premium baked into asking?
- Crime grade is F in this area — have there been break-ins, vandalism, or insurance claims at this property in the last 3 years? What carrier currently insures it and at what premium?
- What's the average days-on-market for RENTAL listings here right now (not sales)? A rising rental-DOM trend means longer vacancies and softer asking-rent achievability than the comps imply.
- What's the recent tenant-quality profile in this submarket — average credit score on applications, eviction rate, late-payment / NSF rate, and stable-employment percentage? A property-management company in the area should have these aggregated.
- How much new apartment / multifamily construction is in the pipeline within 1–3 miles? Heavy new supply (>2% of stock underway) typically softens rents 12–24 months out; light construction supports rent growth.
Investment metrics
- 1% rule
- 2.41% ✓
- Cap rate
- 19.20%
- Cash-on-cash
- 46.09%
- DSCR
- 3.05
- GRM
- 3.5
CMA / ARV
- ARV (median comp)
- $300,033
- List price
- $349,900
- Delta
- 16.62%
- Verdict
- OVERPRICED
- Comps
- 10 within 1.0 mi
Projected returns pro-forma
-3.0% appreciation · 2.72% rent growth · sell at horizon
- IRR
- 43.0%
- Equity multiple
- 2.85×
- Total profit
- $181,046
- Equity at exit
- $52,171
- IRR
- 49.0%
- Equity multiple
- 5.68×
- Total profit
- $458,352
- Equity at exit
- $30,253
Cash invested: $97,972 (down + closing). Projections, not guarantees.
Landlord ↔ Tenant lean methodology
- Overall (STATE)
- 15 Strongly Tenant-Friendly
- State New York
- 15 Strongly Tenant-Friendly · D+10
- County
- — inherits STATE
- City
- — inherits STATE
ZIP-level market 14420
- Home prices YoY
- -10.6%
- Rents YoY
- 2.7%
- Active inventory
- 79
- Price-to-rent
- 13.8×
Monthly cashflow live
- Estimated rent
- $8,448 medium interval (Pro) →
- Mortgage (P&I)
- −$1,835
- Tax from tax record
- −$930 /mo · $11,159/yr
- Insurance
- −$146
- HOA
- −$0
- Vacancy / Maint / Mgmt
- −$1,774
- Net cashflow
- $3,763
Break-even live
4-unit breakdown (identical units grouped — click to expand)
| Units | Beds | Baths | Est. rent |
|---|---|---|---|
| 4× units | 4 | 4 | $8,448 |
| #1 | 4 | 4 | $2,112 |
| #2 | 4 | 4 | $2,112 |
| #3 | 4 | 4 | $2,112 |
| #4 | 4 | 4 | $2,112 |
| Total (4 units) | $8,448 | ||
UW: 25.0% down · 7.5% · 30yr · 1.5% tax · 5.0% vac · 8.0% maint · 8.0% mgmt
Financing live
Cash to close
- Down payment
- $87,475
- Closing costs
- $10,497
- Reserves months
- —
- Total cash needed
- —
Loan-product check · same deal, 3 products live
Conventional
25% down · 7.5% · 30yr
- Down + closing
- —
- Monthly P&I
- —
- Monthly cashflow
- —
- DSCR
- —
- Eligible?
- —
Personal DTI + credit; lowest rate.
DSCR
20% down · 8.5% · 30yr
- Down + closing
- —
- Monthly P&I
- —
- Monthly cashflow
- —
- DSCR
- —
- Eligible?
- —
No personal income docs; deal must DSCR.
Hard money
10% down · 12.0% · 12mo
- Down + closing
- —
- Monthly P&I
- —
- Monthly cashflow
- —
- DSCR
- —
- Eligible?
- —
Short-term bridge; refi at stabilization.
Listing history 16 events
-
2026-06-18days on market $349,900 Active 291 DOM
-
2026-06-17days on market $349,900 Active 290 DOM
-
2026-06-16days on market $349,900 Active 289 DOM
-
2026-06-15days on market $349,900 Active 288 DOM
-
2026-06-13days on market $349,900 Active 286 DOM
-
2026-06-13days on market $349,900 Active 285 DOM
-
2026-06-10days on market $349,900 Active 283 DOM
-
2026-06-09days on market $349,900 Active 282 DOM
-
2026-06-08days on market $349,900 Active 281 DOM
-
2026-06-07days on market $349,900 Active 280 DOM
-
2026-06-03days on market $349,900 Active 276 DOM
-
2026-06-03days on market $349,900 Active 275 DOM
-
2026-06-01days on market $349,900 Active 274 DOM
-
2026-05-31days on market $349,900 Active 273 DOM
-
2025-08-31$349,900 Active 1504-char remark
Show marketing remark (1504 chars)
A Multi-Unit Gem with Vintage Charm in the Heart of Brockport Nestled just steps from the tranquil Erie Canal and the vibrant heart of historic Brockport, this distinguished Quadplex residence offers timeless vintage character with original trims, crown molding, and elegant architecture that create a truly unique exterior. The separate entrances and separate driveways for each half allow for flexibility amongst the residents. Inside, the property blends classic charm with modern updates. Several units have undergone thoughtful rehabilitation, including fresh paint, refinished floors, remodeled bathrooms, updated kitchens, and more, making it an appealing choice for investors or future owner occupants. Currently, three of the four units are leased, providing steady income from day one while leaving one unit available for personal use or additional rental potential. Tailored to the seasoned investor seeking immediate performance or the new landlord eager to offset living costs with rental revenue, this home offers real opportunity. With SUNY Brockport only a five minute walk or a one minute drive, the property benefits from strong demand from the college community. Just beyond campus, the Erie Canal and Main Street offer scenic trails, water recreation, cafés, shops, and the historic Strand Theater, adding to the long term appeal for renters and residents alike. The perfect balance of character and investment opportunity is waiting, don’t miss your chance to see it.
-
2019-03-19soldstatus $777,500
ⓘ Source: listings_history table (triggers on properties + properties_extension) + one-shot
backfill from property_details.listing_events for pre-trigger history.
Tax reassessment forecast NY · Partial reset (capped growth)
- Current annual tax
- $11,159 · $930/mo
- Projected year-2 tax
- $11,159 · $930/mo
- Expected delta
- $0/yr ($0/mo · 0.0%)
ⓘ Screening estimate from a state-policy table — verify with the county assessor before closing.
Nearby sold comps map
Loading sold comps map…
Walkable amenities ~0.75 mi
Loading nearby amenities…
Taxation est. · year 1
- Rental income
- $101,376
- − Mortgage interest
- −$19,600
- − Property taxes
- −$11,159
- − Insurance
- −$1,750
- − Repairs & maintenance
- −$8,110
- − Management
- −$8,110
- − Depreciation
- −$10,179
- Taxable income
- $42,469
- Est. tax owed @ 24.0%
- −$10,193
- After-tax cash flow
- $34,967/yr
For passive investors: Depreciation is non-cash, so a rental often shows a tax loss while cash-flowing — sheltering income. Rental losses are passive: they offset passive income freely, and up to $25,000/yr can offset ordinary (W-2) income if you actively participate and your MAGI is under $100k (phasing out to $0 by $150k); unused losses carry forward. On sale, claimed depreciation is recaptured at up to 25%, and gains may owe capital-gains tax (a 1031 exchange can defer both). Figures are a year-1 estimate at your 24.0% rate — not tax advice; consult a CPA.
Schools (NCES district)
- District
- Brockport Central School District
- NCES district ID
- 3605580
- Math proficiency
- 45% ▼ -14.00%
- Reading proficiency
- 55% ▲ 1.00%
- Median HH income
- $55,571
- Composite
- 43.28/100
- National rank
- #3044
- State rank
- #369 of 590 in NY
Livability — Brockport
- Score
- 73/100
- State rank
- #313
- US rank
- #5216
Category grades
Schools grade is shown separately in the Schools card above.
Census & demographics
- Census place
- Brockport, NY
- County
- Monroe County · 674,131 people
- City population
- 20,375
- Metro
- Rochester, NY
- Population (ZIP)
- 20,375
- Household income
- $75,577
- Rent vs Own
- Severe rent burden
- 472.0
Population outlook (Monroe County) Hauer SSP2
- Today (2025)
- 759,460 people
- By 2030
- 757,154 · -0.3%
- By 2040
- 740,644 · -2.5%
- By 2050
- 714,443 · -5.9%
- By 2075
- 645,883 · -15.0%
- By 2100
- 547,084 · -28.0%
Race, ethnicity, and origin ACS 2023
- Neighborhood character
- Predominantly White (81%)
- Race & ethnicity
- White 81% Hispanic / Latino 7% Black 5% Two or more races 5% Asian 2%
- Hispanic origin (detail)
- Puerto Rican 3%
- Common ancestry
- Romanian 5% Lithuanian 2% Italian 2%
- Foreign-born
- 5% · Canada, China, South Korea
- Languages at home
- 90% English-only · Spanish 5% Other Indo-European 1% French/Haitian/Cajun 1%
Political lean MEDSL · Monroe
- 2024 margin
- D (+19.1) · D 59.5% · R 40.5%
- 2008→2024 swing
- +1.4pp toward D · 2008: 17.7pp · 2024: 19.1pp
- All cycles
- 2024: D+19.1 2020: D+21.0 2016: D+14.1 2012: D+17.4 2008: D+17.7
Not yet ingested
- Civics
- —
Market trends
- HPI YoY
- ▼ -31.08%
- Current HPI
- 261.3695
- Rent YoY
- ▲ 2.72%
- Metro
- Rochester, NY
- State GDP YoY
- ▲ 2.60%
- F500 in state
- 92
Industry mix (Fortune 500 HQ in NY)
| Industry | F500 HQs | Revenue |
|---|---|---|
| Financial Services | 10 | $950B |
|
||
| Consumer Goods | 9 | $162B |
|
||
| Insurance | 4 | $225B |
|
||
| Telecommunications | 2 | $144B |
|
||
| Pharmaceuticals | 2 | $112B |
|
||
| Media / Entertainment | 2 | $69B |
|
||
Price history
-55.0% since first listed2 events — show timeline
- 2025-08-31 Listed $349,900 UNYREIS
- 2019-03-19 Sold (Public Records) $777,500 Public Records
Property tax history
+5.8%/yrLatest (2025): $11,159 · +6.6% YoY. Source: county tax records.
Cash-flow waterfall
monthlySold comps — $/sqft
last 12 mo · ≤1 miLoading sold comps…