337 Buckhorn Dr · Canyon Lake, TX
Flood risk 1/10 · Minimal
- FEMA flood zone
- X (unshaded)
- Chance of flooding over 30 yrs
- 0.0%
- Est. flood insurance / yr
- $507 – $1,088
Fire risk 4/10 · Minor
- Est. fire insurance / yr
- $1,222 – $2,270
Heat risk 7/10 · Major
- Hot days now (above 106°F)
- 7 days/yr
- Hot days in 30 yrs
- 21 days/yr
Wind risk 6/10 · Moderate
- Chance of severe wind over 30 yrs
- 77.0%
Air-quality risk 2/10 · Minimal
- Unhealthy air days now
- 0 days/yr
- Unhealthy air days in 30 yrs
- 1 days/yr
Risk factors via First Street. Map © Google.
Why this score? — see what drove the C+ grade
The composite is a weighted blend of 9 inputs, each scored 0–100. Each bar is that input's sub-score; the figure is the points it added to the 100-point composite (weight × sub-score).
- Cash flow +25.7/30.0
- ARV discount +10.1/15.0
- DSCR +8.6/10.0
- 1% rule +5.9/10.0
- Schools +5.2/10.0
- Livability +3.4/5.0
- Condition / age +2.5/5.0
- Rent growth +2.2/5.0
- Appreciation +0.0/10.0
$138,000
🖨 Deal sheet 📄 Offer letter ✓ Due diligence
Listing remarks
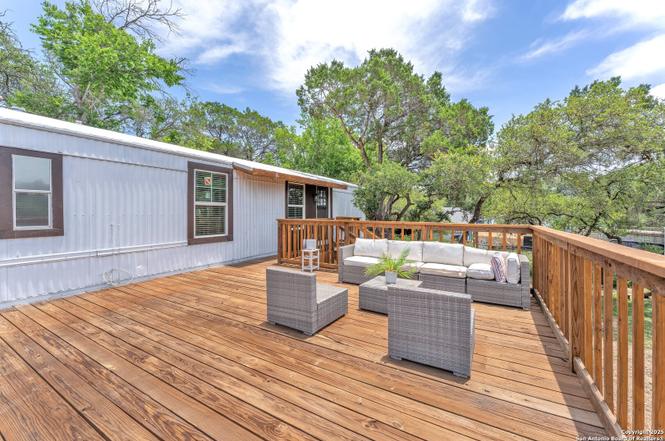
Welcome to 337 Buckhorn Drive - a charming and move-in-ready 2 bedroom, 1.5 bathroom manufactured home offering 868 sq ft of comfortable living space on a spacious 1/4-acre lot. This thoughtfully updated home features fresh paint, new flooring throughout, and a bright, white kitchen with ample cabinet space. The open floor plan concept provides a seamless flow between the living, dining, and kitchen areas-perfect for both daily living and entertaining. Additional appliances included are the washer, dryer, and refrigerator.
Key facts
- Bright kitchen
- Open floor plan
- Spacious lot
Tags
Neighborhood map
What this means for you Summary
Snapshot
- This is a 2-bed/1.5-bath manufactured listed at $138k.
Deal economics
- At list price, monthly cash flow is $330 ($4k/yr) — positive.
- The deal already cash-flows at list — no discount required.
- Meets the 1% rule at list price ($2k rent vs $138k).
- Recommended offer: $136k (1.5% below list) — sets the bar for market timing.
- Cap rate 9.2% vs local median 2.3% in Canyon Lake — top-decile yield for the area; either an underpriced asset or a hidden risk that comps aren't pricing in. Stress-test before assuming the spread holds.
Location & tenants
- Location reads 67/100 on livability (#534 in TX) — a middle-class / working-renter tenant base. Strengths: employment A+, housing A+, cost of living A; Watch: amenities F, commute F, health & safety F.
- Comal ISD (rural): math 57% / reading 59% proficiency, ranked #58 of 826 in TX (top 7%) — acceptable for families but not a draw, mixed tenant base, ~2y average lease.
- Zoned schools: Startzville El (math 42% / reading 52%, grade D-, #1,006 of 4,322 statewide, top 25%, 465 students, 68% FRL); Canyon Lake H S (math 46% / reading 56%, grade D+, #482 of 1,632 statewide, top 30%, 1,038 students, 37% FRL) — zoned schools average 53% FRL vs 31% district-wide (22 pts higher); higher-poverty schools than district average — tighter screening recommended.
- Market conditions: Rents soft (-1.2%/yr); 1014 active listings in the ZIP; 4 comparable units currently listed for rent nearby; rentals lingering (median 44d on market — plan ~5-8 weeks vacancy on turnover, expect pricing pressure); 75% of comp listings sitting > 30 days — soft ceiling on asking rent; solid renter incomes; 3,420 units permitted in Comal County in 2024 (1,164 in 5+ unit buildings).
Forward outlook
- Local home prices are declining (-3.0%/yr); year-one equity from $954 of loan paydown is wiped out by about $4k of value loss. Plan a longer hold.
- Comal County population projected at +70% by 2050 — long-run rental-demand tailwind backs the buy-and-hold thesis.
Negotiation context
- It's been on market 23 days — a 2% lower offer ($136k) is reasonable based on typical stale-listing flexibility.
- 4 sale attempts with the ask held roughly flat each time — persistent listings suggest the price (not the market) is what's stuck; bring a comps-based counter.
Risks & watch-outs
- Climate carrying-cost: major wind risk, 77% chance of damaging wind over 30y; extreme-heat days projected 7→21/yr by 2055 (HVAC capex compounding) — expect insurance premiums to compound above CPI over the hold.
Questions for the listing agent
- What does the HOA fee cover, when was the last increase, and are there any pending special assessments or reserve-fund shortfalls?
- Is there a deadline driving the sale (1031 exchange, divorce, estate, relocation)? That informs how much negotiation room exists.
- What's the average days-on-market for RENTAL listings here right now (not sales)? A rising rental-DOM trend means longer vacancies and softer asking-rent achievability than the comps imply.
- What's the recent tenant-quality profile in this submarket — average credit score on applications, eviction rate, late-payment / NSF rate, and stable-employment percentage? A property-management company in the area should have these aggregated.
- How much new for-sale + rental construction is in the pipeline within 1–3 miles? Heavy new supply typically softens prices + rents 12–24 months out; constrained supply supports both.
Investment metrics
- 1% rule
- 1.09% ✓
- Cap rate
- 9.16%
- Cash-on-cash
- 10.25%
- DSCR
- 1.46
- GRM
- 7.6
CMA / ARV
- ARV (on-the-fly)
- $146,320
- Comps found
- 3
Show comp detail 3 sales within ~0.75 mi
| Address | Dist | Beds/Ba | Sqft | Sold | Price | $/sf | Match |
|---|---|---|---|---|---|---|---|
| 474 & 466 Forest Hill St | 0.34mi | 2/2.0 | 896 (-5%) | 11mo | $190,000 | $212 | 64 |
| 250 Deer Vly | 0.13mi | 3/2.0 (+1) | 902 (-4%) | 18mo | $140,000 | $155 | 64 |
| 706 Flintstone Dr | 0.16mi | 3/2.0 (+1) | 1,064 (+13%) | 16mo | $60,000 | $56 | 51 |
Match score weights: distance 35% · size 25% · config 20% · recency 20%. Top-matched comps best support the ARV.
Projected returns pro-forma
-3.0% appreciation · 0.0% rent growth · sell at horizon
- IRR
- -4.1%
- Equity multiple
- 0.85×
- Total profit
- $-5,798
- Equity at exit
- $20,576
- IRR
- 2.0%
- Equity multiple
- 1.12×
- Total profit
- $4,799
- Equity at exit
- $11,932
Cash invested: $38,640 (down + closing). Projections, not guarantees.
Landlord ↔ Tenant lean methodology
- Overall (STATE)
- 87 Strongly Landlord-Friendly
- State Texas
- 87 Strongly Landlord-Friendly · R+5
- County
- — inherits STATE
- City
- — inherits STATE
ZIP-level market 78133
- Home prices YoY
- -33.8%
- Rents YoY
- -1.2%
- Active inventory
- 1014
- Price-to-rent
- 7.6×
Monthly cashflow live
- Estimated rent
- $1,508 medium interval (Pro) →
- Mortgage (P&I)
- −$724
- Tax from tax record
- −$78 /mo · $934/yr
- Insurance
- −$58
- HOA
- −$2
- Vacancy / Maint / Mgmt
- −$317
- Net cashflow
- $330
Break-even live
UW: 25.0% down · 7.5% · 30yr · 1.5% tax · 5.0% vac · 8.0% maint · 8.0% mgmt
Financing live
Cash to close
- Down payment
- $34,500
- Closing costs
- $4,140
- Reserves months
- —
- Total cash needed
- —
Loan-product check · same deal, 3 products live
Conventional
25% down · 7.5% · 30yr
- Down + closing
- —
- Monthly P&I
- —
- Monthly cashflow
- —
- DSCR
- —
- Eligible?
- —
Personal DTI + credit; lowest rate.
DSCR
20% down · 8.5% · 30yr
- Down + closing
- —
- Monthly P&I
- —
- Monthly cashflow
- —
- DSCR
- —
- Eligible?
- —
No personal income docs; deal must DSCR.
Hard money
10% down · 12.0% · 12mo
- Down + closing
- —
- Monthly P&I
- —
- Monthly cashflow
- —
- DSCR
- —
- Eligible?
- —
Short-term bridge; refi at stabilization.
Rent comps 4 comps
| Address | Beds | Baths | Sqft | Rent | $/sqft | DOM | Units | Dist |
|---|---|---|---|---|---|---|---|---|
| 127 Quail Run St Canyon Lake, TX | 3.0 | 2.0 | 940 | $1,400 | $1.49 | 43d | 1 | 0.24mi |
| 270 Ridgerock Dr Canyon Lake, TX | 3.0 | 2.0 | 900 | $1,600 | $1.78 | 43d | 1 | 0.51mi |
| 324 Ridgerock Dr Unit 1 Canyon Lake, TX | 2.0 | 2.0 | 1050 | $1,450 | $1.38 | 23d | 1 | 0.55mi |
| 668 Creekside Dr Canyon Lake, TX | 2.0 | 2.0 | 980 | $1,225 | $1.25 | 43d | 1 | 1.02mi |
HOA detail
- Monthly dues
- $2 · $24/yr
Listing history 13 events
-
2026-04-26historical $1,200
-
2026-03-28status Pending
-
2026-03-14historical Active Option
-
2026-03-04$138,000 New
-
2026-03-02$1,200
-
2026-03-01historical
-
2025-12-01status Back on Market
-
2025-11-25historical Active Option
-
2025-11-20price $138,000
-
2025-07-05price $151,900
-
2025-06-08$155,000 New
-
2013-10-28soldstatus
-
1980-07-08soldstatus
ⓘ Source: listings_history table (triggers on properties + properties_extension) + one-shot
backfill from property_details.listing_events for pre-trigger history.
Tax reassessment forecast TX · Resets to sale price
- Current annual tax
- $934 · $78/mo
- Projected year-2 tax
- $2,525 · $210/mo
- Expected delta
- +$1,591/yr (+$133/mo · 170.4%)
ⓘ Screening estimate from a state-policy table — verify with the county assessor before closing.
Climate risk First Street
- Flood 1/10 Low FEMA zone X (unshaded) · 0% chance over 30 yrs
- Wildfire 4/10 Moderate
- Heat 7/10 Severe 7 d/yr ≥106°F today · 21 d/yr by 30 yrs out
- Wind 6/10 Major 77% chance of damaging wind over 30 yrs
- Air quality 2/10 Low 0 unhealthy d/yr today · 1 by 30 yrs out
Nearby sold comps map
Loading sold comps map…
Walkable amenities ~0.75 mi
Loading nearby amenities…
Taxation est. · year 1
- Rental income
- $18,091
- − Mortgage interest
- −$7,730
- − Property taxes
- −$934
- − Insurance
- −$690
- − Repairs & maintenance
- −$1,447
- − Management
- −$1,447
- − HOA
- −$24
- − Depreciation
- −$4,015
- Taxable income
- $1,804
- Est. tax owed @ 24.0%
- −$433
- After-tax cash flow
- $3,527/yr
For passive investors: Depreciation is non-cash, so a rental often shows a tax loss while cash-flowing — sheltering income. Rental losses are passive: they offset passive income freely, and up to $25,000/yr can offset ordinary (W-2) income if you actively participate and your MAGI is under $100k (phasing out to $0 by $150k); unused losses carry forward. On sale, claimed depreciation is recaptured at up to 25%, and gains may owe capital-gains tax (a 1031 exchange can defer both). Figures are a year-1 estimate at your 24.0% rate — not tax advice; consult a CPA.
Schools (NCES district)
- District
- Comal ISD
- NCES district ID
- 4814730
- Math proficiency
- 57% ▼ -9.00%
- Reading proficiency
- 59% ▼ -2.00%
- Median HH income
- $74,792
- Composite
- 51.79/100
- National rank
- #1671
- State rank
- #58 of 826 in TX
Livability — Canyon Lake
- Score
- 67/100
- State rank
- #534
- US rank
- #10441
Category grades
Schools grade is shown separately in the Schools card above.
Census & demographics
- Census place
- Canyon Lake, TX
- County
- Comal County · 206,262 people
- City population
- 42,159
- Metro
- San Antonio-New Braunfels, TX
- Population (ZIP)
- 21,959
- Household income
- $83,853
- Rent vs Own
- Severe rent burden
- 402.0
Population outlook (Comal County) Hauer SSP2
- Today (2025)
- 175,637 people
- By 2030
- 199,911 · +13.8%
- By 2040
- 249,436 · +42.0%
- By 2050
- 299,430 · +70.5%
- By 2075
- 423,857 · +141.3%
- By 2100
- 512,048 · +191.5%
Race, ethnicity, and origin ACS 2023
- Neighborhood character
- Predominantly White (74%)
- Race & ethnicity
- White 74% Hispanic / Latino 20% Two or more races 10% Black 2%
- Hispanic origin (detail)
- Mexican 15%
- Common ancestry
- Lithuanian 3% Romanian 3% Italian 3%
- Foreign-born
- 4% · Canada
- Languages at home
- 91% English-only · Spanish 7%
Political lean MEDSL · Comal
- 2024 margin
- Solid R (+45.5) · D 26.8% · R 72.2%
- 2008→2024 swing
- +1.9pp toward D · 2008: -47.4pp · 2024: -45.5pp
- All cycles
- 2024: R+45.5 2020: R+42.7 2016: R+50.1 2012: R+54.1 2008: R+47.4
Not yet ingested
- Civics
- —
Market trends
- HPI YoY
- ▼ -111.36%
- Current HPI
- 218.4633
- Rent YoY
- ▼ -1.20%
- Metro
- San Antonio-New Braunfels, TX
- State GDP YoY
- ▲ 3.95%
- F500 in state
- 110
Industry mix (Fortune 500 HQ in TX)
| Industry | F500 HQs | Revenue |
|---|---|---|
| Energy | 16 | $1,198B |
|
||
| Technology | 5 | $198B |
|
||
| Engineering / Construction | 4 | $72B |
|
||
| Energy Services | 3 | $60B |
|
||
| Utilities | 3 | $41B |
|
||
| Healthcare | 2 | $330B |
|
||
Price history
-99.2% since first listed13 events — show timeline
- 2026-04-26 Rental Removed $1,200 SABOR
- 2026-03-28 Pending — LERA
- 2026-03-14 Contingent — LERA
- 2026-03-04 Listed $138,000 LERA
- 2026-03-02 Listed for Rent $1,200 SABOR
- 2026-03-01 Listing Removed — LERA
- 2025-12-01 Relisted — LERA
- 2025-11-25 Contingent — LERA
- 2025-11-20 Price Changed $138,000 LERA
- 2025-07-05 Price Changed $151,900 LERA
- 2025-06-08 Listed $155,000 LERA
- 2013-10-28 Sold (Public Records) — Public Records
- 1980-07-08 Sold (Public Records) — Public Records
Property tax history
+14.9%/yrLatest (2026): $934 · -0.5% YoY. Source: county tax records.
Cash-flow waterfall
monthlySold comps — $/sqft
last 12 mo · ≤1 miLoading sold comps…