1759 Beverly Dr · Winding Cypress, FL
Flood risk 9/10 · Severe
- FEMA flood zone
- AE
- Chance of flooding over 30 yrs
- 0.99%
- Est. flood insurance / yr
- $1,737 – $8,500
Fire risk 5/10 · Moderate
- Est. fire insurance / yr
- $947 – $1,759
Heat risk 9/10 · Severe
- Hot days now (above 108°F)
- 4 days/yr
- Hot days in 30 yrs
- 17 days/yr
Wind risk 10/10 · Severe
- Chance of severe wind over 30 yrs
- 99.0%
Air-quality risk 3/10 · Minor
- Unhealthy air days now
- 3 days/yr
- Unhealthy air days in 30 yrs
- 3 days/yr
Risk factors via First Street. Map © Google.
Why this score? — see what drove the B grade
The composite is a weighted blend of 9 inputs, each scored 0–100. Each bar is that input's sub-score; the figure is the points it added to the 100-point composite (weight × sub-score).
- Cash flow +30.0/30.0
- DSCR +10.0/10.0
- 1% rule +8.2/10.0
- ARV discount +7.5/15.0
- Schools +5.0/10.0
- Appreciation +4.3/10.0
- Rent growth +3.3/5.0
- Livability +2.5/5.0
- Condition / age +2.5/5.0
$245,000
🖨 Deal sheet 📄 Offer letter ✓ Due diligence
Listing remarks
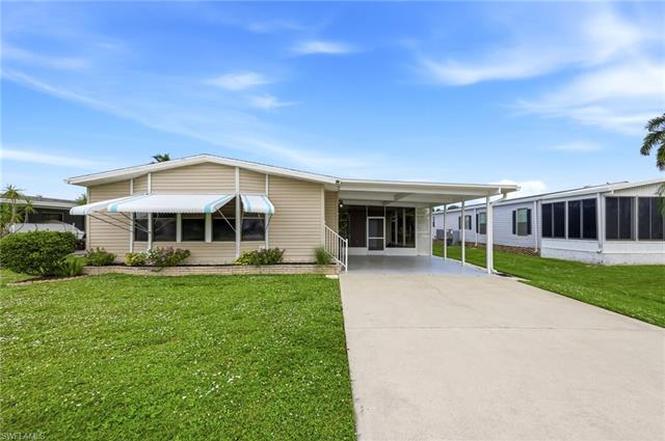
This 2-bedroom, 2-bath home in Riverwood, a desirable 55+ community, sits on land you actually own, with one of the lowest carrying costs you'll find in Naples at just $259 a year. The open layout works whether you're hosting a dinner or just letting the weekend slow down, and the updated kitchen with granite countertops and stainless steel appliances makes it easy to do both. The screened lanai is where your mornings will go. Both bedrooms have walk-in closets, and the storage and workshop out back give everything else a place to land. The big ticket items are already done with a brand new AC, water heater, washer, dryer, and refrigerator, all replaced in 2025 or 2026. This home qualifies
Key facts
- Storage and workshop
- Screened lanai
- Walk-in closets
Tags
Property features AI
Finance
- Other: Property is a single-unit home (1 unit in building/complex, 1 floor); Lot is approximately 0.14 acres (regular lot); Boat access nearby with boat canopy/cover and boat ramp
- HOA & community: Mandatory HOA; Annual HOA fee of $259; Professional management; HOA covers street lights and street maintenance; Community amenities include BBQ/picnic area, community boat ramp, community gulf boat access, community pool, fishing pier, private membership, streetlights, and underground utilities; Community type: boating, mobile/manufactured, non-gated
Exterior
- Parking: Carport attached with space for 2 cars; 2+ parking spaces
- Security: Street lighting (community maintenance)
- Utilities: Central water; Central sewer; Cable available; Electric service for heating and cooling (central electric)
- Home design: Manufactured home; 1 story / ranch; Rear exposure facing west; Residential property in the Riverwood community
- Construction: Manufactured construction; Built in 1989; Vinyl siding exterior; Shingle roof
- Exterior features: Decorative shutters; Storage; Manual storm shutters; Single hung windows; Shingle roof; Vinyl siding
Interior
- Kitchen: Dishwasher; Disposal; Microwave; Range; Refrigerator/Freezer; Pantry; Eat-in kitchen
- Bedrooms: 2 bedrooms
- Flooring: Carpet; Tile
- Bathrooms: 2 full bathrooms; Master bathroom with shower (no tub)
- Heating & cooling: Central electric heat; Central electric air conditioning
- Interior features: Built-in cabinets; Cable prewire; High-speed internet available; Pantry; Vaulted ceiling; Walk-in closet; Window coverings; Partially furnished; Laundry in residence; Screened lanai/porch; Dining area (family and living) and eat-in kitchen
- Laundry & utility: Washer; Dryer; Laundry located inside the residence
Neighborhood map
What this means for you Summary
Snapshot
- This is a 2-bed/2.0-bath manufactured listed at $245k.
Deal economics
- At list price, monthly cash flow is $559 ($7k/yr) — positive.
- The deal already cash-flows at list — no discount required.
- Meets the 1% rule at list price ($3k rent vs $245k).
Location & tenants
- Location reads: area grade B — affects rentability + tenant quality, not the cash-flow math above.
- Collier (suburban): math 60% / reading 56% proficiency, ranked #16 of 73 in FL (top 22%) — acceptable for families but not a draw, mixed tenant base, ~2y average lease.
- Market conditions: Rents rising (+3.2%/yr); 900 active listings in the ZIP; 37 comparable units currently listed for rent nearby; rentals at typical pace (median 24d on market — plan ~3-4 weeks tenant-placement turnaround); solid renter incomes; 3,520 units permitted in Collier County in 2024 (959 in 5+ unit buildings).
- This rent runs 43% of the median local income ($89k/yr) — at the standard rent-burdened threshold; future hikes will face affordability resistance.
Forward outlook
- Local home prices are declining (-1.5%/yr); year-one equity from $2k of loan paydown is wiped out by about $4k of value loss. Plan a longer hold.
- Collier County population projected at +30% by 2050 — long-run rental-demand tailwind backs the buy-and-hold thesis.
- At projected returns (-1.5% appreciation + 3.2% rent growth), your $69k cash investment doubles in ~9 years — after that, you're playing with house money.
Negotiation context
- Only 3 days on market — expect competitive offers; lowballing is unlikely to land.
- 3 sale attempts since 2y ago with the ask held roughly flat each time — persistent listings suggest the price (not the market) is what's stuck; bring a comps-based counter.
- Current owner paid $175k; 40% above their basis — modest negotiation headroom, anchor on the comps not their cost.
Risks & watch-outs
- Watch-outs: flood insurance adds $427/mo.
- Climate carrying-cost: in FEMA flood zone AE (mandatory federal flood insurance); severe wind risk, 99% chance of damaging wind over 30y; moderate wildfire risk; extreme-heat days projected 4→17/yr by 2055 (HVAC capex compounding) — expect insurance premiums to compound above CPI over the hold.
Questions for the listing agent
- What's the actual annual flood-insurance premium (NFIP or private), and is the property in a SFHA with mandatory coverage?
- What does the HOA fee cover, when was the last increase, and are there any pending special assessments or reserve-fund shortfalls?
- Is there a deadline driving the sale (1031 exchange, divorce, estate, relocation)? That informs how much negotiation room exists.
- What's the average days-on-market for RENTAL listings here right now (not sales)? A rising rental-DOM trend means longer vacancies and softer asking-rent achievability than the comps imply.
- What's the recent tenant-quality profile in this submarket — average credit score on applications, eviction rate, late-payment / NSF rate, and stable-employment percentage? A property-management company in the area should have these aggregated.
- How much new for-sale + rental construction is in the pipeline within 1–3 miles? Heavy new supply typically softens prices + rents 12–24 months out; constrained supply supports both.
Investment metrics
- 1% rule
- 1.32% ✓
- Cap rate
- 11.12%
- Cash-on-cash
- 17.24%
- DSCR
- 1.77
- GRM
- 6.3
CMA / ARV
No comps found within radius.
Projected returns pro-forma
-1.48% appreciation · 3.21% rent growth · sell at horizon
- IRR
- 4.3%
- Equity multiple
- 1.19×
- Total profit
- $12,794
- Equity at exit
- $53,536
- IRR
- 11.7%
- Equity multiple
- 2.10×
- Total profit
- $75,376
- Equity at exit
- $51,570
Cash invested: $68,600 (down + closing). Projections, not guarantees.
Landlord ↔ Tenant lean methodology
- Overall (STATE)
- 87 Strongly Landlord-Friendly
- State Florida
- 87 Strongly Landlord-Friendly · R+3
- County
- — inherits STATE
- City
- — inherits STATE
ZIP-level market 34114
- Home prices YoY
- -0.6%
- Rents YoY
- 3.2%
- Active inventory
- 900
- Price-to-rent
- 6.3×
Monthly cashflow live
- Estimated rent
- $3,227 high interval (Pro) →
- Mortgage (P&I)
- −$1,285
- Tax from tax record
- −$155 /mo · $1,863/yr
- Insurance
- −$102
- Flood insurance flood zone
- −$427 /mo · $5,118/yr
- HOA
- −$22
- Vacancy / Maint / Mgmt
- −$678
- Net cashflow
- $559
Break-even live
UW: 25.0% down · 7.5% · 30yr · 1.5% tax · 5.0% vac · 8.0% maint · 8.0% mgmt
Financing live
Cash to close
- Down payment
- $61,250
- Closing costs
- $7,350
- Reserves months
- —
- Total cash needed
- —
Loan-product check · same deal, 3 products live
Conventional
25% down · 7.5% · 30yr
- Down + closing
- —
- Monthly P&I
- —
- Monthly cashflow
- —
- DSCR
- —
- Eligible?
- —
Personal DTI + credit; lowest rate.
DSCR
20% down · 8.5% · 30yr
- Down + closing
- —
- Monthly P&I
- —
- Monthly cashflow
- —
- DSCR
- —
- Eligible?
- —
No personal income docs; deal must DSCR.
Hard money
10% down · 12.0% · 12mo
- Down + closing
- —
- Monthly P&I
- —
- Monthly cashflow
- —
- DSCR
- —
- Eligible?
- —
Short-term bridge; refi at stabilization.
Rent comps 37 comps
| Address | Beds | Baths | Sqft | Rent | $/sqft | DOM | Units | Dist |
|---|---|---|---|---|---|---|---|---|
| 1747 Beverly Dr Naples, FL | 2.0 | 2.0 | 1080 | $2,300 | $2.13 | 23d | 1 | 0.06mi |
| 274 Riverwood Rd Unit 1546056P Naples, FL | 2.0 | 2.0 | 1496 | $4,451 | $2.98 | 13d | 1 | 0.11mi |
| 1171 Tranquil Brook Dr Naples, FL | 2.0 | 2.0 | 1503 | $4,500 | $2.99 | 13d | 1 | 0.13mi |
| 1276 Enbrook Loop Naples, FL | 2.0 | 2.0 | 1503 | $5,000 | $3.33 | 23d | 1 | 0.19mi |
| 1022 Manatee Rd Unit D107 Naples, FL | 2.0 | 2.0 | 1000 | $2,000 | $2.00 | 23d | 1 | 0.20mi |
| 1010 Manatee Rd Unit B304 Naples, FL | 2.0 | 2.0 | 1000 | $1,800 | $1.80 | 23d | 1 | 0.23mi |
| 158 Rookery Rd Naples, FL | 3.0 | 2.0 | 1456 | $2,450 | $1.68 | 23d | 1 | 0.25mi |
| 1014 Manatee Rd Unit F307 Naples, FL | 2.0 | 2.0 | 900 | $1,800 | $2.00 | 23d | 1 | 0.26mi |
| 1000 Manatee Rd Unit A201 Naples, FL | 2.0 | 2.0 | 1000 | $1,695 | $1.70 | 23d | 1 | 0.26mi |
| 1212 Enbrook Loop Naples, FL | 2.0 | 2.0 | 1496 | $2,850 | $1.91 | 23d | 1 | 0.27mi |
| 1078 Rolling Brook Ln Naples, FL | 2.0 | 2.0 | 1503 | $2,750 | $1.83 | 21d | 1 | 0.28mi |
| 2000 Rookery Bay Dr Naples, FL | 1.0–3.0 | 1.0–2.0 | 929 | $1,772 | $1.91 | 23d | 9 | 0.31mi |
| 1157 Enbrook Loop Naples, FL | 2.0 | 2.0 | 1503 | $3,000 | $2.00 | 23d | 1 | 0.35mi |
| 842 Enbrook Loop Naples, FL | 2.0 | 2.0 | 1503 | $2,800 | $1.86 | 23d | 1 | 0.38mi |
| 847 Enbrook Loop Naples, FL | 2.0 | 2.0 | 1503 | $2,950 | $1.96 | 23d | 1 | 0.41mi |
| 6750 Beach Resort Dr #7 Naples, FL | 2.0 | 2.0 | 1351 | $3,900 | $2.89 | 23d | 1 | 0.83mi |
| 6750 Beach Resort Dr Naples, FL | 2.0 | 2.0 | 1351 | $3,200 | $2.37 | 13d | 2 | 0.83mi |
| 6680 Beach Resort Dr Unit 1214 Naples, FL | 2.0 | 2.0 | 1351 | $4,500 | $3.33 | 13d | 1 | 0.86mi |
| 2235 Yellowfin Cir Naples, FL | 2.0 | 2.0 | 1500 | $2,795 | $1.86 | 23d | 1 | 0.92mi |
| 6650 Beach Resort Dr Unit 908 Naples, FL | 2.0 | 2.0 | 1351 | $4,600 | $3.40 | 13d | 1 | 0.94mi |
| 2244 Yellowfin Cir Naples, FL | 3.0 | 2.0 | 1655 | $3,300 | $1.99 | 13d | 1 | 0.95mi |
| 22 Cypress View Dr Unit B22 Naples, FL | 2.0 | 2.0 | 1534 | $7,000 | $4.56 | 23d | 1 | 0.99mi |
| 6590 Beach Resort Dr Unit 305 Naples, FL | 2.0 | 2.0 | 1351 | $4,500 | $3.33 | 13d | 1 | 1.07mi |
| 1414 Oceania Dr S Naples, FL | 3.0 | 2.0 | 1572 | $5,000 | $3.18 | 23d | 1 | 1.16mi |
| 4685 Hawks Nest Way #103 Naples, FL | 2.0 | 2.0 | 1440 | $6,500 | $4.51 | 13d | 1 | 1.18mi |
| 4680 Hawks Nest Way Unit D-103 Naples, FL | 2.0 | 2.0 | 1414 | $3,000 | $2.12 | 13d | 1 | 1.22mi |
| 4529 Cardinal Cove Ln #7 Naples, FL | 2.0 | 2.0 | 1539 | $6,500 | $4.22 | 23d | 1 | 1.22mi |
| 1367 Artesia Dr E #302 Naples, FL | 2.0 | 2.5 | 1583 | $2,800 | $1.77 | 23d | 1 | 1.25mi |
| 3955 Deer Crossing Ct #103 Naples, FL | 3.0 | 2.0 | 1812 | $7,500 | $4.14 | 23d | 1 | 1.26mi |
| 4650 Hawks Nest Way Unit M202 Naples, FL | 3.0 | 2.0 | 1840 | $9,600 | $5.22 | 13d | 1 | 1.30mi |
| 7052 Live Oak Dr Naples, FL | 2.0 | 2.0 | 1685 | $9,000 | $5.34 | 23d | 1 | 1.32mi |
| 9175 Celeste Dr Unit 105 Naples, FL | 2.0 | 2.0 | 1000 | $2,000 | $2.00 | 23d | 1 | 1.41mi |
| 9187 Celeste Dr Unit 1073494P Naples, FL | 2.0 | 2.0 | 1399 | $2,979 | $2.13 | 13d | 1 | 1.42mi |
| 9165 Celeste Dr Unit 3-303 Naples, FL | 2.0 | 2.0 | 1000 | $6,500 | $6.50 | 23d | 1 | 1.47mi |
| 1423 Santiago Cir #1702 Naples, FL | 2.0 | 2.5 | 1583 | $6,500 | $4.11 | 23d | 1 | 1.48mi |
| 9159 Delano St #9905 Naples, FL | 3.0 | 2.0 | 1770 | $4,995 | $2.82 | 23d | 1 | 1.49mi |
| 9155 Delano St Unit 1545913P Naples, FL | 3.0 | 2.0 | 1797 | $3,871 | $2.15 | 13d | 1 | 1.50mi |
HOA detail
- Monthly dues
- $22 · $264/yr
- Likely covers
- water
Listing history 4 events
-
2026-06-18days on market $245,000 Active 3 DOM
-
2026-06-17days on market $245,000 Active 2 DOM
-
2026-06-15remarks 699-char remark
-
2026-06-15$245,000 Active 1 DOM
ⓘ Source: listings_history table (triggers on properties + properties_extension) + one-shot
backfill from property_details.listing_events for pre-trigger history.
Tax reassessment forecast FL · Resets to sale price
- Current annual tax
- $1,863 · $155/mo
- Projected year-2 tax
- $2,034 · $169/mo
- Expected delta
- +$170/yr (+$14/mo · 9.1%)
ⓘ Screening estimate from a state-policy table — verify with the county assessor before closing.
Climate risk First Street
- Flood 9/10 Extreme FEMA zone AE · 99% chance over 30 yrs
- Wildfire 5/10 Major
- Heat 9/10 Extreme 4 d/yr ≥108°F today · 17 d/yr by 30 yrs out
- Wind 10/10 Extreme 99% chance of damaging wind over 30 yrs
- Air quality 3/10 Moderate 3 unhealthy d/yr today · 3 by 30 yrs out
Nearby sold comps map
Loading sold comps map…
Walkable amenities ~0.75 mi
Loading nearby amenities…
Taxation est. · year 1
- Rental income
- $38,727
- − Mortgage interest
- −$13,724
- − Property taxes
- −$1,863
- − Insurance
- −$6,344
- − Repairs & maintenance
- −$3,098
- − Management
- −$3,098
- − HOA
- −$264
- − Depreciation
- −$7,127
- Taxable income
- $3,209
- Est. tax owed @ 24.0%
- −$770
- After-tax cash flow
- $5,936/yr
For passive investors: Depreciation is non-cash, so a rental often shows a tax loss while cash-flowing — sheltering income. Rental losses are passive: they offset passive income freely, and up to $25,000/yr can offset ordinary (W-2) income if you actively participate and your MAGI is under $100k (phasing out to $0 by $150k); unused losses carry forward. On sale, claimed depreciation is recaptured at up to 25%, and gains may owe capital-gains tax (a 1031 exchange can defer both). Figures are a year-1 estimate at your 24.0% rate — not tax advice; consult a CPA.
Schools (NCES district)
- District
- Collier
- NCES district ID
- 1200330
- Math proficiency
- 60% ▼ -4.00%
- Reading proficiency
- 56% ▼ -2.00%
- Median HH income
- $58,275
- Composite
- 50.23/100
- National rank
- #1892
- State rank
- #16 of 73 in FL
Livability — Winding Cypress
No livability data for this city. (Only ~50 U.S. cities are tracked.)
Census & demographics
- County
- Collier County · 396,295 people
- Metro
- Naples-Marco Island, FL
- Population (ZIP)
- 23,559
- Household income
- $89,334
- Rent vs Own
- Severe rent burden
- 550.0
Population outlook (Collier County) Hauer SSP2
- Today (2025)
- 420,858 people
- By 2030
- 450,054 · +6.9%
- By 2040
- 502,232 · +19.3%
- By 2050
- 544,932 · +29.5%
- By 2075
- 627,203 · +49.0%
- By 2100
- 659,015 · +56.6%
Race, ethnicity, and origin ACS 2023
- Neighborhood character
- Predominantly White (72%)
- Race & ethnicity
- White 72% Hispanic / Latino 17% Two or more races 13% Black 7%
- Hispanic origin (detail)
- Mexican 7% Puerto Rican 1% Cuban 3%
- Common ancestry
- Hispanic 5% Romanian 4% Lithuanian 1%
- Foreign-born
- 21% · Canada, Jamaica
- Languages at home
- 75% English-only · Spanish 15% French/Haitian/Cajun 5% Other Indo-European 4%
Political lean MEDSL · Collier
- 2024 margin
- Solid R (+33.1) · D 33.1% · R 66.2%
- 2008→2024 swing
- -10.6pp toward R · 2008: -22.5pp · 2024: -33.1pp
- All cycles
- 2024: R+33.1 2020: R+24.7 2016: R+26.0 2012: R+30.1 2008: R+22.5
Not yet ingested
- Civics
- —
Market trends
- HPI YoY
- ▼ -1.48%
- Current HPI
- 266.5545
- Rent YoY
- ▲ 3.21%
- Metro
- Naples-Marco Island, FL
- State GDP YoY
- ▲ 3.28%
- F500 in state
- 36
Industry mix (Fortune 500 HQ in FL)
| Industry | F500 HQs | Revenue |
|---|---|---|
| Industrial Technology | 2 | $29B |
|
||
| Insurance | 2 | $17B |
|
||
| Retail | 1 | $60B |
|
||
| Technology Distribution | 1 | $58B |
|
||
| Homebuilding | 1 | $35B |
|
||
| Technology Manufacturing | 1 | $35B |
|
||
Price history
+211.7% since first listed8 events — show timeline
- 2026-06-15 Listed $245,000 NAPLESMLS
- 2025-04-11 Listing Removed — NAPLESMLS
- 2025-01-01 Listed $285,000 NAPLESMLS
- 2024-04-08 Listing Removed — NAPLESMLS
- 2024-02-22 Listed $285,000 NAPLESMLS
- 2020-02-12 Sold (Public Records) $175,000 Public Records
- 2005-05-27 Sold (Public Records) $145,000 Public Records
- 1989-06-01 Sold (Public Records) $78,600 Public Records
Property tax history
+16.3%/yrLatest (2025): $1,863 · +3.2% YoY. Source: county tax records.
Cash-flow waterfall
monthlySold comps — $/sqft
last 12 mo · ≤1 miLoading sold comps…