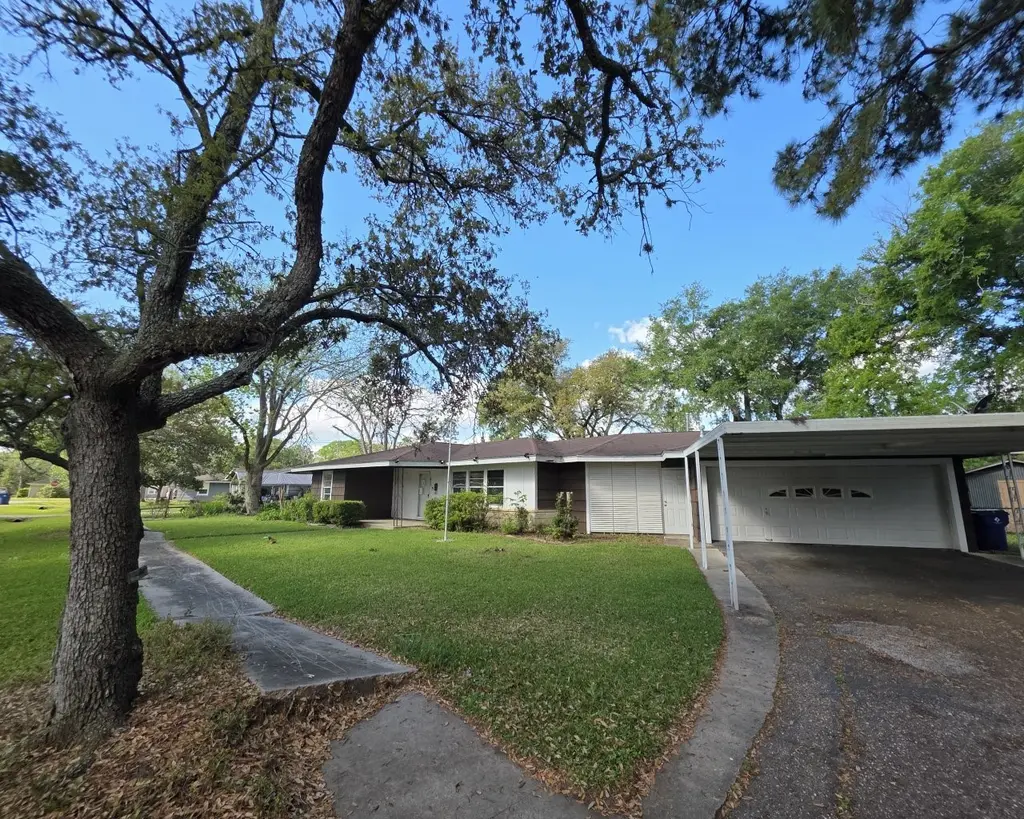
813 N Morgan St · Angleton, TX
Flood risk 1/10 · Minimal
- FEMA flood zone
- X (unshaded)
- Chance of flooding over 30 yrs
- 0.0%
- Est. flood insurance / yr
- $507 – $1,088
Fire risk 3/10 · Minor
- Est. fire insurance / yr
- $1,222 – $2,270
Heat risk 10/10 · Severe
- Hot days now (above 111°F)
- 7 days/yr
- Hot days in 30 yrs
- 25 days/yr
Wind risk 9/10 · Severe
- Chance of severe wind over 30 yrs
- 99.0%
Air-quality risk 2/10 · Minimal
- Unhealthy air days now
- 1 days/yr
- Unhealthy air days in 30 yrs
- 1 days/yr
Risk factors via First Street. Map © Google.
Why this score? — see what drove the B+ grade
The composite is a weighted blend of 9 inputs, each scored 0–100. Each bar is that input's sub-score; the figure is the points it added to the 100-point composite (weight × sub-score).
- Cash flow +29.8/30.0
- ARV discount +15.0/15.0
- 1% rule +10.0/10.0
- DSCR +10.0/10.0
- Livability +3.7/5.0
- Schools +3.5/10.0
- Rent growth +2.5/5.0
- Condition / age +2.5/5.0
- Appreciation +0.0/10.0
$125,000
🖨 Deal sheet (PDF) 📄 Offer letter ✓ Due diligence
Listing remarks MLS
Nice 3-bedroom 3-bath home located on an oversized lot in a quiet neighborhood. Kitchen has lots of counter and cabinet space. Good size bedrooms and closets. Enclosed patio and an open air patio. Fenced back yard great for entertaining and gardening. Please come see for yourself. Hurry will not last long!
Key facts
- Fenced back yard
- Oversized lot
- Quiet neighborhood
Tags
Neighborhood map
What this means for you Summary
Snapshot
- This is a 3-bed/1.0-bath single-family listed at $125k.
Deal economics
- At list price, monthly cash flow is $459 ($6k/yr) — positive.
- The deal already cash-flows at list — no discount required.
- Meets the 1% rule at list price ($2k rent vs $125k).
- Recommended offer: $118k (6.0% below list) — sets the bar for market timing.
- Cap rate 10.7% vs local median 4.0% in Angleton — top-decile yield for the area; either an underpriced asset or a hidden risk that comps aren't pricing in. Stress-test before assuming the spread holds.
Location & tenants
- Location reads 74/100 on livability (#171 in TX, #4,520 nationally) — a middle-class / working-renter tenant base. Strengths: cost of living A+, housing A+, employment A-; Watch: schools D, amenities F, commute F.
- Angleton ISD (suburban): math 36% / reading 44% proficiency, ranked #375 of 826 in TX (top 45%) — families likely to look elsewhere, expect single-tenant / working-renter base with shorter leases.
- Market conditions: 921 active listings in the ZIP; 4 comparable units currently listed for rent nearby; rentals lingering (median 45d on market — plan ~5-8 weeks vacancy on turnover, expect pricing pressure); 75% of comp listings sitting > 30 days — soft ceiling on asking rent; solid renter incomes; 3,960 units permitted in Brazoria County in 2024 (593 in 5+ unit buildings).
Forward outlook
- Local home prices are declining (-3.0%/yr); year-one equity from $864 of loan paydown is wiped out by about $4k of value loss. Plan a longer hold.
- Brazoria County population projected at +44% by 2050 — long-run rental-demand tailwind backs the buy-and-hold thesis.
- At projected returns (-3.0% appreciation + 3.0% rent growth), your $35k cash investment doubles in ~8 years — after that, you're playing with house money.
Negotiation context
- It's been on market 61 days — a 6% lower offer ($118k) is reasonable based on typical stale-listing flexibility.
- 7 sale attempts since 10y ago; this cycle's ask has dropped $10k (7%) from the opening price — seller is motivated, your offer sets the floor, not the list.
Risks & watch-outs
- Watch-outs: property tax is 3.7% of price; built in 1950 — expect roof / HVAC / electrical / plumbing capex.
- Climate carrying-cost: severe wind risk, 99% chance of damaging wind over 30y; extreme-heat days projected 7→25/yr by 2055 (HVAC capex compounding) — expect insurance premiums to compound above CPI over the hold.
Questions for the listing agent
- It's been on market 61 days. Have you received any prior offers? Is the seller open to a 6% concession, seller financing, or rate buy-down credit?
- Built in 1950 — when were the roof, HVAC, electrical panel, plumbing, and water heater last replaced?
- Property tax is high relative to price — has the assessment been appealed recently, and will the sale trigger a re-assessment?
- Why hasn't it sold? Are there any deal-killer items the seller is aware of (foundation, flood, title, zoning, code violations)?
- Is there a deadline driving the sale (1031 exchange, divorce, estate, relocation)? That informs how much negotiation room exists.
- Schools are D-rated, which usually means shorter tenancies and higher turnover. Who's the typical renter profile here, and what's been the actual vacancy rate?
- What's the average days-on-market for RENTAL listings here right now (not sales)? A rising rental-DOM trend means longer vacancies and softer asking-rent achievability than the comps imply.
- What's the recent tenant-quality profile in this submarket — average credit score on applications, eviction rate, late-payment / NSF rate, and stable-employment percentage? A property-management company in the area should have these aggregated.
- How much new for-sale + rental construction is in the pipeline within 1–3 miles? Heavy new supply typically softens prices + rents 12–24 months out; constrained supply supports both.
Investment metrics
- 1% rule
- 1.57% ✓
- Cap rate
- 10.70%
- Cash-on-cash
- 15.73%
- DSCR
- 1.70
- GRM
- 5.3
CMA / ARV
- ARV (median comp)
- $206,835
- List price
- $125,000
- Delta
- -39.57%
- Verdict
- UNDERPRICED
- Comps
- 20 within 1.0 mi
Show comp detail 12 sales within ~0.75 mi
| Address | Dist | Beds/Ba | Sqft | Sold | Price | $/sf | Match |
|---|---|---|---|---|---|---|---|
| 607 E Miller St | 0.08mi | 4/3.0 (+1) | 1,778 (-4%) | 11mo | $229,000 | $129 | 68 |
| 305 Leonard St | 0.48mi | 3/2.0 | 1,768 (-4%) | 2mo | $163,000 | $92 | 64 |
| 632 Northridge St | 0.34mi | 3/2.0 | 1,704 (-8%) | 4mo | $224,900 | $132 | 63 |
| 729 Newman St | 0.68mi | 3/2.0 | 1,840 (-1%) | 1mo | $269,000 | $146 | 63 |
| 630 N Rockisland St | 0.17mi | 3/2.0 | 1,614 (-13%) | 6mo | $235,000 | $146 | 61 |
| 749 Lorrain St | 0.37mi | 3/2.0 | 1,653 (-11%) | 5mo | $195,000 | $118 | 57 |
| 127 N Erskine St | 0.68mi | 3/2.0 | 1,766 (-5%) | 0mo | $145,000 | $82 | 56 |
| 816 E Wilkins St | 0.23mi | 4/2.0 (+1) | 1,587 (-14%) | 6mo | $99,900 | $63 | 51 |
| 744 Browning St | 0.52mi | 4/2.0 (+1) | 1,740 (-6%) | 8mo | $270,000 | $155 | 50 |
| 2016 N Tinsley St | 0.69mi | 4/2.0 (+1) | 1,823 (-2%) | 9mo | $249,000 | $137 | 48 |
| 3119 Emerald Hills Dr | 0.66mi | 3/2.0 | 1,629 (-12%) | 1mo | $199,290 | $122 | 44 |
| 8318 Amethyst Valley Ln | 0.66mi | 4/3.0 (+1) | 1,687 (-9%) | 6mo | $309,888 | $184 | 36 |
Match score weights: distance 35% · size 25% · config 20% · recency 20%. Top-matched comps best support the ARV.
Projected returns pro-forma
-3.0% appreciation · 3.0% rent growth · sell at horizon
- IRR
- 6.7%
- Equity multiple
- 1.26×
- Total profit
- $9,136
- Equity at exit
- $18,638
- IRR
- 16.1%
- Equity multiple
- 2.32×
- Total profit
- $46,271
- Equity at exit
- $10,808
Cash invested: $35,000 (down + closing). Projections, not guarantees.
Landlord ↔ Tenant lean methodology
- Overall (STATE)
- 87 Strongly Landlord-Friendly
- State Texas
- 87 Strongly Landlord-Friendly · R+5
- County
- — inherits STATE
- City
- — inherits STATE
ZIP-level market 77515
- Home prices YoY
- -5.1%
- Active inventory
- 921
- Price-to-rent
- 5.3×
Monthly cashflow live
- Estimated rent
- $1,962 medium interval (Pro) →
- Mortgage (P&I)
- −$656
- Tax from tax record
- −$383 /mo · $4,602/yr
- Insurance
- −$52
- HOA
- −$0
- Vacancy / Maint / Mgmt
- −$412
- Net cashflow
- $459
Break-even live
Sensitivity live
| Price | -10% $530 | -5% $494 | +0% $459 | +5% $423 | +10% $388 |
|---|---|---|---|---|---|
| Rent | -10% $304 | -5% $381 | +0% $459 | +5% $536 | +10% $614 |
| Rate | -1.0pp $522 | -0.5pp $491 | base $459 | +0.5pp $426 | +1.0pp $393 |
UW: 25.0% down · 7.5% · 30yr · 1.5% tax · 5.0% vac · 8.0% maint · 8.0% mgmt
Financing live
Cash to close
- Down payment
- $31,250
- Closing costs
- $3,750
- Reserves months
- —
- Total cash needed
- —
Loan-product check · same deal, 3 products live
Conventional
25% down · 7.5% · 30yr
- Down + closing
- —
- Monthly P&I
- —
- Monthly cashflow
- —
- DSCR
- —
- Eligible?
- —
Personal DTI + credit; lowest rate.
DSCR
20% down · 8.5% · 30yr
- Down + closing
- —
- Monthly P&I
- —
- Monthly cashflow
- —
- DSCR
- —
- Eligible?
- —
No personal income docs; deal must DSCR.
Hard money
10% down · 12.0% · 12mo
- Down + closing
- —
- Monthly P&I
- —
- Monthly cashflow
- —
- DSCR
- —
- Eligible?
- —
Short-term bridge; refi at stabilization.
Rent comps 4 comps
| Address | Beds | Baths | Sqft | Rent | $/sqft | DOM | Units | Dist |
|---|---|---|---|---|---|---|---|---|
| 128 Dallas St Angleton, TX | 3.0 | 2.0 | 1390 | $1,900 | $1.37 | 44d | 1 | 1.29mi |
| 152 Bastrop St Angleton, TX | 3.0 | 2.0 | 1639 | $1,745 | $1.06 | 44d | 1 | 1.32mi |
| 3 Dallas Ct #1 Angleton, TX | 3.0 | 3.0 | 1550 | $1,450 | $0.94 | 44d | 1 | 1.41mi |
| 513 Robin St Angleton, TX | 4.0 | 2.0 | 1900 | $2,495 | $1.31 | 22d | 1 | 1.47mi |
Listing history 28 events
-
2026-06-08statusdays on market $125,000 Pending 61 DOM
-
2026-06-07days on market $125,000 Active 60 DOM
-
2026-06-04days on market $125,000 Active 57 DOM
-
2026-06-03days on market $125,000 Active 56 DOM
-
2026-06-02days on market $125,000 Active 55 DOM
-
2026-06-01days on market $125,000 Active 54 DOM
-
2026-05-31days on market $125,000 Active 53 DOM
-
2026-05-19status Pending 309-char remark
Show marketing remark (309 chars)
Nice 3-bedroom 3-bath home located on an oversized lot in a quiet neighborhood. Kitchen has lots of counter and cabinet space. Good size bedrooms and closets. Enclosed patio and an open air patio. Fenced back yard great for entertaining and gardening. Please come see for yourself. Hurry will not last long!
-
2026-05-02price $125,000 309-char remark
Show marketing remark (309 chars)
Nice 3-bedroom 3-bath home located on an oversized lot in a quiet neighborhood. Kitchen has lots of counter and cabinet space. Good size bedrooms and closets. Enclosed patio and an open air patio. Fenced back yard great for entertaining and gardening. Please come see for yourself. Hurry will not last long!
-
2026-03-30$135,000 Active 309-char remark
Show marketing remark (309 chars)
Nice 3-bedroom 3-bath home located on an oversized lot in a quiet neighborhood. Kitchen has lots of counter and cabinet space. Good size bedrooms and closets. Enclosed patio and an open air patio. Fenced back yard great for entertaining and gardening. Please come see for yourself. Hurry will not last long!
-
2025-12-04historical
-
2025-07-16price $185,000
-
2025-04-07$218,000 New
-
2023-11-10historical
-
2023-11-02status Active
-
2023-09-12status Pending
-
2023-08-31status Option Pending
-
2023-07-25$210,000 Active
-
2017-10-11soldstatus
-
2017-10-10soldstatus
-
2017-05-15$149,900
-
2016-04-07soldstatus
-
2016-04-05soldstatus Sold
-
2016-04-05soldstatus
-
2016-02-29status Pending
-
2016-02-22status Option Pending
-
2016-02-11$137,900 Active
-
2016-02-10$137,900
ⓘ Source: listings_history table (triggers on properties + properties_extension) + one-shot
backfill from property_details.listing_events for pre-trigger history.
Tax reassessment forecast TX · Resets to sale price
- Current annual tax
- $4,602 · $383/mo
- Projected year-2 tax
- $4,602 · $383/mo
- Expected delta
- $0/yr ($0/mo · 0.0%)
ⓘ Screening estimate from a state-policy table — verify with the county assessor before closing.
Climate risk First Street
- Flood 1/10 Low FEMA zone X (unshaded) · 0% chance over 30 yrs
- Wildfire 3/10 Moderate
- Heat 10/10 Extreme 7 d/yr ≥111°F today · 25 d/yr by 30 yrs out
- Wind 9/10 Extreme 99% chance of damaging wind over 30 yrs
- Air quality 2/10 Low 1 unhealthy d/yr today · 1 by 30 yrs out
Nearby sold comps map
Loading sold comps map…
Walkable amenities ~0.75 mi
Loading nearby amenities…
Taxation est. · year 1
- Rental income
- $23,543
- − Mortgage interest
- −$7,002
- − Property taxes
- −$4,602
- − Insurance
- −$625
- − Repairs & maintenance
- −$1,883
- − Management
- −$1,883
- − Depreciation
- −$3,636
- Taxable income
- $3,911
- Est. tax owed @ 24.0%
- −$939
- After-tax cash flow
- $4,567/yr
For passive investors: Depreciation is non-cash, so a rental often shows a tax loss while cash-flowing — sheltering income. Rental losses are passive: they offset passive income freely, and up to $25,000/yr can offset ordinary (W-2) income if you actively participate and your MAGI is under $100k (phasing out to $0 by $150k); unused losses carry forward. On sale, claimed depreciation is recaptured at up to 25%, and gains may owe capital-gains tax (a 1031 exchange can defer both). Figures are a year-1 estimate at your 24.0% rate — not tax advice; consult a CPA.
Schools (NCES district)
- District
- Angleton ISD
- NCES district ID
- 4808310
- Math proficiency
- 36% ▼ -8.00%
- Reading proficiency
- 44% ▲ 1.00%
- Median HH income
- $55,670
- Composite
- 35.01/100
- National rank
- #5046
- State rank
- #375 of 826 in TX
Livability — Angleton
- Score
- 74/100
- State rank
- #171
- US rank
- #4520
Category grades
Schools grade is shown separately in the Schools card above.
Census & demographics
- Census place
- Angleton, TX
- County
- Brazoria County · 374,982 people
- City population
- 34,088
- Metro
- Houston-The Woodlands-Sugar Land, TX
- Population (ZIP)
- 34,088
- Household income
- $88,787
- Rent vs Own
- Severe rent burden
- 785.0
Population outlook (Brazoria County) Hauer SSP2
- Today (2025)
- 420,414 people
- By 2030
- 457,585 · +8.8%
- By 2040
- 532,232 · +26.6%
- By 2050
- 605,399 · +44.0%
- By 2075
- 779,358 · +85.4%
- By 2100
- 883,759 · +110.2%
Race, ethnicity, and origin ACS 2023
- Neighborhood character
- Diverse neighborhood (Simpson 0.58)
- Race & ethnicity
- White 55% Hispanic / Latino 33% Two or more races 18% Black 8% Asian 2%
- Hispanic origin (detail)
- Mexican 28%
- Common ancestry
- Lithuanian 3% Romanian 2% Slovak 1%
- Foreign-born
- 8% · Canada, Vietnam
- Languages at home
- 78% English-only · Spanish 20% Other Asian/Pacific 1%
Political lean MEDSL · Brazoria
- 2024 margin
- R (+19.7) · D 39.5% · R 59.2% · Other 1.3%
- 2008→2024 swing
- +9.9pp toward D · 2008: -29.6pp · 2024: -19.7pp
- All cycles
- 2024: R+19.7 2020: R+18.2 2016: R+24.6 2012: R+34.2 2008: R+29.6
Not yet ingested
- Civics
- —
Market trends
- HPI YoY
- ▼ -15.59%
- Current HPI
- 288.7286
- Rent YoY
- —
- Metro
- Houston-The Woodlands-Sugar Land, TX
- State GDP YoY
- ▲ 3.95%
- F500 in state
- 110
Industry mix (Fortune 500 HQ in TX)
| Industry | F500 HQs | Revenue |
|---|---|---|
| Energy | 16 | $1,198B |
|
||
| Technology | 5 | $198B |
|
||
| Engineering / Construction | 4 | $72B |
|
||
| Energy Services | 3 | $60B |
|
||
| Utilities | 3 | $41B |
|
||
| Healthcare | 2 | $330B |
|
||
Price history
-9.4% since first listed21 events — show timeline
- 2026-05-19 Pending — HARMLS
- 2026-05-02 Price Changed $125,000 HARMLS
- 2026-03-30 Listed $135,000 HARMLS
- 2025-12-04 Listing Removed — LERA
- 2025-07-16 Price Changed $185,000 LERA
- 2025-04-07 Listed $218,000 LERA
- 2023-11-10 Listing Removed — HARMLS
- 2023-11-02 Relisted — HARMLS
- 2023-09-12 Pending — HARMLS
- 2023-08-31 Pending — HARMLS
- 2023-07-25 Listed $210,000 HARMLS
- 2017-10-11 Sold (Public Records) — Public Records
- 2017-10-10 Sold (MLS) — BCBR
- 2017-05-15 Listed $149,900 BCBR
- 2016-04-07 Sold (Public Records) — Public Records
- 2016-04-05 Sold (MLS) — BCBR
- 2016-04-05 Sold (MLS) — HARMLS
- 2016-02-29 Pending — HARMLS
- 2016-02-22 Pending — HARMLS
- 2016-02-11 Listed $137,900 HARMLS
- 2016-02-10 Listed $137,900 BCBR
Property tax history
+2.7%/yrLatest (2025): $4,602 · -3.3% YoY. Source: county tax records.
Cash-flow waterfall
monthlySold comps — $/sqft
last 12 mo · ≤1 miLoading sold comps…