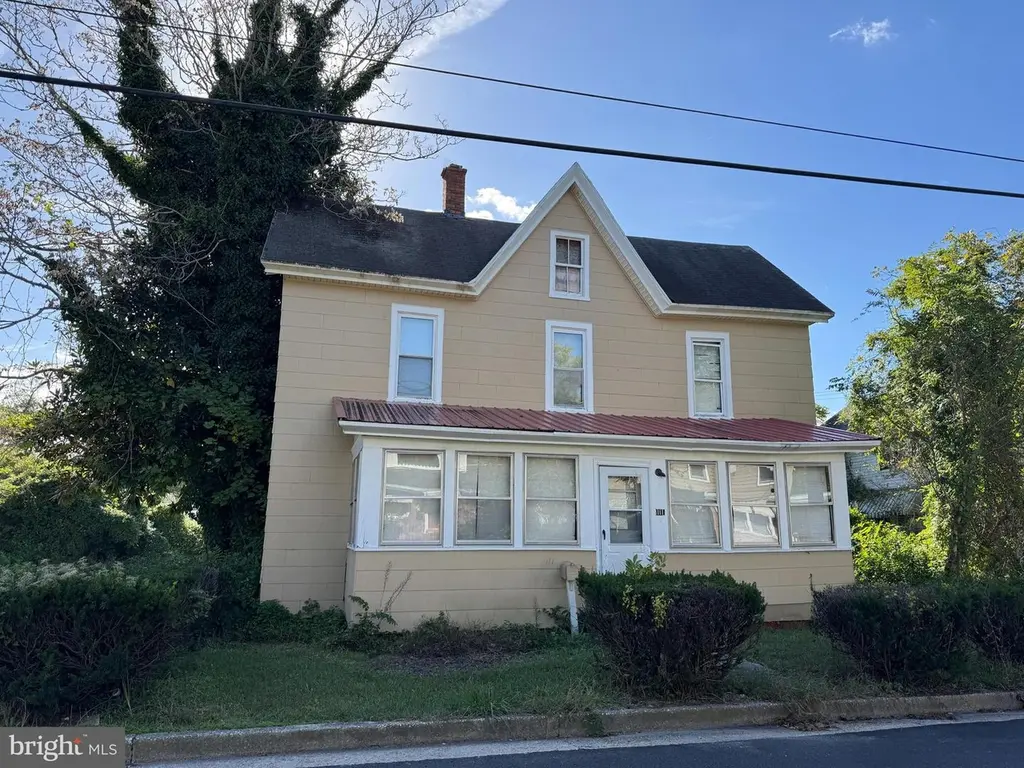
111 N Ross St · Snow Hill, MD
Flood risk 5/10 · Moderate
- FEMA flood zone
- AE
- Chance of flooding over 30 yrs
- 0.24%
- Est. flood insurance / yr
- $1,737 – $8,500
Fire risk 1/10 · Minimal
- Est. fire insurance / yr
- $755 – $1,403
Heat risk 8/10 · Major
- Hot days now (above 103°F)
- 7 days/yr
- Hot days in 30 yrs
- 17 days/yr
Wind risk 8/10 · Major
- Chance of severe wind over 30 yrs
- 80.0%
Air-quality risk 2/10 · Minimal
- Unhealthy air days now
- 1 days/yr
- Unhealthy air days in 30 yrs
- 2 days/yr
Risk factors via First Street. Map © Google.
Why this score? — see what drove the B+ grade
The composite is a weighted blend of 9 inputs, each scored 0–100. Each bar is that input's sub-score; the figure is the points it added to the 100-point composite (weight × sub-score).
- Cash flow +30.0/30.0
- ARV discount +15.0/15.0
- 1% rule +10.0/10.0
- DSCR +10.0/10.0
- Livability +3.5/5.0
- Schools +3.3/10.0
- Rent growth +2.5/5.0
- Condition / age +2.5/5.0
- Appreciation +0.0/10.0
$139,900
🖨 Deal sheet 📄 Offer letter ✓ Due diligence
Listing remarks MLS
Charming 1920 Home in the Heart of Snow Hill! Step back in time with this 1920-built home, ready for restoration. Featuring 3 bedrooms and 1 full bath, this property sits on a spacious 0.42-acre lot—a great space for gardening, outdoor entertaining, or even future expansion. You’ll love the prime location, just a short walk to downtown Snow Hill, where you can enjoy local shops, dining, and the scenic Pocomoke River. This home needs repair and is being sold as-is, offering an ideal opportunity for investors, renovators, or visionaries eager to bring new life to a classic Eastern Shore property. Endless potential to create something truly special!
Key facts
- Spacious lot
- Prime location
- Local shops
Tags
Neighborhood map
What this means for you Summary
Snapshot
- This is a 3-bed/1.0-bath single-family listed at $140k.
Deal economics
- At list price, monthly cash flow is $593 ($7k/yr) — positive.
- The deal already cash-flows at list — no discount required.
- Meets the 1% rule at list price ($2k rent vs $140k).
- Recommended offer: $123k (12.0% below list) — sets the bar for market timing.
Location & tenants
- Location reads 70/100 on livability (#167 in MD) — a middle-class / working-renter tenant base. Strengths: cost of living A+, health & safety A+, crime A-; Watch: amenities F, commute F, employment F.
- Worcester County Public Schools (town): math 30% / reading 44% proficiency, ranked #6 of 24 in MD (top 25%) — families likely to look elsewhere, expect single-tenant / working-renter base with shorter leases.
- Market conditions: 26 active listings in the ZIP; 1 comparable units currently listed for rent nearby; 354 units permitted in Worcester County in 2024 (6 in 5+ unit buildings).
Forward outlook
- Local home prices are declining (-3.0%/yr); year-one equity from $967 of loan paydown is wiped out by about $4k of value loss. Plan a longer hold.
- Worcester County population projected to shrink 4% by 2050 — rents likely to lag national; underwrite the cash flow, not the appreciation.
- At projected returns (-3.0% appreciation + 3.0% rent growth), your $39k cash investment doubles in ~7 years — after that, you're playing with house money.
Negotiation context
- It's been on market 241 days — a 12% lower offer ($123k) is reasonable based on typical stale-listing flexibility.
- 3 sale attempts since 28y ago; this cycle's ask has dropped $39k (22%) from the opening price — seller is motivated, your offer sets the floor, not the list.
- Current owner paid $58k; list at $140k implies a 141% gain — meaningful room to come down on a strong offer.
Risks & watch-outs
- Watch-outs: flood insurance adds $427/mo; built in 1920 — expect roof / HVAC / electrical / plumbing capex.
- Climate carrying-cost: in FEMA flood zone AE (mandatory federal flood insurance); severe wind risk, 80% chance of damaging wind over 30y; extreme-heat days projected 7→17/yr by 2055 (HVAC capex compounding) — expect insurance premiums to compound above CPI over the hold.
Questions for the listing agent
- It's been on market 241 days. Have you received any prior offers? Is the seller open to a 12% concession, seller financing, or rate buy-down credit?
- Built in 1920 — when were the roof, HVAC, electrical panel, plumbing, and water heater last replaced?
- What's the actual annual flood-insurance premium (NFIP or private), and is the property in a SFHA with mandatory coverage?
- Why hasn't it sold? Are there any deal-killer items the seller is aware of (foundation, flood, title, zoning, code violations)?
- Is there a deadline driving the sale (1031 exchange, divorce, estate, relocation)? That informs how much negotiation room exists.
- What's the average days-on-market for RENTAL listings here right now (not sales)? A rising rental-DOM trend means longer vacancies and softer asking-rent achievability than the comps imply.
- What's the recent tenant-quality profile in this submarket — average credit score on applications, eviction rate, late-payment / NSF rate, and stable-employment percentage? A property-management company in the area should have these aggregated.
- How much new for-sale + rental construction is in the pipeline within 1–3 miles? Heavy new supply typically softens prices + rents 12–24 months out; constrained supply supports both.
Investment metrics
- 1% rule
- 1.75% ✓
- Cap rate
- 15.04%
- Cash-on-cash
- 31.24%
- DSCR
- 2.39
- GRM
- 4.8
CMA / ARV
- ARV (median comp)
- $232,122
- List price
- $139,900
- Delta
- -39.73%
- Verdict
- UNDERPRICED
- Comps
- 20 within 1.0 mi
Show comp detail 12 sales within ~0.75 mi
| Address | Dist | Beds/Ba | Sqft | Sold | Price | $/sf | Match |
|---|---|---|---|---|---|---|---|
| 309 W Market St | 0.04mi | 3/2.0 | 1,441 (-5%) | 4mo | $225,000 | $156 | 82 |
| 301 W Market St | 0.10mi | 4/2.0 (+1) | 1,467 (-4%) | 0mo | $344,000 | $234 | 80 |
| 211 Market St | 0.15mi | 3/2.5 | 1,642 (+8%) | 14mo | $310,000 | $189 | 62 |
| 402 W Federal St | 0.09mi | 3/1.0 | 1,308 (-14%) | 15mo | $70,000 | $54 | 60 |
| 108 N Morris St | 0.12mi | 3/2.0 | 1,614 (+6%) | 23mo | $299,900 | $186 | 60 |
| 213 S Ross St | 0.30mi | 3/2.0 | 1,352 (-11%) | 6mo | $130,000 | $96 | 58 |
| 403 S Morris St | 0.53mi | 3/2.0 | 1,604 (+6%) | 10mo | $305,000 | $190 | 54 |
| 107 W Martin St | 0.43mi | 3/1.5 | 1,452 (-4%) | 22mo | $230,000 | $158 | 52 |
| 220 E Federal St | 0.70mi | 3/1.5 | 1,552 (+2%) | 13mo | $170,000 | $110 | 51 |
| 107 Belt St | 0.59mi | 4/1.5 (+1) | 1,428 (-6%) | 15mo | $250,000 | $175 | 43 |
| 115 Purnell St | 0.70mi | 3/2.5 | 1,344 (-12%) | 2mo | $235,000 | $175 | 40 |
| 111 Purnell St | 0.68mi | 2/1.0 (-1) | 1,352 (-11%) | 11mo | $204,000 | $151 | 35 |
Match score weights: distance 35% · size 25% · config 20% · recency 20%. Top-matched comps best support the ARV.
Projected returns pro-forma
-3.0% appreciation · 3.0% rent growth · sell at horizon
- IRR
- 9.9%
- Equity multiple
- 1.39×
- Total profit
- $15,381
- Equity at exit
- $20,860
- IRR
- 19.2%
- Equity multiple
- 2.61×
- Total profit
- $63,133
- Equity at exit
- $12,096
Cash invested: $39,172 (down + closing). Projections, not guarantees.
Landlord ↔ Tenant lean methodology
- Overall (STATE)
- 27 Tenant-Leaning
- State Maryland
- 27 Tenant-Leaning · D+14
- County
- — inherits STATE
- City
- — inherits STATE
ZIP-level market 21863
- Home prices YoY
- -12.0%
- Active inventory
- 26
- Price-to-rent
- 4.8×
Monthly cashflow live
- Estimated rent
- $2,450 medium interval (Pro) →
- Mortgage (P&I)
- −$734
- Tax from tax record
- −$124 /mo · $1,485/yr
- Insurance
- −$58
- Flood insurance flood zone
- −$427 /mo · $5,118/yr
- HOA
- −$0
- Vacancy / Maint / Mgmt
- −$514
- Net cashflow
- $593
Break-even live
UW: 25.0% down · 7.5% · 30yr · 1.5% tax · 5.0% vac · 8.0% maint · 8.0% mgmt
Financing live
Cash to close
- Down payment
- $34,975
- Closing costs
- $4,197
- Reserves months
- —
- Total cash needed
- —
Loan-product check · same deal, 3 products live
Conventional
25% down · 7.5% · 30yr
- Down + closing
- —
- Monthly P&I
- —
- Monthly cashflow
- —
- DSCR
- —
- Eligible?
- —
Personal DTI + credit; lowest rate.
DSCR
20% down · 8.5% · 30yr
- Down + closing
- —
- Monthly P&I
- —
- Monthly cashflow
- —
- DSCR
- —
- Eligible?
- —
No personal income docs; deal must DSCR.
Hard money
10% down · 12.0% · 12mo
- Down + closing
- —
- Monthly P&I
- —
- Monthly cashflow
- —
- DSCR
- —
- Eligible?
- —
Short-term bridge; refi at stabilization.
Rent comps 1 comps
| Address | Beds | Baths | Sqft | Rent | $/sqft | DOM | Units | Dist |
|---|---|---|---|---|---|---|---|---|
| 211 W Market St Snow Hill, MD | 3.0 | 2.5 | 1642 | $2,450 | $1.49 | 43d | 1 | 0.18mi |
Listing history 23 events
-
2026-06-18days on market $139,900 Active 241 DOM
-
2026-06-17days on market $139,900 Active 240 DOM
-
2026-06-16days on market $139,900 Active 239 DOM
-
2026-06-15days on market $139,900 Active 238 DOM
-
2026-06-14days on market $139,900 Active 236 DOM
-
2026-06-13days on market $139,900 Active 235 DOM
-
2026-06-10days on market $139,900 Active 233 DOM
-
2026-06-09days on market $139,900 Active 232 DOM
-
2026-06-08days on market $139,900 Active 231 DOM
-
2026-06-07days on market $139,900 Active 230 DOM
-
2026-06-02days on market $139,900 Active 225 DOM
-
2026-06-01days on market $139,900 Active 224 DOM
-
2026-05-31days on market $139,900 Active 223 DOM
-
2026-05-30days on market $139,900 Active 222 DOM
-
2026-04-15price $139,900 666-char remark
Show marketing remark (666 chars)
Charming 1920 Home in the Heart of Snow Hill! Step back in time with this 1920-built home, ready for restoration. Featuring 3 bedrooms and 1 full bath, this property sits on a spacious 0.42-acre lot—a great space for gardening, outdoor entertaining, or even future expansion. You’ll love the prime location, just a short walk to downtown Snow Hill, where you can enjoy local shops, dining, and the scenic Pocomoke River. This home needs repair and is being sold as-is, offering an ideal opportunity for investors, renovators, or visionaries eager to bring new life to a classic Eastern Shore property. Endless potential to create something truly special!
-
2026-03-06price $150,000 666-char remark
Show marketing remark (666 chars)
Charming 1920 Home in the Heart of Snow Hill! Step back in time with this 1920-built home, ready for restoration. Featuring 3 bedrooms and 1 full bath, this property sits on a spacious 0.42-acre lot—a great space for gardening, outdoor entertaining, or even future expansion. You’ll love the prime location, just a short walk to downtown Snow Hill, where you can enjoy local shops, dining, and the scenic Pocomoke River. This home needs repair and is being sold as-is, offering an ideal opportunity for investors, renovators, or visionaries eager to bring new life to a classic Eastern Shore property. Endless potential to create something truly special!
-
2025-11-14price $165,000 666-char remark
Show marketing remark (666 chars)
Charming 1920 Home in the Heart of Snow Hill! Step back in time with this 1920-built home, ready for restoration. Featuring 3 bedrooms and 1 full bath, this property sits on a spacious 0.42-acre lot—a great space for gardening, outdoor entertaining, or even future expansion. You’ll love the prime location, just a short walk to downtown Snow Hill, where you can enjoy local shops, dining, and the scenic Pocomoke River. This home needs repair and is being sold as-is, offering an ideal opportunity for investors, renovators, or visionaries eager to bring new life to a classic Eastern Shore property. Endless potential to create something truly special!
-
2025-10-20$179,000 Active 666-char remark
Show marketing remark (666 chars)
Charming 1920 Home in the Heart of Snow Hill! Step back in time with this 1920-built home, ready for restoration. Featuring 3 bedrooms and 1 full bath, this property sits on a spacious 0.42-acre lot—a great space for gardening, outdoor entertaining, or even future expansion. You’ll love the prime location, just a short walk to downtown Snow Hill, where you can enjoy local shops, dining, and the scenic Pocomoke River. This home needs repair and is being sold as-is, offering an ideal opportunity for investors, renovators, or visionaries eager to bring new life to a classic Eastern Shore property. Endless potential to create something truly special!
-
2000-08-15soldstatus $58,000
-
1999-07-28soldstatus $31,500 99-char remark
Show marketing remark (99 chars)
NICE HOUSE WITH A LARGE DECK, CITY SERVICES, LARGE LOT, GOOD INVESTMENT PROPERTY, BEING SOLD AS IS.
-
1999-07-02$36,900 99-char remark
Show marketing remark (99 chars)
NICE HOUSE WITH A LARGE DECK, CITY SERVICES, LARGE LOT, GOOD INVESTMENT PROPERTY, BEING SOLD AS IS.
-
1999-03-15historical
-
1998-09-24$39,900
ⓘ Source: listings_history table (triggers on properties + properties_extension) + one-shot
backfill from property_details.listing_events for pre-trigger history.
Tax reassessment forecast MD · Partial reset (capped growth)
- Current annual tax
- $1,485 · $124/mo
- Projected year-2 tax
- $1,505 · $125/mo
- Expected delta
- +$20/yr (+$2/mo · 1.3%)
ⓘ Screening estimate from a state-policy table — verify with the county assessor before closing.
Climate risk First Street
- Flood 5/10 Major FEMA zone AE · 24% chance over 30 yrs
- Wildfire 1/10 Low
- Heat 8/10 Severe 7 d/yr ≥103°F today · 17 d/yr by 30 yrs out
- Wind 8/10 Severe 80% chance of damaging wind over 30 yrs
- Air quality 2/10 Low 1 unhealthy d/yr today · 2 by 30 yrs out
Nearby sold comps map
Loading sold comps map…
Walkable amenities ~0.75 mi
Loading nearby amenities…
Taxation est. · year 1
- Rental income
- $29,400
- − Mortgage interest
- −$7,837
- − Property taxes
- −$1,485
- − Insurance
- −$5,818
- − Repairs & maintenance
- −$2,352
- − Management
- −$2,352
- − Depreciation
- −$4,070
- Taxable income
- $5,486
- Est. tax owed @ 24.0%
- −$1,317
- After-tax cash flow
- $5,802/yr
For passive investors: Depreciation is non-cash, so a rental often shows a tax loss while cash-flowing — sheltering income. Rental losses are passive: they offset passive income freely, and up to $25,000/yr can offset ordinary (W-2) income if you actively participate and your MAGI is under $100k (phasing out to $0 by $150k); unused losses carry forward. On sale, claimed depreciation is recaptured at up to 25%, and gains may owe capital-gains tax (a 1031 exchange can defer both). Figures are a year-1 estimate at your 24.0% rate — not tax advice; consult a CPA.
Schools (NCES district)
- District
- Worcester County Public Schools
- NCES district ID
- 2400720
- Math proficiency
- 30% ▼ -25.00%
- Reading proficiency
- 44% ▼ -20.00%
- Median HH income
- $56,748
- Composite
- 32.6/100
- National rank
- #5672
- State rank
- #6 of 24 in MD
Livability — Snow Hill
- Score
- 70/100
- State rank
- #167
- US rank
- #7515
Category grades
Schools grade is shown separately in the Schools card above.
Census & demographics
- Census place
- Snow Hill, MD
- Population (ZIP)
- 5,202
Population outlook (Worcester County) Hauer SSP2
- Today (2025)
- 51,363 people
- By 2030
- 51,191 · -0.3%
- By 2040
- 50,459 · -1.8%
- By 2050
- 49,451 · -3.7%
- By 2075
- 48,533 · -5.5%
- By 2100
- 44,223 · -13.9%
Race, ethnicity, and origin ACS 2023
- Neighborhood character
- Predominantly White (71%)
- Race & ethnicity
- White 71% Black 22% Two or more races 5% Hispanic / Latino 3% Asian 1%
- Common ancestry
- Slovak 2% Romanian 1% Italian 1%
- Foreign-born
- 2% · Canada
- Languages at home
- 96% English-only · Spanish 2% Other Indo-European 1%
Political lean MEDSL · Worcester
- 2024 margin
- Strong R (+22.0) · D 38.0% · R 60.0% · Other 2.0%
- 2008→2024 swing
- -6.5pp toward R · 2008: -15.5pp · 2024: -22.0pp
- All cycles
- 2024: R+22.0 2020: R+19.0 2016: R+27.9 2012: R+18.3 2008: R+15.5
Not yet ingested
- Civics
- —
Market trends
- HPI YoY
- ▼ -39.78%
- Current HPI
- 291.6294
- Rent YoY
- —
- Metro
- —
- State GDP YoY
- ▲ 2.97%
- F500 in state
- 12
Industry mix (Fortune 500 HQ in MD)
| Industry | F500 HQs | Revenue |
|---|---|---|
| Aerospace / Defense | 1 | $71B |
|
||
| Utilities | 1 | $25B |
|
||
| Hotels | 1 | $24B |
|
||
| Consumer Goods | 1 | $7B |
|
||
| Real Estate | 1 | $6B |
|
||
| Chemicals | 1 | $2B |
|
||
Price history
+250.6% since first listed9 events — show timeline
- 2026-04-15 Price Changed $139,900 BRIGHT MLS
- 2026-03-06 Price Changed $150,000 BRIGHT MLS
- 2025-11-14 Price Changed $165,000 BRIGHT MLS
- 2025-10-20 Listed $179,000 BRIGHT MLS
- 2000-08-15 Sold (Public Records) $58,000 Public Records
- 1999-07-28 Sold (MLS) $31,500 BRIGHT MLS
- 1999-07-02 Listed $36,900 BRIGHT MLS
- 1999-03-15 Listing Removed — BRIGHT MLS
- 1998-09-24 Listed $39,900 BRIGHT MLS
Property tax history
+2.1%/yrLatest (2025): $1,485 · +1.9% YoY. Source: county tax records.
Cash-flow waterfall
monthlySold comps — $/sqft
last 12 mo · ≤1 miLoading sold comps…