 Multi-family
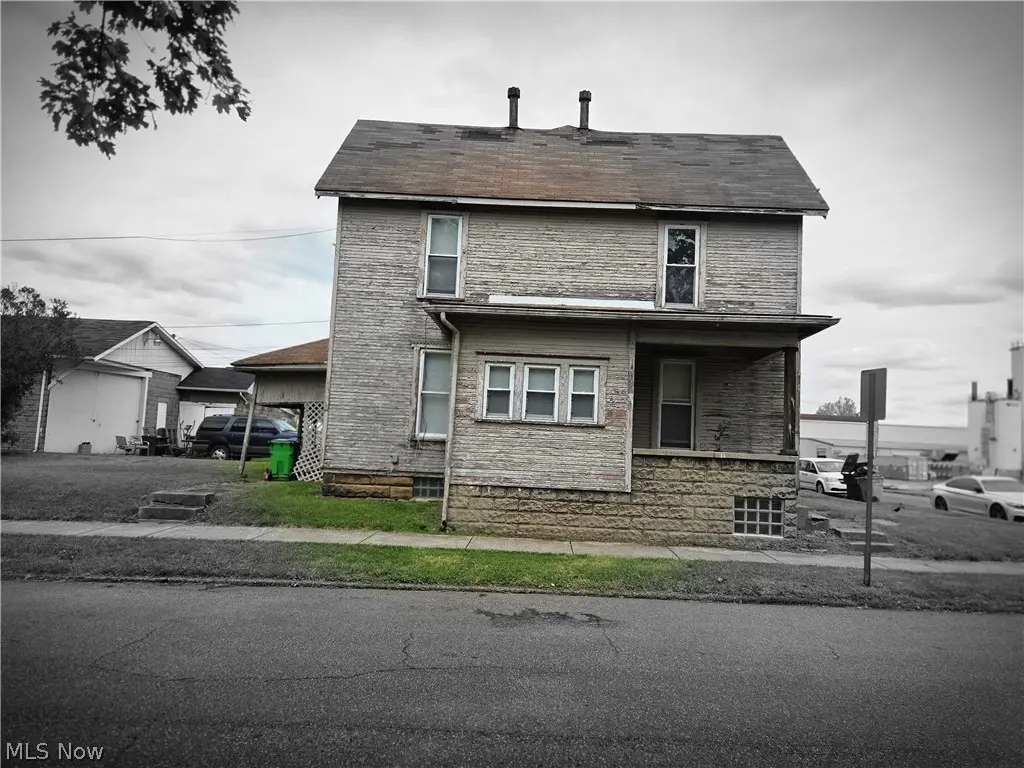
369/371 5th · Coshocton, OH
Flood risk 1/10 · Minimal
- FEMA flood zone
- X (unshaded)
- Chance of flooding over 30 yrs
- 0.0%
- Est. flood insurance / yr
- $473 – $860
Fire risk 1/10 · Minimal
- Est. fire insurance / yr
- $713 – $1,323
Heat risk 4/10 · Minor
- Hot days now (above 98°F)
- 7 days/yr
- Hot days in 30 yrs
- 18 days/yr
Wind risk 2/10 · Minimal
- Chance of severe wind over 30 yrs
- 0.0%
Air-quality risk 2/10 · Minimal
- Unhealthy air days now
- 1 days/yr
- Unhealthy air days in 30 yrs
- 3 days/yr
Risk factors via First Street. Map © Google.
Why this score? — see what drove the B+ grade
The composite is a weighted blend of 9 inputs, each scored 0–100. Each bar is that input's sub-score; the figure is the points it added to the 100-point composite (weight × sub-score).
- Cash flow +30.0/30.0
- ARV discount +15.0/15.0
- 1% rule +10.0/10.0
- DSCR +10.0/10.0
- Schools +3.6/10.0
- Livability +3.5/5.0
- Rent growth +2.5/5.0
- Condition / age +2.5/5.0
- Appreciation +0.0/10.0
$125,900
🖨 Deal sheet (PDF) 📄 Offer letter ✓ Due diligence
Multi-family units
County records classify this as Multi-Family (2-4 Unit). Listing-text estimate: 1 unit. estimate disagrees with records
Listing remarks
Interiors have been up dated. The exterior needs upgraded. There are no leases. The apartments are rented. Don't judge the building by the exterior. Kitchens and baths have been updated. Cash or conventional.
Key facts
- 0.48 acre lot
- Built 1900
- Listed 31 days
Tags
Property features AI
Exterior
- Parking: On-street parking
- Utilities: Public water; Public sewer
- Home design: 2-story building
- Construction: Wood siding exterior; Asphalt/fiberglass roof; Block foundation; Built (year per public records)
- Exterior features: Lot is approximately 0.48 acres
Interior
- Bathrooms: 2 full bathrooms
- Heating & cooling: Forced air heating; Gas heating
- Interior features: Unfinished basement; Total of 10 rooms; Has basement
Neighborhood map
What this means for you Summary
Snapshot
- This is a 4-bed/2.0-bath multifamily listed at $126k.
Deal economics
- At list price, monthly cash flow is $721 ($9k/yr) — positive.
- The deal already cash-flows at list — no discount required.
- Meets the 1% rule at list price ($2k rent vs $126k).
- Recommended offer: $122k (3.0% below list) — sets the bar for market timing.
- Cap rate 13.2% vs local median 3.8% in Coshocton — top-decile yield for the area; either an underpriced asset or a hidden risk that comps aren't pricing in. Stress-test before assuming the spread holds.
Location & tenants
- Location reads 69/100 on livability (#526 in OH) — a middle-class / working-renter tenant base. Strengths: cost of living A+, housing A+, health & safety B+; Watch: crime C-, amenities F, commute F.
- Coshocton City (town): math 39% / reading 49% proficiency, ranked #518 of 656 in OH (top 79%) — families likely to look elsewhere, expect single-tenant / working-renter base with shorter leases; 62% free/reduced lunch — lower-income household profile, screen leases tightly.
- Market conditions: 116 active listings in the ZIP; 7 units permitted in Coshocton County in 2024 (0 in 5+ unit buildings).
- This rent runs 45% of the median local income ($52k/yr) — at the standard rent-burdened threshold; future hikes will face affordability resistance.
Forward outlook
- Local home prices are declining (-3.0%/yr); year-one equity from $870 of loan paydown is wiped out by about $4k of value loss. Plan a longer hold.
- Coshocton County population projected at -18% by 2050 — secular population decline; favor cash flow + early exit over multi-decade hold.
- At projected returns (-3.0% appreciation + 3.0% rent growth), your $35k cash investment doubles in ~5 years — after that, you're playing with house money.
Negotiation context
- It's been on market 31 days — a 3% lower offer ($122k) is reasonable based on typical stale-listing flexibility.
- 3 sale attempts since 17y ago with the ask held roughly flat each time — persistent listings suggest the price (not the market) is what's stuck; bring a comps-based counter.
Risks & watch-outs
- Watch-outs: built in 1900 — expect roof / HVAC / electrical / plumbing capex.
Questions for the listing agent
- It's been on market 31 days. Have you received any prior offers? Is the seller open to a 3% concession, seller financing, or rate buy-down credit?
- Built in 1900 — when were the roof, HVAC, electrical panel, plumbing, and water heater last replaced?
- Is there a deadline driving the sale (1031 exchange, divorce, estate, relocation)? That informs how much negotiation room exists.
- What's the average days-on-market for RENTAL listings here right now (not sales)? A rising rental-DOM trend means longer vacancies and softer asking-rent achievability than the comps imply.
- What's the recent tenant-quality profile in this submarket — average credit score on applications, eviction rate, late-payment / NSF rate, and stable-employment percentage? A property-management company in the area should have these aggregated.
- How much new apartment / multifamily construction is in the pipeline within 1–3 miles? Heavy new supply (>2% of stock underway) typically softens rents 12–24 months out; light construction supports rent growth.
Investment metrics
- 1% rule
- 1.54% ✓
- Cap rate
- 13.17%
- Cash-on-cash
- 24.55%
- DSCR
- 2.09
- GRM
- 5.4
CMA / ARV
- ARV (on-the-fly)
- $178,800
- Comps found
- 2
Show comp detail 2 sales within ~0.75 mi
| Address | Dist | Beds/Ba | Sqft | Sold | Price | $/sf | Match |
|---|---|---|---|---|---|---|---|
| 703 Locust St | 0.52mi | 4/2.0 | 2,389 (+0%) | 10mo | $178,000 | $75 | 67 |
| 397 South Lawn Ave | 0.17mi | 4/2.0 | 2,184 (-8%) | 17mo | $95,000 | $43 | 64 |
Match score weights: distance 35% · size 25% · config 20% · recency 20%. Top-matched comps best support the ARV.
Projected returns pro-forma
-3.0% appreciation · 3.0% rent growth · sell at horizon
- IRR
- 17.9%
- Equity multiple
- 1.72×
- Total profit
- $25,522
- Equity at exit
- $18,772
- IRR
- 26.3%
- Equity multiple
- 3.31×
- Total profit
- $81,340
- Equity at exit
- $10,886
Cash invested: $35,252 (down + closing). Projections, not guarantees.
Landlord ↔ Tenant lean methodology
- Overall (STATE)
- 73 Landlord-Friendly
- State Ohio
- 73 Landlord-Friendly · R+6
- County
- — inherits STATE
- City
- — inherits STATE
ZIP-level market 43812
- Active inventory
- 116
- Price-to-rent
- 10.8×
Monthly cashflow live
- Estimated rent
- $1,941 medium interval (Pro) →
- Mortgage (P&I)
- −$660
- Tax from tax record
- −$100 /mo · $1,195/yr
- Insurance
- −$52
- HOA
- −$0
- Vacancy / Maint / Mgmt
- −$408
- Net cashflow
- $721
Break-even live
Sensitivity live
| Price | -10% $792 | -5% $757 | +0% $721 | +5% $685 | +10% $650 |
|---|---|---|---|---|---|
| Rent | -10% $568 | -5% $644 | +0% $721 | +5% $798 | +10% $874 |
| Rate | -1.0pp $785 | -0.5pp $753 | base $721 | +0.5pp $689 | +1.0pp $655 |
2-unit breakdown (identical units grouped — click to expand)
| Units | Beds | Baths | Est. rent |
|---|---|---|---|
| 2× units | 2 | 1 | $1,942 |
| #1 | 2 | 1 | $971 |
| #2 | 2 | 1 | $971 |
| Total (2 units) | $1,941 | ||
UW: 25.0% down · 7.5% · 30yr · 1.5% tax · 5.0% vac · 8.0% maint · 8.0% mgmt
Financing live
Cash to close
- Down payment
- $31,475
- Closing costs
- $3,777
- Reserves months
- —
- Total cash needed
- —
Loan-product check · same deal, 3 products live
Conventional
25% down · 7.5% · 30yr
- Down + closing
- —
- Monthly P&I
- —
- Monthly cashflow
- —
- DSCR
- —
- Eligible?
- —
Personal DTI + credit; lowest rate.
DSCR
20% down · 8.5% · 30yr
- Down + closing
- —
- Monthly P&I
- —
- Monthly cashflow
- —
- DSCR
- —
- Eligible?
- —
No personal income docs; deal must DSCR.
Hard money
10% down · 12.0% · 12mo
- Down + closing
- —
- Monthly P&I
- —
- Monthly cashflow
- —
- DSCR
- —
- Eligible?
- —
Short-term bridge; refi at stabilization.
Listing history 22 events
-
2026-06-18days on market $125,900 Active 31 DOM
-
2026-06-17days on market $125,900 Active 30 DOM
-
2026-06-16days on market $125,900 Active 29 DOM
-
2026-06-15days on market $125,900 Active 28 DOM
-
2026-06-13days on market $125,900 Active 26 DOM
-
2026-06-12days on market $125,900 Active 25 DOM
-
2026-06-09days on market $125,900 Active 22 DOM
-
2026-06-08days on market $125,900 Active 21 DOM
-
2026-06-08days on market $125,900 Active 20 DOM
-
2026-06-07days on market $125,900 Active 19 DOM
-
2026-06-04days on market $125,900 Active 16 DOM
-
2026-06-02days on market $125,900 Active 15 DOM
-
2026-06-01days on market $125,900 Active 14 DOM
-
2026-05-31days on market $125,900 Active 13 DOM
-
2026-05-18$125,900 Active
-
2010-10-21historical
-
2009-10-20$49,900
-
2009-09-24historical
-
2009-06-24$49,900
-
2003-07-31soldstatus $450,000
-
2002-03-26soldstatus $65,500
-
1999-03-29soldstatus $125,000
ⓘ Source: listings_history table (triggers on properties + properties_extension) + one-shot
backfill from property_details.listing_events for pre-trigger history.
Tax reassessment forecast OH · Partial reset (capped growth)
- Current annual tax
- $1,195 · $100/mo
- Projected year-2 tax
- $1,579 · $132/mo
- Expected delta
- +$385/yr (+$32/mo · 32.2%)
ⓘ Screening estimate from a state-policy table — verify with the county assessor before closing.
Climate risk First Street
- Flood 1/10 Low FEMA zone X (unshaded) · 0% chance over 30 yrs
- Wildfire 1/10 Low
- Heat 4/10 Moderate 7 d/yr ≥98°F today · 18 d/yr by 30 yrs out
- Wind 2/10 Low 0% chance of damaging wind over 30 yrs
- Air quality 2/10 Low 1 unhealthy d/yr today · 3 by 30 yrs out
Nearby sold comps map
Loading sold comps map…
Walkable amenities ~0.75 mi
Loading nearby amenities…
Taxation est. · year 1
- Rental income
- $23,292
- − Mortgage interest
- −$7,052
- − Property taxes
- −$1,195
- − Insurance
- −$630
- − Repairs & maintenance
- −$1,863
- − Management
- −$1,863
- − Depreciation
- −$3,663
- Taxable income
- $7,026
- Est. tax owed @ 24.0%
- −$1,686
- After-tax cash flow
- $6,967/yr
For passive investors: Depreciation is non-cash, so a rental often shows a tax loss while cash-flowing — sheltering income. Rental losses are passive: they offset passive income freely, and up to $25,000/yr can offset ordinary (W-2) income if you actively participate and your MAGI is under $100k (phasing out to $0 by $150k); unused losses carry forward. On sale, claimed depreciation is recaptured at up to 25%, and gains may owe capital-gains tax (a 1031 exchange can defer both). Figures are a year-1 estimate at your 24.0% rate — not tax advice; consult a CPA.
Schools (NCES district)
- District
- Coshocton City
- NCES district ID
- 3904382
- Math proficiency
- 39% ▼ -22.00%
- Reading proficiency
- 49% ▼ -10.00%
- Median HH income
- $33,758
- Composite
- 36.22/100
- National rank
- #4726
- State rank
- #518 of 656 in OH
Livability — Coshocton
- Score
- 69/100
- State rank
- #526
- US rank
- #8938
Category grades
Schools grade is shown separately in the Schools card above.
Census & demographics
- Census place
- Coshocton, OH
- County
- Coshocton · 37,075 people
- Population (ZIP)
- 18,716
- Household income
- $51,930
- Rent vs Own
- Severe rent burden
- 7.2
Population outlook (Coshocton County) Hauer SSP2
- Today (2025)
- 35,193 people
- By 2030
- 34,112 · -3.1%
- By 2040
- 31,670 · -10.0%
- By 2050
- 29,033 · -17.5%
- By 2075
- 22,827 · -35.1%
- By 2100
- 16,421 · -53.3%
Race, ethnicity, and origin ACS 2023
- Neighborhood character
- Predominantly White (93%)
- Race & ethnicity
- White 93% Two or more races 5%
- Common ancestry
- Iranian 2% Lithuanian 2% Slovak 2%
- Foreign-born
- 1%
- Languages at home
- 98% English-only · German/W. Germanic 1%
Political lean MEDSL · Coshocton
- 2024 margin
- Solid R (+52.2) · D 23.5% · R 75.7%
- 2008→2024 swing
- -46.4pp toward R · 2008: -5.8pp · 2024: -52.2pp
- All cycles
- 2024: R+52.2 2020: R+49.0 2016: R+43.3 2012: R+9.5 2008: R+5.8
Not yet ingested
- Civics
- —
Market trends
- HPI YoY
- ▼ -188.33%
- Current HPI
- 216.5142
- Rent YoY
- —
- Metro
- —
- State GDP YoY
- ▲ 1.98%
- F500 in state
- 48
Industry mix (Fortune 500 HQ in OH)
| Industry | F500 HQs | Revenue |
|---|---|---|
| Insurance | 3 | $145B |
|
||
| Industrial Machinery | 3 | $49B |
|
||
| Financial Services | 3 | $24B |
|
||
| Consumer Goods | 2 | $93B |
|
||
| Aerospace / Defense | 2 | $47B |
|
||
| Utilities | 2 | $33B |
|
||
Price history
+0.7% since first listed8 events — show timeline
- 2026-05-18 Listed $125,900 MLSNOW
- 2010-10-21 Listing Removed — MLSNOW
- 2009-10-20 Listed $49,900 MLSNOW
- 2009-09-24 Listing Removed — MLSNOW
- 2009-06-24 Listed $49,900 MLSNOW
- 2003-07-31 Sold (Public Records) $450,000 Public Records
- 2002-03-26 Sold (Public Records) $65,500 Public Records
- 1999-03-29 Sold (Public Records) $125,000 Public Records
Property tax history
-8.0%/yrLatest (2025): $1,195 · +8.8% YoY. Source: county tax records.
Cash-flow waterfall
monthlySold comps — $/sqft
last 12 mo · ≤1 miLoading sold comps…