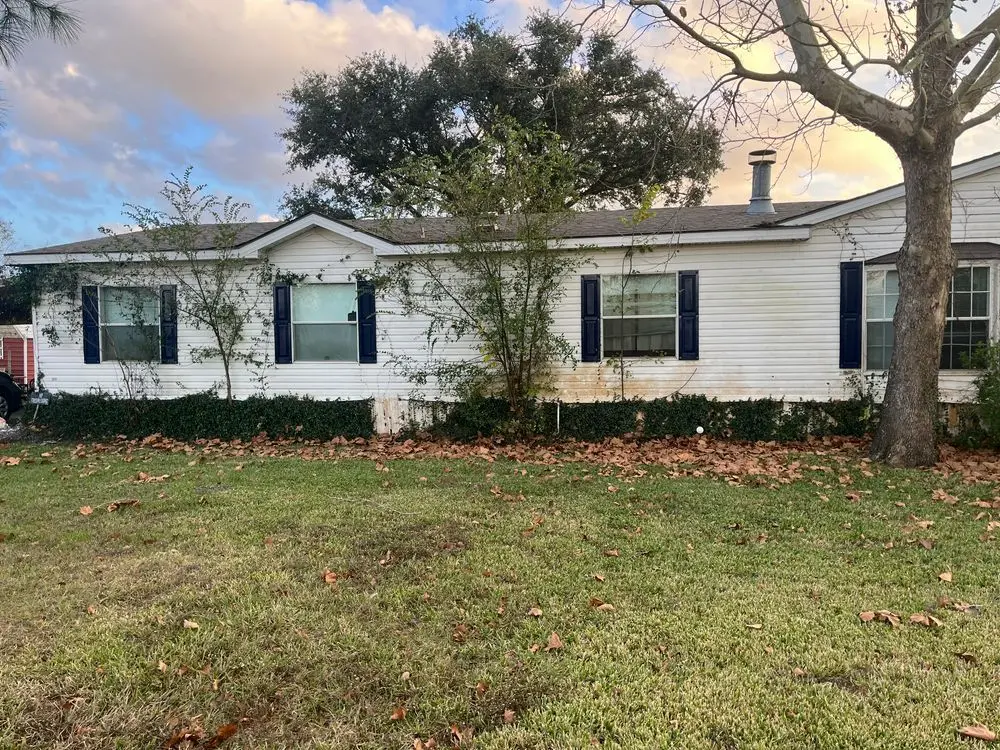
1506 Airline Ct · Rosharon, TX
Flood risk 6/10 · Moderate
- FEMA flood zone
- X (unshaded)
- Chance of flooding over 30 yrs
- 0.7%
- Est. flood insurance / yr
- $507 – $1,088
Fire risk 6/10 · Moderate
- Est. fire insurance / yr
- $1,222 – $2,270
Heat risk 9/10 · Severe
- Hot days now (above 109°F)
- 7 days/yr
- Hot days in 30 yrs
- 23 days/yr
Wind risk 9/10 · Severe
- Chance of severe wind over 30 yrs
- 99.0%
Air-quality risk 2/10 · Minimal
- Unhealthy air days now
- 1 days/yr
- Unhealthy air days in 30 yrs
- 1 days/yr
Risk factors via First Street. Map © Google.
Why this score? — see what drove the D grade
The composite is a weighted blend of 9 inputs, each scored 0–100. Each bar is that input's sub-score; the figure is the points it added to the 100-point composite (weight × sub-score).
- Cash flow +12.1/30.0
- ARV discount +10.3/15.0
- DSCR +3.6/10.0
- 1% rule +3.5/10.0
- Schools +3.5/10.0
- Livability +3.2/5.0
- Rent growth +2.6/5.0
- Condition / age +2.2/5.0
- Appreciation +0.0/10.0
$280,000
🖨 Deal sheet (PDF) 📄 Offer letter ✓ Due diligence
Listing remarks MLS
Well kept double wide with 4 bedrooms and 3 full baths. Sits on 1.66 acres. Has a in ground pool with a hot tub. Owner financing with 15% down. 1600 a month for two years then you will refinance it in your name
Key facts
- 1.66 acres
- Hot tub
- In ground pool
Tags
Neighborhood map
What this means for you Summary
Snapshot
- This is a 4-bed/3.0-bath single-family listed at $280k. Condition is rated fair.
Deal economics
- At list price, monthly cash flow is $-59 ($-712/yr) — negative.
- To cash-flow at today's rent, offer at most $271k (3.1% below list).
- To meet the 1% rule (rent ≥ 1% of price), the offer needs to be $237k (15.2% below list).
- Recommended offer: $237k (15.2% below list) — sets the bar for 1% rule.
Location & tenants
- Location reads 65/100 on livability (#701 in TX) — a middle-class / working-renter tenant base. Strengths: crime A+, cost of living A+, housing A+; Watch: amenities F, commute F, health & safety F.
- Angleton ISD (suburban): math 36% / reading 44% proficiency, ranked #375 of 826 in TX (top 45%) — families likely to look elsewhere, expect single-tenant / working-renter base with shorter leases.
- Zoned schools: Frontier El (math 66% / reading 58%, grade B, #321 of 4,322 statewide, top 8%, 445 students, 53% FRL); Angleton J H School (math 26% / reading 41%, grade F, #911 of 1,662 statewide, top 56%, 1,561 students, 68% FRL); Angleton H S (math 22% / reading 45%, grade F, #1,011 of 1,632 statewide, top 63%, 2,066 students, 67% FRL).
- Market conditions: Rents flat; 1148 active listings in the ZIP; high-income renter base; 3,960 units permitted in Brazoria County in 2024 (593 in 5+ unit buildings).
Forward outlook
- Local home prices are declining (-3.0%/yr); year-one equity from $2k of loan paydown is wiped out by about $8k of value loss. Plan a longer hold.
- Brazoria County population projected at +44% by 2050 — long-run rental-demand tailwind backs the buy-and-hold thesis.
Negotiation context
- It's been on market 204 days — a 12% lower offer ($246k) is reasonable based on typical stale-listing flexibility.
Risks & watch-outs
- Climate carrying-cost: major flood risk; severe wind risk, 99% chance of damaging wind over 30y; major wildfire risk; extreme-heat days projected 7→23/yr by 2055 (HVAC capex compounding) — expect insurance premiums to compound above CPI over the hold.
Questions for the listing agent
- What do current leases actually rent for vs. the listed asking? Can we see a recent rent roll and the last 12 months of T-12 income?
- It's been on market 204 days. Have you received any prior offers? Is the seller open to a 15% concession, seller financing, or rate buy-down credit?
- Have any recent inspections been done? Can we get a copy of the seller's disclosures and any deferred-maintenance estimates?
- Why hasn't it sold? Are there any deal-killer items the seller is aware of (foundation, flood, title, zoning, code violations)?
- Is there a deadline driving the sale (1031 exchange, divorce, estate, relocation)? That informs how much negotiation room exists.
- Schools are F-rated, which usually means shorter tenancies and higher turnover. Who's the typical renter profile here, and what's been the actual vacancy rate?
- The area grade is low — what's the realistic commute time and amenity access for the typical tenant pool here? Any planned neighborhood developments (good or bad) we should know about?
- What's the average days-on-market for RENTAL listings here right now (not sales)? A rising rental-DOM trend means longer vacancies and softer asking-rent achievability than the comps imply.
- What's the recent tenant-quality profile in this submarket — average credit score on applications, eviction rate, late-payment / NSF rate, and stable-employment percentage? A property-management company in the area should have these aggregated.
- How much new for-sale + rental construction is in the pipeline within 1–3 miles? Heavy new supply typically softens prices + rents 12–24 months out; constrained supply supports both.
Investment metrics
- 1% rule
- 0.85% ✗
- Cap rate
- 6.04%
- Cash-on-cash
- -0.91%
- DSCR
- 0.96
- GRM
- 9.8
CMA / ARV
- ARV (median comp)
- $298,430
- List price
- $280,000
- Delta
- -6.18%
- Verdict
- FAIR
- Comps
- 8 within 1.0 mi
Projected returns pro-forma
-3.0% appreciation · 0.44% rent growth · sell at horizon
- IRR
- -20.7%
- Equity multiple
- 0.30×
- Total profit
- $-55,077
- Equity at exit
- $41,749
- IRR
- -21.1%
- Equity multiple
- 0.03×
- Total profit
- $-75,926
- Equity at exit
- $24,209
Cash invested: $78,400 (down + closing). Projections, not guarantees.
Landlord ↔ Tenant lean methodology
- Overall (STATE)
- 87 Strongly Landlord-Friendly
- State Texas
- 87 Strongly Landlord-Friendly · R+5
- County
- — inherits STATE
- City
- — inherits STATE
ZIP-level market 77583
- Rents YoY
- 0.4%
- Active inventory
- 1148
- Price-to-rent
- 9.8×
Monthly cashflow live
- Estimated rent
- $2,374 medium interval (Pro) →
- Mortgage (P&I)
- −$1,468
- Tax est. 1.5%
- −$350 /mo · $4,200/yr
- Insurance
- −$117
- HOA
- −$0
- Vacancy / Maint / Mgmt
- −$499
- Net cashflow
- $-59
Break-even live
Sensitivity live
| Price | -10% $134 | -5% $37 | +0% $-59 | +5% $-156 | +10% $-253 |
|---|---|---|---|---|---|
| Rent | -10% $-247 | -5% $-153 | +0% $-59 | +5% $34 | +10% $128 |
| Rate | -1.0pp $82 | -0.5pp $12 | base $-59 | +0.5pp $-132 | +1.0pp $-206 |
UW: 25.0% down · 7.5% · 30yr · 1.5% tax · 5.0% vac · 8.0% maint · 8.0% mgmt
Financing live
Cash to close
- Down payment
- $70,000
- Closing costs
- $8,400
- Reserves months
- —
- Total cash needed
- —
Loan-product check · same deal, 3 products live
Conventional
25% down · 7.5% · 30yr
- Down + closing
- —
- Monthly P&I
- —
- Monthly cashflow
- —
- DSCR
- —
- Eligible?
- —
Personal DTI + credit; lowest rate.
DSCR
20% down · 8.5% · 30yr
- Down + closing
- —
- Monthly P&I
- —
- Monthly cashflow
- —
- DSCR
- —
- Eligible?
- —
No personal income docs; deal must DSCR.
Hard money
10% down · 12.0% · 12mo
- Down + closing
- —
- Monthly P&I
- —
- Monthly cashflow
- —
- DSCR
- —
- Eligible?
- —
Short-term bridge; refi at stabilization.
Listing history 15 events
-
2026-06-21days on market $280,000 Active 204 DOM
-
2026-06-18days on market $280,000 Active 201 DOM
-
2026-06-17days on market $280,000 Active 200 DOM
-
2026-06-16days on market $280,000 Active 199 DOM
-
2026-06-15days on market $280,000 Active 198 DOM
-
2026-06-13days on market $280,000 Active 196 DOM
-
2026-06-09days on market $280,000 Active 192 DOM
-
2026-06-08days on market $280,000 Active 191 DOM
-
2026-06-07days on market $280,000 Active 190 DOM
-
2026-06-04days on market $280,000 Active 187 DOM
-
2026-06-03days on market $280,000 Active 186 DOM
-
2026-06-02days on market $280,000 Active 185 DOM
-
2026-06-01days on market $280,000 Active 184 DOM
-
2026-05-31days on market $280,000 Active 183 DOM
-
2025-11-29$280,000 Active 211-char remark
Show marketing remark (211 chars)
Well kept double wide with 4 bedrooms and 3 full baths. Sits on 1.66 acres. Has a in ground pool with a hot tub. Owner financing with 15% down. 1600 a month for two years then you will refinance it in your name
ⓘ Source: listings_history table (triggers on properties + properties_extension) + one-shot
backfill from property_details.listing_events for pre-trigger history.
Climate risk First Street
- Flood 6/10 Major FEMA zone X (unshaded) · 70% chance over 30 yrs
- Wildfire 6/10 Major
- Heat 9/10 Extreme 7 d/yr ≥109°F today · 23 d/yr by 30 yrs out
- Wind 9/10 Extreme 99% chance of damaging wind over 30 yrs
- Air quality 2/10 Low 1 unhealthy d/yr today · 1 by 30 yrs out
Nearby sold comps map
Loading sold comps map…
Walkable amenities ~0.75 mi
Loading nearby amenities…
Taxation est. · year 1
- Rental income
- $28,492
- − Mortgage interest
- −$15,684
- − Property taxes
- −$4,200
- − Insurance
- −$1,400
- − Repairs & maintenance
- −$2,279
- − Management
- −$2,279
- − Depreciation
- −$8,145
- Taxable loss
- −$5,497
- Est. tax savings @ 24.0%
- +$1,319
- After-tax cash flow
- $607/yr
For passive investors: Depreciation is non-cash, so a rental often shows a tax loss while cash-flowing — sheltering income. Rental losses are passive: they offset passive income freely, and up to $25,000/yr can offset ordinary (W-2) income if you actively participate and your MAGI is under $100k (phasing out to $0 by $150k); unused losses carry forward. On sale, claimed depreciation is recaptured at up to 25%, and gains may owe capital-gains tax (a 1031 exchange can defer both). Figures are a year-1 estimate at your 24.0% rate — not tax advice; consult a CPA.
Condition & rehab AI · 12 photos
This property requires significant repairs and maintenance to improve its condition and value. The exterior and interior need fresh paint, new carpet, and updated kitchen and bathroom fixtures. Landscaping and pool maintenance will also enhance the property's curb appeal and functionality.
Repairs flagged
- Major siding — Significant wear and tear
- Major interior walls — Visible wear and tear
- Major kitchen cabinets — Outdated and worn-out
- Major bathroom fixtures — Visible wear and tear
- Major flooring — Worn-out carpet
- Major landscaping — Overgrown and debris
Value-add opportunities
- Resale Paint interior walls — Fresh paint enhances curb appeal
- Resale Replace carpet — Fresh carpet improves comfort and appearance
- Resale Replace kitchen cabinets — Fresh cabinets improve functionality and aesthetics
- Resale Replace bathroom fixtures — Fresh fixtures improve functionality and aesthetics
- Both Landscaping and pool maintenance — Enhances curb appeal and functionality
Renovation cost estimate screening
| Repair item | Severity | Est. cost |
|---|---|---|
| siding · Significant wear and tear | Major | $15,000–50,000 |
| interior walls · Visible wear and tear | Major | $15,000–50,000 |
| kitchen cabinets · Outdated and worn-out | Major | $15,000–50,000 |
| bathroom fixtures · Visible wear and tear | Major | $15,000–50,000 |
| flooring · Worn-out carpet | Major | $15,000–50,000 |
| landscaping · Overgrown and debris | Major | $15,000–50,000 |
| Total estimated repair cost · 6 items | $90,000–300,000 |
Value-add ROI direction
- Resale Paint interior walls — Fresh paint enhances curb appeal ↑
- Resale Replace carpet — Fresh carpet improves comfort and appearance ↑
- Resale Replace kitchen cabinets — Fresh cabinets improve functionality and aesthetics ↑
- Resale Replace bathroom fixtures — Fresh fixtures improve functionality and aesthetics ↑
- Both Landscaping and pool maintenance — Enhances curb appeal and functionality ↑
ⓘ Cost ranges are severity-bucket heuristics (US national rule-of-thumb). Get contractor quotes + a written scope before underwriting a rehab budget.
Schools (NCES district)
- District
- Angleton ISD
- NCES district ID
- 4808310
- Math proficiency
- 36% ▼ -8.00%
- Reading proficiency
- 44% ▲ 1.00%
- Median HH income
- $55,670
- Composite
- 35.01/100
- National rank
- #5046
- State rank
- #375 of 826 in TX
Livability — Rosharon
- Score
- 65/100
- State rank
- #701
- US rank
- #13120
Category grades
Schools grade is shown separately in the Schools card above.
Census & demographics
- Census place
- Rosharon, TX
- County
- Brazoria County · 374,982 people
- Metro
- Houston-The Woodlands-Sugar Land, TX
- Population (ZIP)
- 52,747
- Household income
- $119,287
- Rent vs Own
- Severe rent burden
- 251.0
Population outlook (Brazoria County) Hauer SSP2
- Today (2025)
- 420,414 people
- By 2030
- 457,585 · +8.8%
- By 2040
- 532,232 · +26.6%
- By 2050
- 605,399 · +44.0%
- By 2075
- 779,358 · +85.4%
- By 2100
- 883,759 · +110.2%
Race, ethnicity, and origin ACS 2023
- Neighborhood character
- Highly diverse neighborhood (Simpson 0.70)
- Race & ethnicity
- Hispanic / Latino 38% Black 34% White 20% Two or more races 18% Asian 5%
- Hispanic origin (detail)
- Mexican 31% Puerto Rican 2%
- Common ancestry
- Lithuanian 1% Slovak 1% Romanian 1%
- Foreign-born
- 16% · Canada, Vietnam, China
- Languages at home
- 64% English-only · Spanish 28% Other Asian/Pacific 2% Vietnamese 1%
Political lean MEDSL · Brazoria
- 2024 margin
- R (+19.7) · D 39.5% · R 59.2% · Other 1.3%
- 2008→2024 swing
- +9.9pp toward D · 2008: -29.6pp · 2024: -19.7pp
- All cycles
- 2024: R+19.7 2020: R+18.2 2016: R+24.6 2012: R+34.2 2008: R+29.6
Not yet ingested
- Civics
- —
Market trends
- HPI YoY
- ▼ -120.19%
- Current HPI
- 198.6559
- Rent YoY
- ▲ 0.44%
- Metro
- Houston-The Woodlands-Sugar Land, TX
- State GDP YoY
- ▲ 3.95%
- F500 in state
- 110
Industry mix (Fortune 500 HQ in TX)
| Industry | F500 HQs | Revenue |
|---|---|---|
| Energy | 16 | $1,198B |
|
||
| Technology | 5 | $198B |
|
||
| Engineering / Construction | 4 | $72B |
|
||
| Energy Services | 3 | $60B |
|
||
| Utilities | 3 | $41B |
|
||
| Healthcare | 2 | $330B |
|
||
Price history
1 event — show timeline
- 2025-11-29 Listed $280,000 ForSaleByOwner.com
Cash-flow waterfall
monthlySold comps — $/sqft
last 12 mo · ≤1 miLoading sold comps…