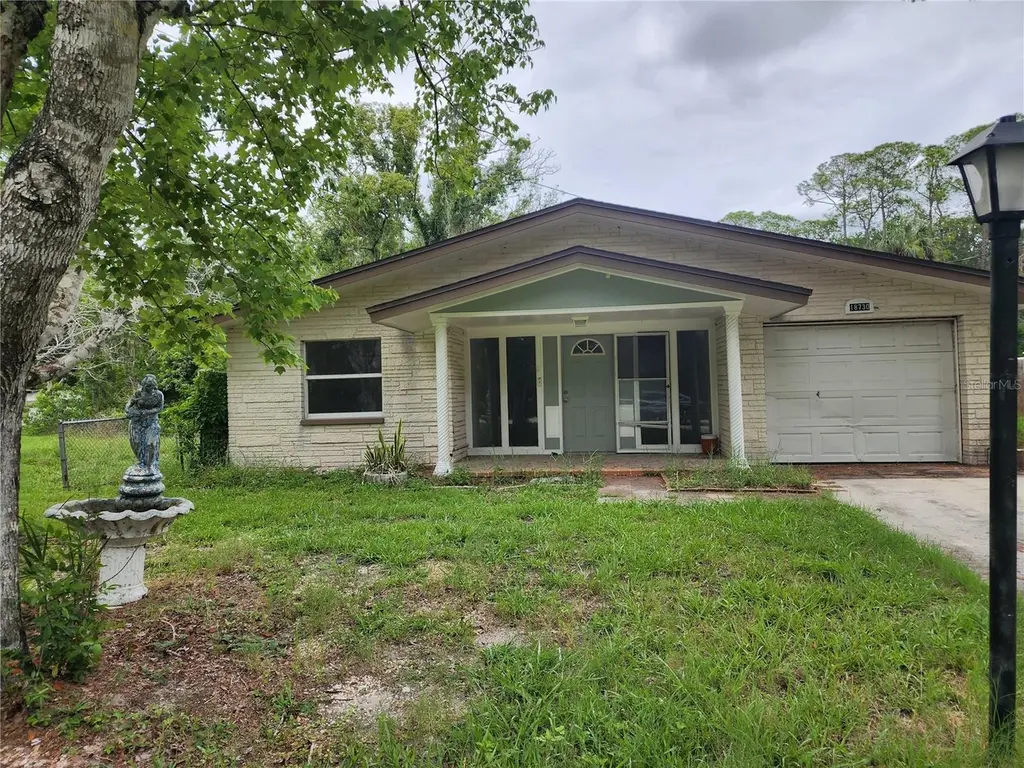
18730 Rosemary Rd · Aripeka, FL
Flood risk 10/10 · Severe
- FEMA flood zone
- AE
- Chance of flooding over 30 yrs
- 0.99%
- Est. flood insurance / yr
- $1,737 – $8,500
Fire risk 3/10 · Minor
- Est. fire insurance / yr
- $947 – $1,759
Heat risk 10/10 · Severe
- Hot days now (above 110°F)
- 7 days/yr
- Hot days in 30 yrs
- 23 days/yr
Wind risk 10/10 · Severe
- Chance of severe wind over 30 yrs
- 99.0%
Air-quality risk 2/10 · Minimal
- Unhealthy air days now
- 2 days/yr
- Unhealthy air days in 30 yrs
- 2 days/yr
Risk factors via First Street. Map © Google.
Why this score? — see what drove the B- grade
The composite is a weighted blend of 9 inputs, each scored 0–100. Each bar is that input's sub-score; the figure is the points it added to the 100-point composite (weight × sub-score).
- Cash flow +30.0/30.0
- 1% rule +10.0/10.0
- DSCR +10.0/10.0
- ARV discount +7.5/15.0
- Schools +4.3/10.0
- Livability +2.9/5.0
- Condition / age +2.5/5.0
- Rent growth +1.9/5.0
- Appreciation +0.0/10.0
$120,000
🖨 Deal sheet (PDF) 📄 Offer letter ✓ Due diligence
Listing remarks
Under contract-accepting backup offers. CASH ONLY! ATTENTION INVESTORS!! Welcome to this 3-bedroom, 2-bath block home offering 1,252 square feet of living space in the charming coastal community of Aripeka. Following the 2024 storm, several improvements have been made, creating a great opportunity for buyers looking to enjoy Florida's Nature Coast lifestyle. Located less than a half mile from Gulf access, this property offers convenient access to boating, fishing, kayaking, and some of Florida's most beautiful sunsets. Aripeka is a hidden gem surrounded by natural beauty, coastal wildlife, and the serene waters of the Gulf Coast. Buyer(s) is responsible for verifying all information deemed
Key facts
- Boating
- Serene waters
- Gulf access
Tags
Property features AI
Finance
- Other: Has additional parcel(s); Zoned AR
- HOA & community: No association
Exterior
- Parking: Attached garage (1 car)
- Utilities: Public water; Septic tank sewer; Electricity available; Broadband/high-speed internet available
- Home design: Single family residence; Residential property; One story; Faces west; Fixer condition; Entry level: One
- Construction: Block, concrete and stucco construction; Shingle roof; Slab foundation; Built on lot of about 0.19 acres
- Exterior features: Sliding doors; Limerock road access
Interior
- Kitchen: No appliances listed
- Bedrooms: 3 bedrooms
- Flooring: Laminate flooring
- Bathrooms: 2 full bathrooms
- Heating & cooling: No heating; No cooling
- Interior features: Open floor plan
- Laundry & utility: Laundry inside
Neighborhood map
What this means for you Summary
Snapshot
- This is a 3-bed/2.0-bath single-family listed at $120k.
Deal economics
- At list price, monthly cash flow is $517 ($6k/yr) — positive.
- The deal already cash-flows at list — no discount required.
- Meets the 1% rule at list price ($2k rent vs $120k).
Location & tenants
- Location reads 57/100 on livability (#850 in FL) — a working-class tenant base; expect higher turnover. Strengths: cost of living A+, housing A+, crime A; Watch: health & safety C-, amenities F, commute F.
- Pasco (suburban): math 50% / reading 52% proficiency, ranked #32 of 73 in FL (top 44%) — acceptable for families but not a draw, mixed tenant base, ~2y average lease.
- Zoned schools: Shady Hills Elementary School (math 48% / reading 45%, grade D-, #1,223 of 2,144 statewide, top 57%, 471 students, 77% FRL); Crews Lake Middle School. (math 47% / reading 39%, grade D-, #331 of 571 statewide, top 59%, 834 students, 67% FRL) — zoned schools average 72% FRL vs 48% district-wide (24 pts higher); higher-poverty schools than district average — tighter screening recommended.
- Market conditions: Rents soft (-2.3%/yr); 800 active listings in the ZIP; 2 comparable units currently listed for rent nearby; 6,765 units permitted in Pasco County in 2024 (1,250 in 5+ unit buildings).
- At $2,259/mo this rent would consume 53% of the median local household income ($51k/yr) (locally 946% of renters already pay >50% of income on rent) — very limited rent-growth headroom before tenants either downsize or default.
Forward outlook
- Local home prices are declining (-3.0%/yr); year-one equity from $830 of loan paydown is wiped out by about $4k of value loss. Plan a longer hold.
- Pasco County population projected at +29% by 2050 — long-run rental-demand tailwind backs the buy-and-hold thesis.
Negotiation context
- Only 3 days on market — expect competitive offers; lowballing is unlikely to land.
- 6 sale attempts since 13y ago with the ask held roughly flat each time — persistent listings suggest the price (not the market) is what's stuck; bring a comps-based counter.
- Current owner paid $48k; list at $120k implies a 150% gain — meaningful room to come down on a strong offer.
Risks & watch-outs
- Watch-outs: flood insurance adds $427/mo.
- Climate carrying-cost: in FEMA flood zone AE (mandatory federal flood insurance); severe wind risk, 99% chance of damaging wind over 30y; extreme-heat days projected 7→23/yr by 2055 (HVAC capex compounding) — expect insurance premiums to compound above CPI over the hold.
Questions for the listing agent
- Built in 1969 — when were the roof, HVAC, electrical panel, plumbing, and water heater last replaced?
- What's the actual annual flood-insurance premium (NFIP or private), and is the property in a SFHA with mandatory coverage?
- Is there a deadline driving the sale (1031 exchange, divorce, estate, relocation)? That informs how much negotiation room exists.
- Schools are F-rated, which usually means shorter tenancies and higher turnover. Who's the typical renter profile here, and what's been the actual vacancy rate?
- What's the average days-on-market for RENTAL listings here right now (not sales)? A rising rental-DOM trend means longer vacancies and softer asking-rent achievability than the comps imply.
- What's the recent tenant-quality profile in this submarket — average credit score on applications, eviction rate, late-payment / NSF rate, and stable-employment percentage? A property-management company in the area should have these aggregated.
- How much new for-sale + rental construction is in the pipeline within 1–3 miles? Heavy new supply typically softens prices + rents 12–24 months out; constrained supply supports both.
Investment metrics
- 1% rule
- 1.88% ✓
- Cap rate
- 15.72%
- Cash-on-cash
- 33.68%
- DSCR
- 2.50
- GRM
- 4.4
CMA / ARV
No comps found within radius.
Projected returns pro-forma
-3.0% appreciation · 0.0% rent growth · sell at horizon
- IRR
- 5.7%
- Equity multiple
- 1.21×
- Total profit
- $7,139
- Equity at exit
- $17,892
- IRR
- 11.2%
- Equity multiple
- 1.72×
- Total profit
- $24,233
- Equity at exit
- $10,375
Cash invested: $33,600 (down + closing). Projections, not guarantees.
Landlord ↔ Tenant lean methodology
- Overall (STATE)
- 87 Strongly Landlord-Friendly
- State Florida
- 87 Strongly Landlord-Friendly · R+3
- County
- — inherits STATE
- City
- — inherits STATE
ZIP-level market 34667
- Rents YoY
- -2.3%
- Active inventory
- 800
- Price-to-rent
- 4.4×
Monthly cashflow live
- Estimated rent
- $2,259 medium interval (Pro) →
- Mortgage (P&I)
- −$629
- Tax from tax record
- −$162 /mo · $1,942/yr
- Insurance
- −$50
- Flood insurance flood zone
- −$427 /mo · $5,118/yr
- HOA
- −$0
- Vacancy / Maint / Mgmt
- −$474
- Net cashflow
- $517
Break-even live
Sensitivity live
| Price | -10% $584 | -5% $551 | +0% $517 | +5% $483 | +10% $449 |
|---|---|---|---|---|---|
| Rent | -10% $338 | -5% $427 | +0% $517 | +5% $606 | +10% $695 |
| Rate | -1.0pp $577 | -0.5pp $547 | base $517 | +0.5pp $485 | +1.0pp $454 |
UW: 25.0% down · 7.5% · 30yr · 1.5% tax · 5.0% vac · 8.0% maint · 8.0% mgmt
Financing live
Cash to close
- Down payment
- $30,000
- Closing costs
- $3,600
- Reserves months
- —
- Total cash needed
- —
Loan-product check · same deal, 3 products live
Conventional
25% down · 7.5% · 30yr
- Down + closing
- —
- Monthly P&I
- —
- Monthly cashflow
- —
- DSCR
- —
- Eligible?
- —
Personal DTI + credit; lowest rate.
DSCR
20% down · 8.5% · 30yr
- Down + closing
- —
- Monthly P&I
- —
- Monthly cashflow
- —
- DSCR
- —
- Eligible?
- —
No personal income docs; deal must DSCR.
Hard money
10% down · 12.0% · 12mo
- Down + closing
- —
- Monthly P&I
- —
- Monthly cashflow
- —
- DSCR
- —
- Eligible?
- —
Short-term bridge; refi at stabilization.
Rent comps 2 comps
| Address | Beds | Baths | Sqft | Rent | $/sqft | DOM | Units | Dist |
|---|---|---|---|---|---|---|---|---|
| 10114 Briar Cir Hudson, FL | 3.0 | 2.0 | 1525 | $2,000 | $1.31 | 26d | 1 | 0.93mi |
| 18802 Whiterock Ln Hudson, FL | 3.0 | 2.0 | 1526 | $1,995 | $1.31 | 6d | 1 | 1.03mi |
Listing history 5 events
-
2026-06-10status $120,000 Pending 3 DOM
-
2026-06-09days on market $120,000 Active 3 DOM
-
2026-06-08days on market $120,000 Active 2 DOM
-
2026-06-07remarks 699-char remark
-
2026-06-07$120,000 Active 1 DOM
ⓘ Source: listings_history table (triggers on properties + properties_extension) + one-shot
backfill from property_details.listing_events for pre-trigger history.
Tax reassessment forecast FL · Resets to sale price
- Current annual tax
- $1,942 · $162/mo
- Projected year-2 tax
- $1,942 · $162/mo
- Expected delta
- $0/yr ($0/mo · 0.0%)
ⓘ Screening estimate from a state-policy table — verify with the county assessor before closing.
Climate risk First Street
- Flood 10/10 Extreme FEMA zone AE · 99% chance over 30 yrs
- Wildfire 3/10 Moderate
- Heat 10/10 Extreme 7 d/yr ≥110°F today · 23 d/yr by 30 yrs out
- Wind 10/10 Extreme 99% chance of damaging wind over 30 yrs
- Air quality 2/10 Low 2 unhealthy d/yr today · 2 by 30 yrs out
Nearby sold comps map
Loading sold comps map…
Walkable amenities ~0.75 mi
Loading nearby amenities…
Taxation est. · year 1
- Rental income
- $27,102
- − Mortgage interest
- −$6,722
- − Property taxes
- −$1,942
- − Insurance
- −$5,718
- − Repairs & maintenance
- −$2,168
- − Management
- −$2,168
- − Depreciation
- −$3,491
- Taxable income
- $4,892
- Est. tax owed @ 24.0%
- −$1,174
- After-tax cash flow
- $5,024/yr
For passive investors: Depreciation is non-cash, so a rental often shows a tax loss while cash-flowing — sheltering income. Rental losses are passive: they offset passive income freely, and up to $25,000/yr can offset ordinary (W-2) income if you actively participate and your MAGI is under $100k (phasing out to $0 by $150k); unused losses carry forward. On sale, claimed depreciation is recaptured at up to 25%, and gains may owe capital-gains tax (a 1031 exchange can defer both). Figures are a year-1 estimate at your 24.0% rate — not tax advice; consult a CPA.
Schools (NCES district)
- District
- Pasco
- NCES district ID
- 1201530
- Math proficiency
- 50% ▼ -10.00%
- Reading proficiency
- 52% ▼ -5.00%
- Median HH income
- $45,039
- Composite
- 43.14/100
- National rank
- #3074
- State rank
- #32 of 73 in FL
Livability — Aripeka
- Score
- 57/100
- State rank
- #850
- US rank
- #21736
Category grades
Schools grade is shown separately in the Schools card above.
Census & demographics
- Census place
- Aripeka, FL
- County
- Pasco County · 524,098 people
- Metro
- Tampa-St. Petersburg-Clearwater, FL
- Population (ZIP)
- 30,689
- Household income
- $51,280
- Rent vs Own
- Severe rent burden
- 946.0
Population outlook (Pasco County) Hauer SSP2
- Today (2025)
- 570,045 people
- By 2030
- 605,844 · +6.3%
- By 2040
- 674,806 · +18.4%
- By 2050
- 736,022 · +29.1%
- By 2075
- 862,900 · +51.4%
- By 2100
- 906,364 · +59.0%
Race, ethnicity, and origin ACS 2023
- Neighborhood character
- Predominantly White (86%)
- Race & ethnicity
- White 86% Hispanic / Latino 7% Two or more races 6% Black 2% Asian 2%
- Hispanic origin (detail)
- Mexican 1% Puerto Rican 2%
- Common ancestry
- Romanian 4% Lithuanian 3% Slovak 2%
- Foreign-born
- 7% · Canada, Jamaica, Vietnam
- Languages at home
- 91% English-only · Spanish 5% Other Indo-European 2% French/Haitian/Cajun 0%
Political lean MEDSL · Pasco
- 2024 margin
- Strong R (+25.2) · D 36.9% · R 62.1% · Other 1.0%
- 2008→2024 swing
- -21.6pp toward R · 2008: -3.6pp · 2024: -25.2pp
- All cycles
- 2024: R+25.2 2020: R+20.1 2016: R+21.6 2012: R+6.7 2008: R+3.6
Not yet ingested
- Civics
- —
Market trends
- HPI YoY
- ▼ -183.96%
- Current HPI
- 307.5552
- Rent YoY
- ▼ -2.26%
- Metro
- Tampa-St. Petersburg-Clearwater, FL
- State GDP YoY
- ▲ 3.28%
- F500 in state
- 36
Industry mix (Fortune 500 HQ in FL)
| Industry | F500 HQs | Revenue |
|---|---|---|
| Industrial Technology | 2 | $29B |
|
||
| Insurance | 2 | $17B |
|
||
| Retail | 1 | $60B |
|
||
| Technology Distribution | 1 | $58B |
|
||
| Homebuilding | 1 | $35B |
|
||
| Technology Manufacturing | 1 | $35B |
|
||
Price history
+84.6% since first listed13 events — show timeline
- 2026-06-06 Listed $120,000 Stellar MLS as Distributed by MLS Grid
- 2025-02-20 Listing Removed — Stellar MLS as Distributed by MLS Grid
- 2025-02-02 Relisted — Stellar MLS as Distributed by MLS Grid
- 2025-02-02 Price Changed $148,000 Stellar MLS as Distributed by MLS Grid
- 2024-12-12 Price Changed $169,500 Stellar MLS as Distributed by MLS Grid
- 2024-10-22 Listed $180,000 Stellar MLS as Distributed by MLS Grid
- 2020-09-30 Listing Removed — HCAR
- 2015-04-20 Sold (Public Records) $48,000 Public Records
- 2014-07-01 Listing Removed — Stellar MLS as Distributed by MLS Grid
- 2014-06-14 Relisted — Stellar MLS as Distributed by MLS Grid
- 2014-06-10 Listing Removed — Stellar MLS as Distributed by MLS Grid
- 2013-12-30 Listed $65,000 HCAR
- 2013-12-30 Listed $65,000 Stellar MLS as Distributed by MLS Grid
Property tax history
+4.4%/yrLatest (2025): $1,942 · +4.2% YoY. Source: county tax records.
Cash-flow waterfall
monthlySold comps — $/sqft
last 12 mo · ≤1 miLoading sold comps…