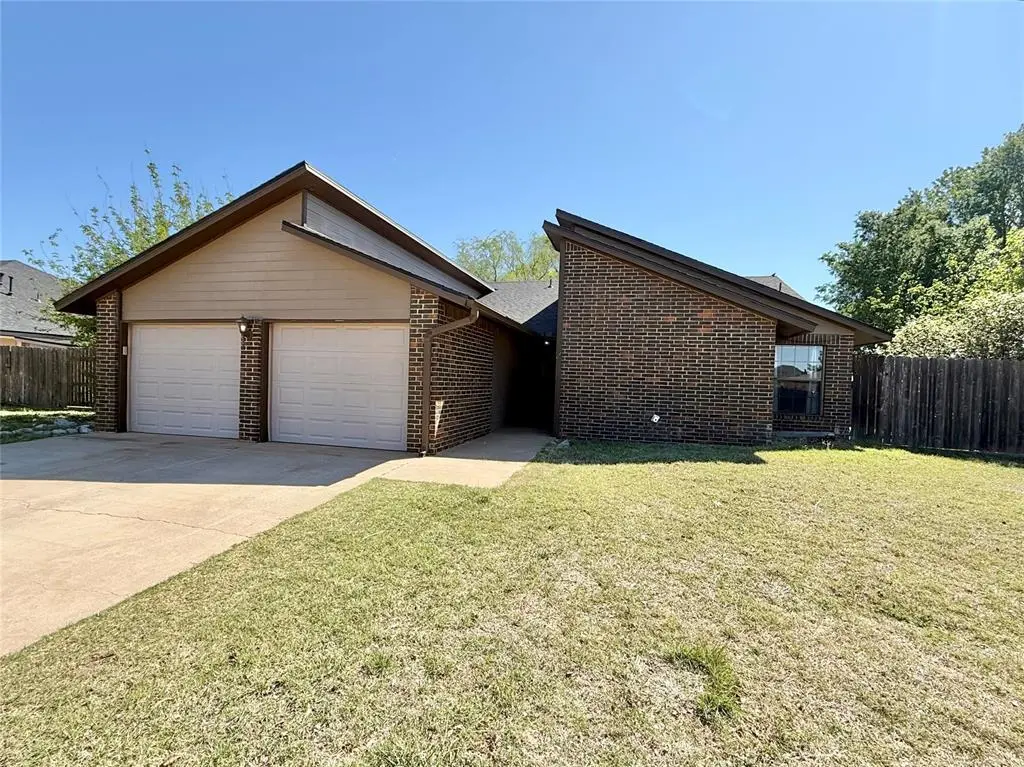
3512 Kings Way · Altus, OK
Flood risk 1/10 · Minimal
- FEMA flood zone
- X (unshaded)
- Chance of flooding over 30 yrs
- 0.0%
- Est. flood insurance / yr
- $507 – $1,088
Fire risk 1/10 · Minimal
- Est. fire insurance / yr
- $2,463 – $4,575
Heat risk 6/10 · Moderate
- Hot days now (above 108°F)
- 7 days/yr
- Hot days in 30 yrs
- 20 days/yr
Wind risk 3/10 · Minor
- Chance of severe wind over 30 yrs
- 5.0%
Air-quality risk 1/10 · Minimal
- Unhealthy air days now
- 0 days/yr
- Unhealthy air days in 30 yrs
- 0 days/yr
Risk factors via First Street. Map © Google.
Why this score? — see what drove the D+ grade
The composite is a weighted blend of 9 inputs, each scored 0–100. Each bar is that input's sub-score; the figure is the points it added to the 100-point composite (weight × sub-score).
- Cash flow +15.0/30.0
- ARV discount +15.0/15.0
- DSCR +4.6/10.0
- 1% rule +3.7/10.0
- Livability +3.2/5.0
- Rent growth +2.5/5.0
- Schools +2.5/10.0
- Condition / age +2.5/5.0
- Appreciation +0.0/10.0
$155,000
🖨 Deal sheet (PDF) 📄 Offer letter ✓ Due diligence
Listing remarks MLS
Nice home with fresh interior painted walls. Three bedrooms with two baths, All new carpet just installed, Home is move in ready located on cul-de-sac. Lots of cabinets with a nice gas cookstove, stainless dishwasher. Bathrooms have been updated with neutral tile. Great closet space & very large walk in pantry. Large family room with fireplace. Home has ceiling fans, & some blinds. Can lighting in family room, Roof is about 5 years old. Large covered patio, wood privacy fenced backyard. Some nice mature trees in backyard. Small atrium room with new patio doors to our doors. Move in ready!
Key facts
- 0.27 acre lot
- 2 garage spots
- Built 1986
Neighborhood map
What this means for you Summary
Snapshot
- This is a 4-bed/2.0-bath single-family listed at $155k.
Deal economics
- At list price, monthly cash flow is $49 ($592/yr) — positive.
- The deal already cash-flows at list — no discount required.
- To meet the 1% rule (rent ≥ 1% of price), the offer needs to be $136k (12.5% below list).
- Recommended offer: $136k (12.5% below list) — sets the bar for 1% rule.
- Cap rate 6.7% vs local median 3.7% in Altus — top-decile yield for the area; either an underpriced asset or a hidden risk that comps aren't pricing in. Stress-test before assuming the spread holds.
Location & tenants
- Location reads 65/100 on livability (#151 in OK) — a middle-class / working-renter tenant base. Strengths: cost of living A+, housing A+; Watch: employment C-, amenities F, commute F.
- Altus (town): math 31% / reading 28% proficiency, ranked #69 of 270 in OK (top 26%) — low school quality limits family demand, transient renter base, plan for 1-2y turnover.
- Zoned schools: Altus Early Childhood Center (390 students, 0% FRL); Altus Jhs (math 30% / reading 27%, grade F, #57 of 345 statewide, top 18%, 491 students, 0% FRL); Altus Hs (math 21% / reading 26%, grade F, #218 of 447 statewide, top 49%, 921 students, 0% FRL) — zoned schools average 0% FRL vs 55% district-wide (55 pts lower); this property's tenant base skews higher-income than the district average.
- Market conditions: 168 active listings in the ZIP; 8 units permitted in Jackson County in 2024 (0 in 5+ unit buildings).
Forward outlook
- Local home prices are declining (-3.0%/yr); year-one equity from $1k of loan paydown is wiped out by about $5k of value loss. Plan a longer hold.
- Jackson County population projected to shrink 6% by 2050 — rents likely to lag national; underwrite the cash flow, not the appreciation.
Negotiation context
- Only 5 days on market — expect competitive offers; lowballing is unlikely to land.
- 2 sale attempts since 8y ago; this cycle's ask has dropped $15k (9%) from the opening price — seller is motivated, your offer sets the floor, not the list.
Risks & watch-outs
- Climate carrying-cost: extreme-heat days projected 7→20/yr by 2055 (HVAC capex compounding) — expect insurance premiums to compound above CPI over the hold.
Questions for the listing agent
- Is there a deadline driving the sale (1031 exchange, divorce, estate, relocation)? That informs how much negotiation room exists.
- Schools are D-rated, which usually means shorter tenancies and higher turnover. Who's the typical renter profile here, and what's been the actual vacancy rate?
- The area grade is low — what's the realistic commute time and amenity access for the typical tenant pool here? Any planned neighborhood developments (good or bad) we should know about?
- What's the average days-on-market for RENTAL listings here right now (not sales)? A rising rental-DOM trend means longer vacancies and softer asking-rent achievability than the comps imply.
- What's the recent tenant-quality profile in this submarket — average credit score on applications, eviction rate, late-payment / NSF rate, and stable-employment percentage? A property-management company in the area should have these aggregated.
- How much new for-sale + rental construction is in the pipeline within 1–3 miles? Heavy new supply typically softens prices + rents 12–24 months out; constrained supply supports both.
Investment metrics
- 1% rule
- 0.87% ✗
- Cap rate
- 6.67%
- Cash-on-cash
- 1.36%
- DSCR
- 1.06
- GRM
- 9.5
CMA / ARV
- ARV (on-the-fly)
- $281,656
- Comps found
- 12
Show comp detail 12 sales within ~0.75 mi
| Address | Dist | Beds/Ba | Sqft | Sold | Price | $/sf | Match |
|---|---|---|---|---|---|---|---|
| 1101 Wendy Ln | 0.20mi | 3/2.0 (-1) | 1,823 (-2%) | 2mo | $224,000 | $123 | 81 |
| 909 Isabella Ln | 0.29mi | 4/2.5 | 1,943 (+5%) | 2mo | $315,000 | $162 | 75 |
| 1117 Wendy Ln | 0.25mi | 3/2.0 (-1) | 1,732 (-6%) | 2mo | $263,000 | $152 | 71 |
| 2936 Laurel Cir | 0.42mi | 3/2.0 (-1) | 1,774 (-4%) | 2mo | $225,000 | $127 | 67 |
| 1108 Northridge Blvd | 0.41mi | 4/2.5 | 2,001 (+8%) | 1mo | $340,000 | $170 | 65 |
| 1209 Wendy Ln | 0.29mi | 3/2.0 (-1) | 1,696 (-8%) | 4mo | $230,000 | $136 | 64 |
| 901 Stephanie Ln | 0.21mi | 4/2.5 | 2,031 (+10%) | 10mo | $310,000 | $153 | 64 |
| 901 N Towne Cir | 0.49mi | 3/2.0 (-1) | 1,766 (-5%) | 1mo | $276,000 | $156 | 64 |
| 3100 Mallard Cir | 0.68mi | 3/2.0 (-1) | 1,935 (+4%) | 6mo | $265,000 | $137 | 51 |
| 3320 Continental Ct | 0.58mi | 4/2.0 | 2,094 (+13%) | 3mo | $350,000 | $167 | 48 |
| 1105 Ruth Rd | 0.51mi | 3/2.0 (-1) | 1,640 (-12%) | 9mo | $222,500 | $136 | 45 |
| 3217 Quail Cir | 0.65mi | 3/2.0 (-1) | 2,018 (+9%) | 9mo | $247,000 | $122 | 42 |
Match score weights: distance 35% · size 25% · config 20% · recency 20%. Top-matched comps best support the ARV.
Projected returns pro-forma
-3.0% appreciation · 3.0% rent growth · sell at horizon
- IRR
- -14.1%
- Equity multiple
- 0.49×
- Total profit
- $-21,986
- Equity at exit
- $23,111
- IRR
- -5.4%
- Equity multiple
- 0.65×
- Total profit
- $-15,140
- Equity at exit
- $13,402
Cash invested: $43,400 (down + closing). Projections, not guarantees.
Landlord ↔ Tenant lean methodology
- Overall (STATE)
- 83 Strongly Landlord-Friendly
- State Oklahoma
- 83 Strongly Landlord-Friendly · R+20
- County
- — inherits STATE
- City
- — inherits STATE
ZIP-level market 73521
- Home prices YoY
- -18.4%
- Active inventory
- 168
- Price-to-rent
- 9.5×
Monthly cashflow live
- Estimated rent
- $1,356 medium interval (Pro) →
- Mortgage (P&I)
- −$813
- Tax from tax record
- −$145 /mo · $1,736/yr
- Insurance
- −$65
- HOA
- −$0
- Vacancy / Maint / Mgmt
- −$285
- Net cashflow
- $49
Break-even live
Sensitivity live
| Price | -10% $137 | -5% $93 | +0% $49 | +5% $5 | +10% $-38 |
|---|---|---|---|---|---|
| Rent | -10% $-58 | -5% $-4 | +0% $49 | +5% $103 | +10% $156 |
| Rate | -1.0pp $127 | -0.5pp $89 | base $49 | +0.5pp $9 | +1.0pp $-32 |
UW: 25.0% down · 7.5% · 30yr · 1.5% tax · 5.0% vac · 8.0% maint · 8.0% mgmt
Financing live
Cash to close
- Down payment
- $38,750
- Closing costs
- $4,650
- Reserves months
- —
- Total cash needed
- —
Loan-product check · same deal, 3 products live
Conventional
25% down · 7.5% · 30yr
- Down + closing
- —
- Monthly P&I
- —
- Monthly cashflow
- —
- DSCR
- —
- Eligible?
- —
Personal DTI + credit; lowest rate.
DSCR
20% down · 8.5% · 30yr
- Down + closing
- —
- Monthly P&I
- —
- Monthly cashflow
- —
- DSCR
- —
- Eligible?
- —
No personal income docs; deal must DSCR.
Hard money
10% down · 12.0% · 12mo
- Down + closing
- —
- Monthly P&I
- —
- Monthly cashflow
- —
- DSCR
- —
- Eligible?
- —
Short-term bridge; refi at stabilization.
Listing history 13 events
-
2026-06-18status $155,000 Pending 5 DOM
-
2026-06-18pricestatus $155,000 Active 5 DOM
-
2026-06-17status $168,900 Pending 5 DOM
-
2026-06-16days on market $168,900 Active 5 DOM
-
2026-06-15days on market $168,900 Active 4 DOM
-
2026-06-13days on market $168,900 Active 2 DOM
-
2026-06-12pricestatus $168,900 Active 1 DOM
-
2026-04-08status Pending
-
2026-04-08$169,900 Active
-
2019-05-02soldstatus $145,000
-
2019-05-01soldstatus $145,000 603-char remark
Show marketing remark (603 chars)
Nice home with fresh interior painted walls. Three bedrooms with two baths, All new carpet just installed, Home is move in ready located on cul-de-sac. Lots of cabinets with a nice gas cookstove, stainless dishwasher. Bathrooms have been updated with neutral tile. Great closet space & very large walk in pantry. Large family room with fireplace. Home has ceiling fans, & some blinds. Can lighting in family room, Roof is about 5 years old. Large covered patio, wood privacy fenced backyard. Some nice mature trees in backyard. Small atrium room with new patio doors to our doors. Move in ready!
-
2018-08-27$143,000 603-char remark
Show marketing remark (603 chars)
Nice home with fresh interior painted walls. Three bedrooms with two baths, All new carpet just installed, Home is move in ready located on cul-de-sac. Lots of cabinets with a nice gas cookstove, stainless dishwasher. Bathrooms have been updated with neutral tile. Great closet space & very large walk in pantry. Large family room with fireplace. Home has ceiling fans, & some blinds. Can lighting in family room, Roof is about 5 years old. Large covered patio, wood privacy fenced backyard. Some nice mature trees in backyard. Small atrium room with new patio doors to our doors. Move in ready!
-
2006-03-01soldstatus $130,000
ⓘ Source: listings_history table (triggers on properties + properties_extension) + one-shot
backfill from property_details.listing_events for pre-trigger history.
Tax reassessment forecast OK · Resets to sale price
- Current annual tax
- $1,736 · $145/mo
- Projected year-2 tax
- $1,736 · $145/mo
- Expected delta
- $0/yr ($0/mo · 0.0%)
ⓘ Screening estimate from a state-policy table — verify with the county assessor before closing.
Climate risk First Street
- Flood 1/10 Low FEMA zone X (unshaded) · 0% chance over 30 yrs
- Wildfire 1/10 Low
- Heat 6/10 Major 7 d/yr ≥108°F today · 20 d/yr by 30 yrs out
- Wind 3/10 Moderate 5% chance of damaging wind over 30 yrs
- Air quality 1/10 Low 0 unhealthy d/yr today · 0 by 30 yrs out
Nearby sold comps map
Loading sold comps map…
Walkable amenities ~0.75 mi
Loading nearby amenities…
Taxation est. · year 1
- Rental income
- $16,274
- − Mortgage interest
- −$8,682
- − Property taxes
- −$1,736
- − Insurance
- −$775
- − Repairs & maintenance
- −$1,302
- − Management
- −$1,302
- − Depreciation
- −$4,509
- Taxable loss
- −$2,032
- Est. tax savings @ 24.0%
- +$488
- After-tax cash flow
- $1,079/yr
For passive investors: Depreciation is non-cash, so a rental often shows a tax loss while cash-flowing — sheltering income. Rental losses are passive: they offset passive income freely, and up to $25,000/yr can offset ordinary (W-2) income if you actively participate and your MAGI is under $100k (phasing out to $0 by $150k); unused losses carry forward. On sale, claimed depreciation is recaptured at up to 25%, and gains may owe capital-gains tax (a 1031 exchange can defer both). Figures are a year-1 estimate at your 24.0% rate — not tax advice; consult a CPA.
Schools (NCES district)
- District
- Altus
- NCES district ID
- 4002850
- Math proficiency
- 31% ▼ -9.00%
- Reading proficiency
- 28% ▼ -10.00%
- Median HH income
- $40,607
- Composite
- 24.91/100
- National rank
- #7574
- State rank
- #69 of 270 in OK
Livability — Altus
- Score
- 65/100
- State rank
- #151
- US rank
- #13386
Category grades
Schools grade is shown separately in the Schools card above.
Census & demographics
- Census place
- Altus, OK
- City population
- 20,574
- Population (ZIP)
- 20,352
Population outlook (Jackson County) Hauer SSP2
- Today (2025)
- 24,084 people
- By 2030
- 23,476 · -2.5%
- By 2040
- 22,731 · -5.6%
- By 2050
- 22,586 · -6.2%
- By 2075
- 25,413 · +5.5%
- By 2100
- 31,069 · +29.0%
Race, ethnicity, and origin ACS 2023
- Neighborhood character
- Diverse neighborhood (Simpson 0.57)
- Race & ethnicity
- White 60% Hispanic / Latino 26% Two or more races 12% Black 7% Native American 2% Asian 2%
- Hispanic origin (detail)
- Mexican 21% Puerto Rican 1%
- Common ancestry
- Slovak 2% Lithuanian 1% Iranian 1%
- Foreign-born
- 6% · Canada
- Languages at home
- 83% English-only · Spanish 15% Tagalog/Filipino 1% German/W. Germanic 1%
Political lean MEDSL · Jackson
- 2024 margin
- Solid R (+58.3) · D 19.9% · R 78.2% · Other 1.9%
- 2008→2024 swing
- -8.7pp toward R · 2008: -49.6pp · 2024: -58.3pp
- All cycles
- 2024: R+58.3 2020: R+57.7 2016: R+57.6 2012: R+50.7 2008: R+49.6
Not yet ingested
- Civics
- —
Market trends
- HPI YoY
- ▼ -40.26%
- Current HPI
- 178.7106
- Rent YoY
- —
- Metro
- —
- State GDP YoY
- ▲ 1.55%
- F500 in state
- 6
Industry mix (Fortune 500 HQ in OK)
| Industry | F500 HQs | Revenue |
|---|---|---|
| Energy | 3 | $48B |
|
||
Price history
+30.7% since first listed6 events — show timeline
- 2026-04-08 Pending — MLSOK
- 2026-04-08 Listed $169,900 MLSOK
- 2019-05-02 Sold (Public Records) $145,000 Public Records
- 2019-05-01 Sold (MLS) $145,000 MLSOK
- 2018-08-27 Listed $143,000 MLSOK
- 2006-03-01 Sold (Public Records) $130,000 Public Records
Property tax history
+3.3%/yrLatest (2025): $1,736 · +1.8% YoY. Source: county tax records.
Cash-flow waterfall
monthlySold comps — $/sqft
last 12 mo · ≤1 miLoading sold comps…