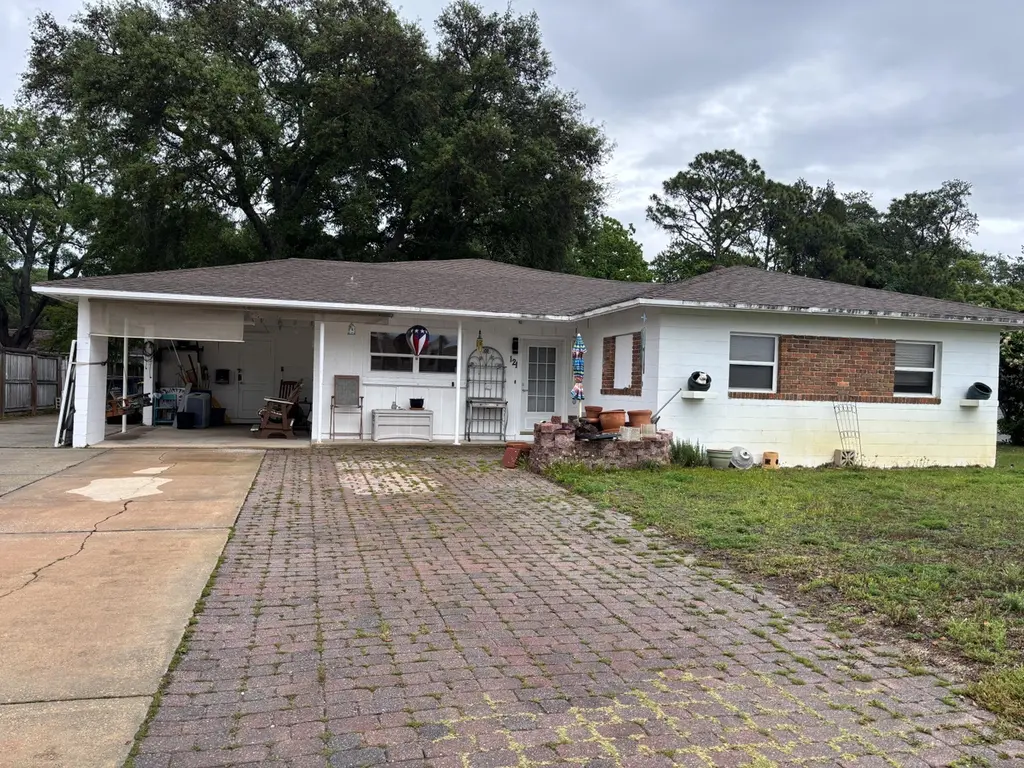
121 NW Jet Dr · Fort Walton Beach, FL
Flood risk 1/10 · Minimal
- FEMA flood zone
- X (unshaded)
- Chance of flooding over 30 yrs
- 0.0%
- Est. flood insurance / yr
- $507 – $1,088
Fire risk 1/10 · Minimal
- Est. fire insurance / yr
- $947 – $1,759
Heat risk 10/10 · Severe
- Hot days now (above 104°F)
- 7 days/yr
- Hot days in 30 yrs
- 22 days/yr
Wind risk 9/10 · Severe
- Chance of severe wind over 30 yrs
- 99.0%
Air-quality risk 2/10 · Minimal
- Unhealthy air days now
- 1 days/yr
- Unhealthy air days in 30 yrs
- 2 days/yr
Risk factors via First Street. Map © Google.
Why this score? — see what drove the C grade
The composite is a weighted blend of 9 inputs, each scored 0–100. Each bar is that input's sub-score; the figure is the points it added to the 100-point composite (weight × sub-score).
- Cash flow +17.8/30.0
- ARV discount +15.0/15.0
- DSCR +5.6/10.0
- Schools +5.2/10.0
- Livability +4.0/5.0
- 1% rule +3.6/10.0
- Rent growth +2.8/5.0
- Condition / age +2.5/5.0
- Appreciation +0.0/10.0
$265,000
🖨 Deal sheet (PDF) 📄 Offer letter ✓ Due diligence
Listing remarks
House being sold ''AS IS'' and priced accordingly. Great family home with 4 bedrooms and an eat-in kitchen. Jet Dr Rec Center a short walk to the right, new townhouses being built across the street and a daycare located down the road to the left. Roof December 2017; Water Heater 2018; HVAC 2024 (warranty till 9/18/2034); Storm Door 2025; Walk-in Tub 2019; Attic blanket (energy shield) 2011; Lawn Pump 2022; two custom built cabinets (pantry & buffet). Electrical does have cloth wiring - Estimate $22,700 Drywall for whole house - Estimate $31,691 Fireplace is not a working one - Verbal estimate $5000 gas/$3000 electric Washer and dryer do not convey; trailer straight out back
Key facts
- Hvac 2024
- Water heater
- Walk-in tub
Tags
Property features AI
Finance
- Other: Approximately 1,958 total building area (per county records)
- HOA & community: Located in the SANTA MARKELLA subdivision
Exterior
- Parking: Attached carport with 1 carport space
- Utilities: Electric service; Natural gas; Public water; Public sewer
- Home design: Ranch-style single-story home; Built in 1965; Zoned for single-family residential
- Construction: Block and frame construction
- Exterior features: Private yard; Open deck
Interior
- Kitchen: Kitchen on the first floor; Dishwasher; Disposal; Microwave
- Bedrooms: 4 bedrooms (master bedroom on the first floor); All bedrooms located on the first floor
- Bathrooms: 2 full bathrooms
- Heating & cooling: Central heating (natural gas); Central air conditioning; Ceiling fans; Electric heat controls
- Interior features: Fireplace; Great room
- Laundry & utility: Gas water heater
Neighborhood map
What this means for you Summary
Snapshot
- This is a 3-bed/2.0-bath single-family listed at $265k.
Deal economics
- At list price, monthly cash flow is $218 ($3k/yr) — positive.
- The deal already cash-flows at list — no discount required.
- To meet the 1% rule (rent ≥ 1% of price), the offer needs to be $227k (14.2% below list).
- Recommended offer: $227k (14.2% below list) — sets the bar for 1% rule.
- Cap rate 7.3% vs local median 0.9% in Fort Walton Beach — top-decile yield for the area; either an underpriced asset or a hidden risk that comps aren't pricing in. Stress-test before assuming the spread holds.
Location & tenants
- Location reads 80/100 on livability (#111 in FL, #1,628 nationally) — a professional / high-income tenant draw. Strengths: commute A+, housing A+, health & safety A+; Watch: amenities F.
- Okaloosa (other): math 60% / reading 60% proficiency, ranked #12 of 73 in FL (top 16%) — acceptable for families but not a draw, mixed tenant base, ~2y average lease.
- Zoned schools: Annette P. Edwins Elementary School (math 47% / reading 42%, grade F, #1,288 of 2,144 statewide, top 62%, 453 students, 80% FRL); Fort Walton Beach High School (math 54% / reading 58%, grade C, #131 of 667 statewide, top 20%, 1,620 students, 42% FRL) — zoned schools average 61% FRL vs 36% district-wide (25 pts higher); higher-poverty schools than district average — tighter screening recommended.
- Market conditions: Rents rising (+1.3%/yr); 341 active listings in the ZIP; 15 comparable units currently listed for rent nearby; rentals at typical pace (median 22d on market — plan ~3-4 weeks tenant-placement turnaround); 1,268 units permitted in Okaloosa County in 2024 (175 in 5+ unit buildings).
- This rent runs 42% of the median local income ($65k/yr) — at the standard rent-burdened threshold; future hikes will face affordability resistance.
Forward outlook
- Local home prices are declining (-3.0%/yr); year-one equity from $2k of loan paydown is wiped out by about $8k of value loss. Plan a longer hold.
- Okaloosa County population projected at +37% by 2050 — long-run rental-demand tailwind backs the buy-and-hold thesis.
Negotiation context
- It's been on market 23 days — a 2% lower offer ($261k) is reasonable based on typical stale-listing flexibility.
Risks & watch-outs
- Climate carrying-cost: severe wind risk, 99% chance of damaging wind over 30y; extreme-heat days projected 7→22/yr by 2055 (HVAC capex compounding) — expect insurance premiums to compound above CPI over the hold.
Questions for the listing agent
- Built in 1965 — when were the roof, HVAC, electrical panel, plumbing, and water heater last replaced?
- Is there a deadline driving the sale (1031 exchange, divorce, estate, relocation)? That informs how much negotiation room exists.
- What's the average days-on-market for RENTAL listings here right now (not sales)? A rising rental-DOM trend means longer vacancies and softer asking-rent achievability than the comps imply.
- What's the recent tenant-quality profile in this submarket — average credit score on applications, eviction rate, late-payment / NSF rate, and stable-employment percentage? A property-management company in the area should have these aggregated.
- How much new for-sale + rental construction is in the pipeline within 1–3 miles? Heavy new supply typically softens prices + rents 12–24 months out; constrained supply supports both.
Investment metrics
- 1% rule
- 0.86% ✗
- Cap rate
- 7.28%
- Cash-on-cash
- 3.52%
- DSCR
- 1.16
- GRM
- 9.7
CMA / ARV
- ARV (on-the-fly)
- $389,642
- Comps found
- 12
Show comp detail 12 sales within ~0.75 mi
| Address | Dist | Beds/Ba | Sqft | Sold | Price | $/sf | Match |
|---|---|---|---|---|---|---|---|
| 22 NW Robinwood Dr | 0.13mi | 4/2.0 (+1) | 1,765 (-10%) | 5mo | $362,000 | $205 | 68 |
| 25 NW Maples St | 0.32mi | 4/2.0 (+1) | 2,098 (+7%) | 1mo | $455,000 | $217 | 67 |
| 19 NW Highland Dr | 0.39mi | 4/2.0 (+1) | 2,018 (+3%) | 6mo | $490,000 | $243 | 67 |
| 35 NW Baywood Ct | 0.12mi | 4/3.5 (+1) | 2,230 (+14%) | 6mo | $385,000 | $173 | 55 |
| 103 SW Cedar Ave | 0.52mi | 3/2.0 | 2,190 (+12%) | 3mo | $364,143 | $166 | 53 |
| 230 SW Santa Rosa St | 0.61mi | 4/2.5 (+1) | 2,075 (+6%) | 2mo | $493,000 | $238 | 53 |
| 215 NW Fliva Ave | 0.73mi | 3/3.0 | 2,017 (+3%) | 7mo | $375,000 | $186 | 51 |
| 218 NW Katherine Pl | 0.60mi | 4/2.0 (+1) | 1,815 (-7%) | 7mo | $326,400 | $180 | 49 |
| 227 NW Katherine Pl | 0.66mi | 4/2.0 (+1) | 2,135 (+9%) | 2mo | $425,000 | $199 | 48 |
| 218 SW Coral Dr | 0.68mi | 4/2.0 (+1) | 2,132 (+9%) | 1mo | $342,000 | $160 | 48 |
| 110 NW Gardenia Ct | 0.67mi | 3/2.0 | 1,670 (-15%) | 10mo | $279,000 | $167 | 36 |
| 245 NW Bayou Woods Dr | 0.71mi | 4/2.0 (+1) | 1,691 (-14%) | 9mo | $345,225 | $204 | 32 |
Match score weights: distance 35% · size 25% · config 20% · recency 20%. Top-matched comps best support the ARV.
Projected returns pro-forma
-3.0% appreciation · 1.33% rent growth · sell at horizon
- IRR
- -12.5%
- Equity multiple
- 0.56×
- Total profit
- $-32,968
- Equity at exit
- $39,512
- IRR
- -5.9%
- Equity multiple
- 0.65×
- Total profit
- $-26,276
- Equity at exit
- $22,912
Cash invested: $74,200 (down + closing). Projections, not guarantees.
Landlord ↔ Tenant lean methodology
- Overall (STATE)
- 87 Strongly Landlord-Friendly
- State Florida
- 87 Strongly Landlord-Friendly · R+3
- County
- — inherits STATE
- City
- — inherits STATE
ZIP-level market 32548
- Home prices YoY
- -31.1%
- Rents YoY
- 1.3%
- Active inventory
- 341
- Price-to-rent
- 9.7×
Monthly cashflow live
- Estimated rent
- $2,275 high interval (Pro) →
- Mortgage (P&I)
- −$1,390
- Tax from tax record
- −$79 /mo · $952/yr
- Insurance
- −$110
- HOA
- −$0
- Vacancy / Maint / Mgmt
- −$478
- Net cashflow
- $218
Break-even live
Sensitivity live
| Price | -10% $368 | -5% $293 | +0% $218 | +5% $143 | +10% $68 |
|---|---|---|---|---|---|
| Rent | -10% $38 | -5% $128 | +0% $218 | +5% $307 | +10% $397 |
| Rate | -1.0pp $351 | -0.5pp $285 | base $218 | +0.5pp $149 | +1.0pp $79 |
UW: 25.0% down · 7.5% · 30yr · 1.5% tax · 5.0% vac · 8.0% maint · 8.0% mgmt
Financing live
Cash to close
- Down payment
- $66,250
- Closing costs
- $7,950
- Reserves months
- —
- Total cash needed
- —
Loan-product check · same deal, 3 products live
Conventional
25% down · 7.5% · 30yr
- Down + closing
- —
- Monthly P&I
- —
- Monthly cashflow
- —
- DSCR
- —
- Eligible?
- —
Personal DTI + credit; lowest rate.
DSCR
20% down · 8.5% · 30yr
- Down + closing
- —
- Monthly P&I
- —
- Monthly cashflow
- —
- DSCR
- —
- Eligible?
- —
No personal income docs; deal must DSCR.
Hard money
10% down · 12.0% · 12mo
- Down + closing
- —
- Monthly P&I
- —
- Monthly cashflow
- —
- DSCR
- —
- Eligible?
- —
Short-term bridge; refi at stabilization.
Rent comps 15 comps
| Address | Beds | Baths | Sqft | Rent | $/sqft | DOM | Units | Dist |
|---|---|---|---|---|---|---|---|---|
| 115 Beal Pkwy NW Fort Walton Beach, FL | 2.0 | 2.5 | 1440 | $1,995 | $1.39 | 44d | 1 | 0.68mi |
| 30 Harbeson Ave NE Fort Walton Beach, FL | 4.0 | 2.5 | 1717 | $2,250 | $1.31 | 44d | 1 | 0.74mi |
| 305 Leah Miller Dr NW Fort Walton Beach, FL | 3.0 | 1.5 | 1334 | $2,000 | $1.50 | 22d | 1 | 0.75mi |
| 13 Chatelaine Cir SE Fort Walton Beach, FL | 3.0 | 3.0 | 1728 | $2,100 | $1.22 | 14d | 1 | 0.77mi |
| 119 Beal Pkwy SE #203 Fort Walton Beach, FL | 2.0 | 2.0 | 1588 | $2,150 | $1.35 | 22d | 1 | 0.81mi |
| 322 Kathleen Pl NW Fort Walton Beach, FL | 4.0 | 2.0 | 1532 | $2,490 | $1.63 | 14d | 1 | 0.83mi |
| 358 Coral Dr SW Fort Walton Beach, FL | 3.0 | 2.0 | 1350 | $1,800 | $1.33 | 44d | 1 | 0.92mi |
| 5 Laguna St #104 Fort Walton Beach, FL | 2.0 | 2.0 | 1269 | $2,575 | $2.03 | 45d | 1 | 1.01mi |
| 120 Opp Blvd NE Fort Walton Beach, FL | 2.0 | 1.5 | 1240 | $1,700 | $1.37 | 22d | 1 | 1.02mi |
| 17 Cape Dr NW Unit B Fort Walton Beach, FL | 3.0 | 2.0 | 1462 | $1,995 | $1.36 | 14d | 1 | 1.08mi |
| 723 Sailfish Dr Fort Walton Beach, FL | 4.0 | 3.0 | 2400 | $3,899 | $1.62 | 14d | 1 | 1.18mi |
| 113 Brooks St SE #206 Fort Walton Beach, FL | 3.0 | 3.0 | 2030 | $2,750 | $1.35 | 44d | 1 | 1.21mi |
| 10 Alder Ave SE Fort Walton Beach, FL | 3.0 | 2.5 | 1749 | $2,145 | $1.23 | 22d | 1 | 1.33mi |
| 12 Alder Ave SE Fort Walton Beach, FL | 3.0 | 2.5 | 1742 | $2,145 | $1.23 | 22d | 1 | 1.34mi |
| 37 Magnolia Ave SE Fort Walton Beach, FL | 4.0 | 2.0 | 1691 | $2,750 | $1.63 | 22d | 1 | 1.50mi |
Listing history 14 events
-
2026-06-18days on market $265,000 Active 23 DOM
-
2026-06-17days on market $265,000 Active 22 DOM
-
2026-06-16days on market $265,000 Active 21 DOM
-
2026-06-10days on market $265,000 Active 15 DOM
-
2026-06-09days on market $265,000 Active 14 DOM
-
2026-06-08days on market $265,000 Active 13 DOM
-
2026-06-07days on market $265,000 Active 12 DOM
-
2026-06-05days on market $265,000 Active 9 DOM
-
2026-06-02days on market $265,000 Active 7 DOM
-
2026-06-01days on market $265,000 Active 6 DOM
-
2026-05-31days on market $265,000 Active 5 DOM
-
2026-05-30days on market $265,000 Active 4 DOM
-
2026-05-27price $265,000
-
2026-05-26$250,000 Active
ⓘ Source: listings_history table (triggers on properties + properties_extension) + one-shot
backfill from property_details.listing_events for pre-trigger history.
Tax reassessment forecast FL · Resets to sale price
- Current annual tax
- $952 · $79/mo
- Projected year-2 tax
- $2,200 · $183/mo
- Expected delta
- +$1,248/yr (+$104/mo · 131.2%)
ⓘ Screening estimate from a state-policy table — verify with the county assessor before closing.
Climate risk First Street
- Flood 1/10 Low FEMA zone X (unshaded) · 0% chance over 30 yrs
- Wildfire 1/10 Low
- Heat 10/10 Extreme 7 d/yr ≥104°F today · 22 d/yr by 30 yrs out
- Wind 9/10 Extreme 99% chance of damaging wind over 30 yrs
- Air quality 2/10 Low 1 unhealthy d/yr today · 2 by 30 yrs out
Nearby sold comps map
Loading sold comps map…
Walkable amenities ~0.75 mi
Loading nearby amenities…
Taxation est. · year 1
- Rental income
- $27,295
- − Mortgage interest
- −$14,844
- − Property taxes
- −$952
- − Insurance
- −$1,325
- − Repairs & maintenance
- −$2,184
- − Management
- −$2,184
- − Depreciation
- −$7,709
- Taxable loss
- −$1,902
- Est. tax savings @ 24.0%
- +$456
- After-tax cash flow
- $3,067/yr
For passive investors: Depreciation is non-cash, so a rental often shows a tax loss while cash-flowing — sheltering income. Rental losses are passive: they offset passive income freely, and up to $25,000/yr can offset ordinary (W-2) income if you actively participate and your MAGI is under $100k (phasing out to $0 by $150k); unused losses carry forward. On sale, claimed depreciation is recaptured at up to 25%, and gains may owe capital-gains tax (a 1031 exchange can defer both). Figures are a year-1 estimate at your 24.0% rate — not tax advice; consult a CPA.
Schools (NCES district)
- District
- Okaloosa
- NCES district ID
- 1201380
- Math proficiency
- 60% ▼ -12.00%
- Reading proficiency
- 60% ▼ -4.00%
- Median HH income
- $55,601
- Composite
- 51.62/100
- National rank
- #1705
- State rank
- #12 of 73 in FL
Livability — Fort Walton Beach
- Score
- 80/100
- State rank
- #111
- US rank
- #1628
Category grades
Schools grade is shown separately in the Schools card above.
Census & demographics
- Census place
- Fort Walton Beach, FL
- County
- Okaloosa County · 194,352 people
- City population
- 59,301
- Metro
- Crestview-Fort Walton Beach-Destin, FL
- Population (ZIP)
- 23,774
- Household income
- $65,342
- Rent vs Own
- Severe rent burden
- 889.0
Population outlook (Okaloosa County) Hauer SSP2
- Today (2025)
- 235,133 people
- By 2030
- 253,483 · +7.8%
- By 2040
- 289,537 · +23.1%
- By 2050
- 322,954 · +37.3%
- By 2075
- 399,624 · +70.0%
- By 2100
- 425,311 · +80.9%
Race, ethnicity, and origin ACS 2023
- Neighborhood character
- Diverse neighborhood (Simpson 0.57)
- Race & ethnicity
- White 63% Hispanic / Latino 13% Black 12% Two or more races 9% Asian 6%
- Hispanic origin (detail)
- Mexican 4% Puerto Rican 2%
- Common ancestry
- Italian 4% Slovak 3% Romanian 2%
- Foreign-born
- 12% · Canada, Jamaica
- Languages at home
- 84% English-only · Spanish 9% Other Asian/Pacific 3% Other Indo-European 1%
Political lean MEDSL · Okaloosa
- 2024 margin
- Solid R (+42.4) · D 28.2% · R 70.7% · Other 1.1%
- 2008→2024 swing
- +2.5pp toward D · 2008: -44.9pp · 2024: -42.4pp
- All cycles
- 2024: R+42.4 2020: R+39.1 2016: R+47.8 2012: R+49.4 2008: R+44.9
Not yet ingested
- Civics
- —
Market trends
- HPI YoY
- ▼ -123.88%
- Current HPI
- 274.8418
- Rent YoY
- ▲ 1.33%
- Metro
- Crestview-Fort Walton Beach-Destin, FL
- State GDP YoY
- ▲ 3.28%
- F500 in state
- 36
Industry mix (Fortune 500 HQ in FL)
| Industry | F500 HQs | Revenue |
|---|---|---|
| Industrial Technology | 2 | $29B |
|
||
| Insurance | 2 | $17B |
|
||
| Retail | 1 | $60B |
|
||
| Technology Distribution | 1 | $58B |
|
||
| Homebuilding | 1 | $35B |
|
||
| Technology Manufacturing | 1 | $35B |
|
||
Price history
+6.0% since first listed2 events — show timeline
- 2026-05-27 Price Changed $265,000 ECAR
- 2026-05-26 Listed $250,000 ECAR
Property tax history
+0.7%/yrLatest (2025): $952 · +4.2% YoY. Source: county tax records.
Cash-flow waterfall
monthlySold comps — $/sqft
last 12 mo · ≤1 miLoading sold comps…