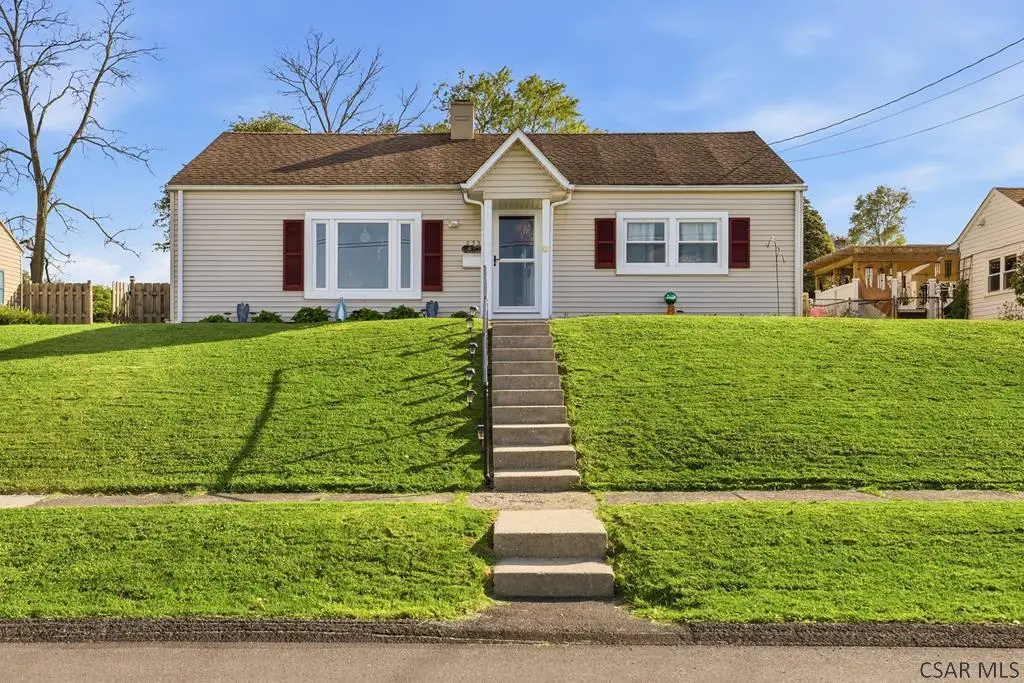
233 Hereford Ln · Westwood, PA
Flood risk 1/10 · Minimal
- FEMA flood zone
- X (unshaded)
- Chance of flooding over 30 yrs
- 0.0%
- Est. flood insurance / yr
- $473 – $860
Fire risk 1/10 · Minimal
- Est. fire insurance / yr
- $511 – $949
Heat risk 3/10 · Minor
- Hot days now (above 96°F)
- 7 days/yr
- Hot days in 30 yrs
- 17 days/yr
Wind risk 2/10 · Minimal
- Chance of severe wind over 30 yrs
- —
Air-quality risk 2/10 · Minimal
- Unhealthy air days now
- 1 days/yr
- Unhealthy air days in 30 yrs
- 2 days/yr
Risk factors via First Street. Map © Google.
Why this score? — see what drove the B- grade
The composite is a weighted blend of 9 inputs, each scored 0–100. Each bar is that input's sub-score; the figure is the points it added to the 100-point composite (weight × sub-score).
- Cash flow +28.1/30.0
- ARV discount +11.6/15.0
- DSCR +10.0/10.0
- 1% rule +7.5/10.0
- Livability +3.2/5.0
- Rent growth +2.5/5.0
- Condition / age +2.5/5.0
- Schools +1.3/10.0
- Appreciation +0.0/10.0
$99,900
🖨 Deal sheet (PDF) 📄 Offer letter ✓ Due diligence
Listing remarks MLS
Move in ready 3 Bedroom, 1 Bath vinyl sided ranch in Lower Yoder Township! Interior painted & new flooring installed throughout the home in March 2021. Spacious 12' x 25' Living Room. Eat-in Kitchen with plenty of cabinet space and built-in oven & cooktop. Laundry Room off Kitchen with utility sink. Heated Sunroom off of the Laundry Room with access to the backyard. Updated Bathroom with oak vanity. Replacement windows throughout. Pull down attic storage. Fenced in backyard with shed. Sewer compliant. Call today to tour!
Key facts
- New furnace
- New front door
- New electric cooktop
Tags
Property features AI
Exterior
- Parking: On-street parking
- Utilities: Public water; Public sewer; Sewer available
- Home design: Single-family residence; Residential property; One story
- Construction: Vinyl siding; Shingle roof
- Exterior features: Enclosed patio; Rectangular lot; City street frontage; Publicly maintained road
Interior
- Kitchen: Oven; Refrigerator
- Flooring: Carpet; Laminate; Wood
- Bathrooms: 1 full bathroom
- Heating & cooling: Central air conditioning; Forced-air heating (electric and natural gas)
- Interior features: Eat-in kitchen; High-speed internet available; Built-in features; Master bedroom on main level; Double-pane windows
- Laundry & utility: Main-level laundry with sink
Neighborhood map
What this means for you Summary
Snapshot
- This is a 3-bed/1.0-bath single-family listed at $100k.
Deal economics
- At list price, monthly cash flow is $315 ($4k/yr) — positive.
- The deal already cash-flows at list — no discount required.
- Meets the 1% rule at list price ($1k rent vs $100k).
Location & tenants
- Location reads 63/100 on livability (#1,263 in PA) — a middle-class / working-renter tenant base. Strengths: crime A+, cost of living A+; Watch: amenities F, commute F, employment D-.
- Greater Johnstown SD (urban): math 9% / reading 25% proficiency, ranked #509 of 539 in PA (top 94%) — low school quality limits family demand, transient renter base, plan for 1-2y turnover; 80% free/reduced lunch — lower-income household profile, screen leases tightly.
- Zoned schools: Greater Johnstown El Sch (math 14% / reading 21%, grade F, #1,291 of 1,518 statewide, top 85%, 1,269 students, 100% FRL); Greater Johnstown Ms (math 6% / reading 24%, grade F, #471 of 512 statewide, top 93%, 660 students, 100% FRL); Greater Johnstown Shs (math 8% / reading 32%, grade F, #387 of 437 statewide, top 89%, 894 students, 98% FRL) — zoned schools average 100% FRL vs 80% district-wide (20 pts higher); higher-poverty schools than district average — tighter screening recommended.
- Market conditions: 93 active listings in the ZIP; 1 comparable units currently listed for rent nearby; 64 units permitted in Cambria County in 2024 (0 in 5+ unit buildings).
Forward outlook
- Local home prices are declining (-3.0%/yr); year-one equity from $691 of loan paydown is wiped out by about $3k of value loss. Plan a longer hold.
- Cambria County population projected at -28% by 2050 — secular population decline; favor cash flow + early exit over multi-decade hold.
- At projected returns (-3.0% appreciation + 3.0% rent growth), your $28k cash investment doubles in ~9 years — after that, you're playing with house money.
Negotiation context
- Only 3 days on market — expect competitive offers; lowballing is unlikely to land.
Risks & watch-outs
- Watch-outs: built in 1950 — expect roof / HVAC / electrical / plumbing capex.
Questions for the listing agent
- Built in 1950 — when were the roof, HVAC, electrical panel, plumbing, and water heater last replaced?
- Is there a deadline driving the sale (1031 exchange, divorce, estate, relocation)? That informs how much negotiation room exists.
- Schools are F-rated, which usually means shorter tenancies and higher turnover. Who's the typical renter profile here, and what's been the actual vacancy rate?
- What's the average days-on-market for RENTAL listings here right now (not sales)? A rising rental-DOM trend means longer vacancies and softer asking-rent achievability than the comps imply.
- What's the recent tenant-quality profile in this submarket — average credit score on applications, eviction rate, late-payment / NSF rate, and stable-employment percentage? A property-management company in the area should have these aggregated.
- How much new for-sale + rental construction is in the pipeline within 1–3 miles? Heavy new supply typically softens prices + rents 12–24 months out; constrained supply supports both.
Investment metrics
- 1% rule
- 1.25% ✓
- Cap rate
- 10.08%
- Cash-on-cash
- 13.53%
- DSCR
- 1.60
- GRM
- 6.7
CMA / ARV
- ARV (median comp)
- $109,978
- List price
- $99,900
- Delta
- -9.16%
- Verdict
- FAIR
- Comps
- 20 within 1.0 mi
Show comp detail 12 sales within ~0.75 mi
| Address | Dist | Beds/Ba | Sqft | Sold | Price | $/sf | Match |
|---|---|---|---|---|---|---|---|
| 233 Hereford Ln | 0.00mi | 3/1.0 | 1,264 (0%) | 0mo | $110,000 | $87 | 100 |
| 232 Hereford Ln | 0.03mi | 3/1.0 | 1,292 (+2%) | 7mo | $118,000 | $91 | 90 |
| 224 Hereford Ln | 0.03mi | 4/2.0 (+1) | 1,274 (+1%) | 12mo | $135,000 | $106 | 78 |
| 229 Sherwood Dr | 0.06mi | 3/1.0 | 1,200 (-5%) | 22mo | $104,500 | $87 | 71 |
| 245 Hereford Ln | 0.03mi | 2/1.0 (-1) | 1,224 (-3%) | 22mo | $97,000 | $79 | 70 |
| 249 Sherwood Dr | 0.08mi | 3/2.0 | 1,400 (+11%) | 11mo | $205,000 | $146 | 65 |
| 1444 Mary Dr | 0.61mi | 3/1.5 | 1,240 (-2%) | 3mo | $160,000 | $129 | 64 |
| 1413 Goucher St | 0.70mi | 3/1.5 | 1,242 (-2%) | 5mo | $107,500 | $87 | 58 |
| 286 Sherwood Dr | 0.14mi | 2/1.5 (-1) | 1,379 (+9%) | 23mo | $125,000 | $91 | 53 |
| 236 Furnari Ave | 0.45mi | 3/1.0 | 1,408 (+11%) | 20mo | $144,000 | $102 | 43 |
| 819 Thermal Ave | 0.68mi | 3/1.5 | 1,161 (-8%) | 16mo | $135,000 | $116 | 40 |
| 827 Sunset Ave | 0.75mi | 2/2.0 (-1) | 1,152 (-9%) | 8mo | $110,000 | $95 | 34 |
Match score weights: distance 35% · size 25% · config 20% · recency 20%. Top-matched comps best support the ARV.
Projected returns pro-forma
-3.0% appreciation · 3.0% rent growth · sell at horizon
- IRR
- 3.6%
- Equity multiple
- 1.14×
- Total profit
- $3,900
- Equity at exit
- $14,895
- IRR
- 13.1%
- Equity multiple
- 2.05×
- Total profit
- $29,276
- Equity at exit
- $8,638
Cash invested: $27,972 (down + closing). Projections, not guarantees.
Landlord ↔ Tenant lean methodology
- Overall (STATE)
- 62 Landlord-Friendly
- State Pennsylvania
- 62 Landlord-Friendly · EVEN
- County
- — inherits STATE
- City
- — inherits STATE
ZIP-level market 15905
- Home prices YoY
- -31.1%
- Active inventory
- 93
- Price-to-rent
- 6.7×
Monthly cashflow live
- Estimated rent
- $1,244 medium interval (Pro) →
- Mortgage (P&I)
- −$524
- Tax from tax record
- −$102 /mo · $1,225/yr
- Insurance
- −$42
- HOA
- −$0
- Vacancy / Maint / Mgmt
- −$261
- Net cashflow
- $315
Break-even live
Sensitivity live
| Price | -10% $372 | -5% $344 | +0% $315 | +5% $287 | +10% $259 |
|---|---|---|---|---|---|
| Rent | -10% $217 | -5% $266 | +0% $315 | +5% $364 | +10% $414 |
| Rate | -1.0pp $366 | -0.5pp $341 | base $315 | +0.5pp $289 | +1.0pp $263 |
UW: 25.0% down · 7.5% · 30yr · 1.5% tax · 5.0% vac · 8.0% maint · 8.0% mgmt
Financing live
Cash to close
- Down payment
- $24,975
- Closing costs
- $2,997
- Reserves months
- —
- Total cash needed
- —
Loan-product check · same deal, 3 products live
Conventional
25% down · 7.5% · 30yr
- Down + closing
- —
- Monthly P&I
- —
- Monthly cashflow
- —
- DSCR
- —
- Eligible?
- —
Personal DTI + credit; lowest rate.
DSCR
20% down · 8.5% · 30yr
- Down + closing
- —
- Monthly P&I
- —
- Monthly cashflow
- —
- DSCR
- —
- Eligible?
- —
No personal income docs; deal must DSCR.
Hard money
10% down · 12.0% · 12mo
- Down + closing
- —
- Monthly P&I
- —
- Monthly cashflow
- —
- DSCR
- —
- Eligible?
- —
Short-term bridge; refi at stabilization.
Rent comps 1 comps
| Address | Beds | Baths | Sqft | Rent | $/sqft | DOM | Units | Dist |
|---|---|---|---|---|---|---|---|---|
| 212-214 Palliser St Johnstown, PA | 3.0 | 1.0 | 1400 | $1,150 | $0.82 | 26d | 1 | 1.05mi |
Listing history 6 events
-
2026-05-10status Pending 1157-char remark
-
2026-05-06$99,900 Active 1157-char remark
-
2021-04-30soldstatus $72,000 538-char remark
Show marketing remark (538 chars)
Move in ready 3 Bedroom, 1 Bath vinyl sided ranch in Lower Yoder Township! Interior painted & new flooring installed throughout the home in March 2021. Spacious 12' x 25' Living Room. Eat-in Kitchen with plenty of cabinet space and built-in oven & cooktop. Laundry Room off Kitchen with utility sink. Heated Sunroom off of the Laundry Room with access to the backyard. Updated Bathroom with oak vanity. Replacement windows throughout. Pull down attic storage. Fenced in backyard with shed. Sewer compliant. Call today to tour!
-
2021-04-30soldstatus $72,000
Show marketing remark (538 chars)
Move in ready 3 Bedroom, 1 Bath vinyl sided ranch in Lower Yoder Township! Interior painted & new flooring installed throughout the home in March 2021. Spacious 12' x 25' Living Room. Eat-in Kitchen with plenty of cabinet space and built-in oven & cooktop. Laundry Room off Kitchen with utility sink. Heated Sunroom off of the Laundry Room with access to the backyard. Updated Bathroom with oak vanity. Replacement windows throughout. Pull down attic storage. Fenced in backyard with shed. Sewer compliant. Call today to tour!
-
2014-09-22soldstatus $30,500
Show marketing remark (467 chars)
Easy one floor living near shopping and bus transportation. Vinyl sided 3 Bedroom Ranch with fenced rear yard. Updated Bathroom with oak vanity. Nice size eat-in Kitchen with plenty of cabinets - refrigerator included. Laundry Room w/ utility sink includes the dryer. 12' x 25' Living Room. Rear heated Sunroom provides access to patio and nice back yard with shed. Roof replaced in 2008. Furnace replaced in 2005. Replacement vinyl windows. Pull down attic storage.
-
2014-09-17soldstatus $30,500
ⓘ Source: listings_history table (triggers on properties + properties_extension) + one-shot
backfill from property_details.listing_events for pre-trigger history.
Tax reassessment forecast PA · Partial reset (capped growth)
- Current annual tax
- $1,225 · $102/mo
- Projected year-2 tax
- $1,402 · $117/mo
- Expected delta
- +$177/yr (+$15/mo · 14.4%)
ⓘ Screening estimate from a state-policy table — verify with the county assessor before closing.
Climate risk First Street
- Flood 1/10 Low FEMA zone X (unshaded) · 0% chance over 30 yrs
- Wildfire 1/10 Low
- Heat 3/10 Moderate 7 d/yr ≥96°F today · 17 d/yr by 30 yrs out
- Wind 2/10 Low
- Air quality 2/10 Low 1 unhealthy d/yr today · 2 by 30 yrs out
Nearby sold comps map
Loading sold comps map…
Walkable amenities ~0.75 mi
Loading nearby amenities…
Taxation est. · year 1
- Rental income
- $14,931
- − Mortgage interest
- −$5,596
- − Property taxes
- −$1,225
- − Insurance
- −$500
- − Repairs & maintenance
- −$1,194
- − Management
- −$1,194
- − Depreciation
- −$2,906
- Taxable income
- $2,315
- Est. tax owed @ 24.0%
- −$556
- After-tax cash flow
- $3,228/yr
For passive investors: Depreciation is non-cash, so a rental often shows a tax loss while cash-flowing — sheltering income. Rental losses are passive: they offset passive income freely, and up to $25,000/yr can offset ordinary (W-2) income if you actively participate and your MAGI is under $100k (phasing out to $0 by $150k); unused losses carry forward. On sale, claimed depreciation is recaptured at up to 25%, and gains may owe capital-gains tax (a 1031 exchange can defer both). Figures are a year-1 estimate at your 24.0% rate — not tax advice; consult a CPA.
Schools (NCES district)
- District
- Greater Johnstown SD
- NCES district ID
- 4210950
- Math proficiency
- 9% ▼ -6.00%
- Reading proficiency
- 25% ▼ -6.00%
- Median HH income
- $27,890
- Composite
- 13.25/100
- National rank
- #9550
- State rank
- #509 of 539 in PA
Livability — Westwood
- Score
- 63/100
- State rank
- #1263
- US rank
- #15213
Category grades
Schools grade is shown separately in the Schools card above.
Census & demographics
- Census place
- Westwood, PA
- County
- Cambria County · 30,791 people
- Metro
- Johnstown, PA
- Population (ZIP)
- 19,329
- Household income
- $69,212
- Rent vs Own
- Severe rent burden
- 359.0
Population outlook (Cambria County) Hauer SSP2
- Today (2025)
- 122,754 people
- By 2030
- 115,827 · -5.6%
- By 2040
- 101,309 · -17.5%
- By 2050
- 88,379 · -28.0%
- By 2075
- 65,237 · -46.9%
- By 2100
- 46,909 · -61.8%
Race, ethnicity, and origin ACS 2023
- Neighborhood character
- Predominantly White (92%)
- Race & ethnicity
- White 92% Two or more races 3% Hispanic / Latino 2% Black 2%
- Common ancestry
- Romanian 7% Scotch-Irish 1% Italian 1%
- Foreign-born
- 2% · Canada
- Languages at home
- 96% English-only · Spanish 1%
Political lean MEDSL · Cambria
- 2024 margin
- Solid R (+39.7) · D 29.8% · R 69.5%
- 2008→2024 swing
- -40.4pp toward R · 2008: 0.7pp · 2024: -39.7pp
- All cycles
- 2024: R+39.7 2020: R+37.3 2016: R+37.8 2012: R+17.8 2008: D+0.7
Not yet ingested
- Civics
- —
Market trends
- HPI YoY
- ▼ -64.18%
- Current HPI
- 142.5218
- Rent YoY
- —
- Metro
- Johnstown, PA
- State GDP YoY
- ▲ 1.68%
- F500 in state
- 34
Industry mix (Fortune 500 HQ in PA)
| Industry | F500 HQs | Revenue |
|---|---|---|
| Healthcare | 2 | $309B |
|
||
| Insurance | 2 | $27B |
|
||
| Telecommunications / Media | 1 | $124B |
|
||
| Industrial Distribution | 1 | $22B |
|
||
| Financial Services | 1 | $20B |
|
||
| Chemicals / Materials | 1 | $18B |
|
||
Price history
+260.7% since first listed7 events — show timeline
- 2026-06-12 Sold (MLS) $110,000 CSMLS
- 2026-05-10 Pending — CSMLS
- 2026-05-06 Listed $99,900 CSMLS
- 2021-04-30 Sold (Public Records) $72,000 Public Records
- 2021-04-30 Sold (MLS) $72,000 CSMLS
- 2014-09-22 Sold (MLS) $30,500 CSMLS
- 2014-09-17 Sold (Public Records) $30,500 Public Records
Property tax history
+0.6%/yrLatest (2026): $1,225 · +0.0% YoY. Source: county tax records.
Cash-flow waterfall
monthlySold comps — $/sqft
last 12 mo · ≤1 miLoading sold comps…