 🏷️ Likely Rental
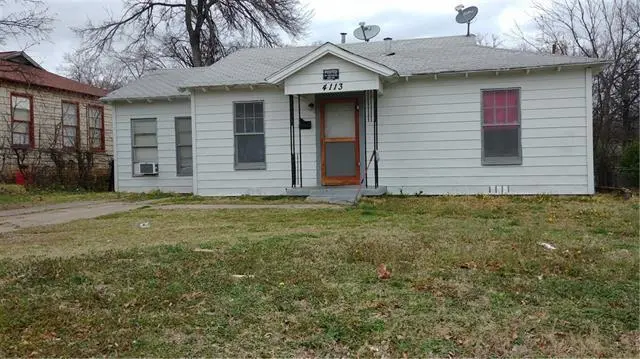
4113 Ave Ave N · Fort Worth, TX
Flood risk 1/10 · Minimal
- FEMA flood zone
- X (unshaded)
- Chance of flooding over 30 yrs
- 0.0%
- Est. flood insurance / yr
- $507 – $1,088
Fire risk 1/10 · Minimal
- Est. fire insurance / yr
- $1,222 – $2,270
Heat risk 7/10 · Major
- Hot days now (above 110°F)
- 7 days/yr
- Hot days in 30 yrs
- 22 days/yr
Wind risk 5/10 · Moderate
- Chance of severe wind over 30 yrs
- 26.0%
Air-quality risk 3/10 · Minor
- Unhealthy air days now
- 3 days/yr
- Unhealthy air days in 30 yrs
- 4 days/yr
Risk factors via First Street. Map © Google.
Why this score? — see what drove the B+ grade
The composite is a weighted blend of 9 inputs, each scored 0–100. Each bar is that input's sub-score; the figure is the points it added to the 100-point composite (weight × sub-score).
- Cash flow +30.0/30.0
- 1% rule +10.0/10.0
- DSCR +10.0/10.0
- Appreciation +10.0/10.0
- ARV discount +7.5/15.0
- Livability +4.0/5.0
- Rent growth +2.5/5.0
- Condition / age +2.5/5.0
- Schools +2.0/10.0
$84,900
🖨 Deal sheet (PDF) 📄 Offer letter ✓ Due diligence
Listing remarks
INVESTOR SPECIAL! BPO completed. Fantastic opportunity for a full rehab in a high-demand Section 8 area. Great potential for consistent cash flow. BPO has been completed for a streamlined process. Property is currently boarded and secured for safety—no interior showings available. Drive-by only. Please do not trespass. Selling strictly As-Is. OFFER REQUIREMENTS: All offers must include Proof of Funds. Please provide LLC Docs if purchasing as an entity, or a Photo ID if purchasing as an individual. Located in the established Eastover neighborhood of Fort Worth, this 3-bedroom, 2-bath single-story home offers a great opportunity for buyers or investors looking for value and potential. W
Key facts
- 6,970 sq ft lot
- Built 1949
- Listed 9 days
Property features AI
Finance
- Other: Subdivision: Eastover Add; Directions available
- Financial info: Cash offers only; Special listing condition: Real Estate Owned
- HOA & community: No association
Exterior
- Parking: Driveway (no garage or covered/carport spaces)
- Utilities: City water; City sewer; Not in a municipal utility district
- Home design: Single family residence; Residential property; Built in 1949; Not attached
- Construction: Frame construction; Composition roof; Pillar/post/pier foundation
- Exterior features: Covered rear porch; Covered porch(es); Interior lot in a subdivision
Interior
- Kitchen: No appliances included
- Bedrooms: 3 bedrooms (primary bedroom on level 1)
- Flooring: Combination
- Bathrooms: 2 full bathrooms
- Heating & cooling: Heating: Other; Cooling: Other
- Interior features: One level layout; Combination flooring; One living area; One dining area; Other interior features
- Laundry & utility: Washer hookup; Electric dryer hookup; Utility room
Neighborhood map
What this means for you Summary
Snapshot
- This is a 3-bed/1.0-bath single-family listed at $85k.
Deal economics
- At list price, monthly cash flow is $705 ($8k/yr) — positive.
- The deal already cash-flows at list — no discount required.
- Meets the 1% rule at list price ($2k rent vs $85k).
- Cap rate 16.3% vs local median 3.9% in Fort Worth — top-decile yield for the area; either an underpriced asset or a hidden risk that comps aren't pricing in. Stress-test before assuming the spread holds.
Location & tenants
- Location reads 80/100 on livability (#49 in TX, #1,954 nationally) — a professional / high-income tenant draw. Strengths: amenities A+, cost of living A+, housing A+; Watch: crime F.
- Fort Worth ISD (urban): math 18% / reading 28% proficiency, ranked #742 of 826 in TX (top 90%) — low school quality limits family demand, transient renter base, plan for 1-2y turnover; 73% free/reduced lunch — lower-income household profile, screen leases tightly.
- Zoned schools: S S Dillow El (math 16% / reading 17%, grade F, #3,946 of 4,322 statewide, top 92%, 398 students, 97% FRL) — zoned schools average 97% FRL vs 73% district-wide (24 pts higher); higher-poverty schools than district average — tighter screening recommended.
- Market conditions: 101 active listings in the ZIP; 20 comparable units currently listed for rent nearby; rentals at typical pace (median 26d on market — plan ~3-4 weeks tenant-placement turnaround); 40% of comp listings sitting > 30 days — soft ceiling on asking rent; 18,938 units permitted in Tarrant County in 2024 (8,336 in 5+ unit buildings).
- At $1,721/mo this rent would consume 45% of the median local household income ($46k/yr) (locally 884% of renters already pay >50% of income on rent) — very limited rent-growth headroom before tenants either downsize or default.
Forward outlook
- In year one you build about $9k of equity ($587 loan paydown + $8k appreciation (10.0% local appreciation)).
- Tarrant County population projected at +41% by 2050 — long-run rental-demand tailwind backs the buy-and-hold thesis.
- At projected returns (10.0% appreciation + 3.0% rent growth), your $24k cash investment doubles in ~2 years — after that, you're playing with house money.
- By year 4, paydown + projected appreciation supports a ~$32k cash-out refi (75% LTV) — recoverable capital for the next deal without selling this one.
Negotiation context
- Only 9 days on market — expect competitive offers; lowballing is unlikely to land.
- 8 sale attempts since 8y ago with the ask held roughly flat each time — persistent listings suggest the price (not the market) is what's stuck; bring a comps-based counter.
Risks & watch-outs
- Watch-outs: built in 1949 — expect roof / HVAC / electrical / plumbing capex.
- Climate carrying-cost: moderate wind risk, 26% chance of damaging wind over 30y; extreme-heat days projected 7→22/yr by 2055 (HVAC capex compounding) — expect insurance premiums to compound above CPI over the hold.
Questions for the listing agent
- Built in 1949 — when were the roof, HVAC, electrical panel, plumbing, and water heater last replaced?
- Is there a deadline driving the sale (1031 exchange, divorce, estate, relocation)? That informs how much negotiation room exists.
- Schools are D-rated, which usually means shorter tenancies and higher turnover. Who's the typical renter profile here, and what's been the actual vacancy rate?
- Crime grade is F in this area — have there been break-ins, vandalism, or insurance claims at this property in the last 3 years? What carrier currently insures it and at what premium?
- What's the average days-on-market for RENTAL listings here right now (not sales)? A rising rental-DOM trend means longer vacancies and softer asking-rent achievability than the comps imply.
- What's the recent tenant-quality profile in this submarket — average credit score on applications, eviction rate, late-payment / NSF rate, and stable-employment percentage? A property-management company in the area should have these aggregated.
- How much new for-sale + rental construction is in the pipeline within 1–3 miles? Heavy new supply typically softens prices + rents 12–24 months out; constrained supply supports both.
Investment metrics
- 1% rule
- 2.03% ✓
- Cap rate
- 16.26%
- Cash-on-cash
- 35.61%
- DSCR
- 2.58
- GRM
- 4.1
CMA / ARV
- ARV (median comp)
- $217,129
- List price
- $84,900
- Delta
- -42.43%
- Verdict
- UNDERPRICED
- Comps
- 20 within 1.0 mi
Show comp detail 12 sales within ~0.75 mi
| Address | Dist | Beds/Ba | Sqft | Sold | Price | $/sf | Match |
|---|---|---|---|---|---|---|---|
| 4249 Crenshaw Ave | 0.42mi | 3/2.0 | 1,456 (-3%) | 4mo | $234,900 | $161 | 68 |
| 1700 S Edgewood Ter | 0.64mi | 3/1.5 | 1,521 (+1%) | 1mo | $225,000 | $148 | 66 |
| 4001 Fitzhugh Ave | 0.44mi | 4/1.0 (+1) | 1,380 (-8%) | 1mo | $135,000 | $98 | 60 |
| 4133 Ave H | 0.37mi | 3/2.0 | 1,338 (-11%) | 4mo | $252,500 | $189 | 57 |
| 1616 Lindsey St | 0.71mi | 4/2.0 (+1) | 1,530 (+2%) | 2mo | $329,900 | $216 | 53 |
| 2729 Wallace St | 0.45mi | 4/2.0 (+1) | 1,624 (+8%) | 6mo | $235,000 | $145 | 52 |
| 1004 S Sargent St | 0.70mi | 3/2.0 | 1,616 (+7%) | 3mo | $305,000 | $189 | 49 |
| 1408 S Edgewood Ter | 0.72mi | 3/2.0 | 1,407 (-6%) | 5mo | $309,900 | $220 | 47 |
| 3423 Avenue N | 0.69mi | 4/3.5 (+1) | 1,465 (-3%) | 3mo | $245,000 | $167 | 46 |
| 3524 Ave Ave N | 0.58mi | 3/2.0 | 1,344 (-11%) | 7mo | $165,900 | $123 | 45 |
| 2509 Campbell St | 0.56mi | 3/2.0 | 1,280 (-15%) | 3mo | $240,000 | $188 | 42 |
| 4754 Ramey Ave | 0.73mi | 4/2.0 (+1) | 1,723 (+14%) | 3mo | $359,000 | $208 | 30 |
Match score weights: distance 35% · size 25% · config 20% · recency 20%. Top-matched comps best support the ARV.
Projected returns pro-forma
10.0% appreciation · 3.0% rent growth · sell at horizon
- IRR
- 51.6%
- Equity multiple
- 4.84×
- Total profit
- $91,232
- Equity at exit
- $76,485
- IRR
- 45.3%
- Equity multiple
- 10.82×
- Total profit
- $233,468
- Equity at exit
- $164,942
Cash invested: $23,772 (down + closing). Projections, not guarantees.
Landlord ↔ Tenant lean methodology
- Overall (STATE)
- 87 Strongly Landlord-Friendly
- State Texas
- 87 Strongly Landlord-Friendly · R+5
- County
- — inherits STATE
- City
- — inherits STATE
ZIP-level market 76105
- Home prices YoY
- 14.2%
- Active inventory
- 101
- Price-to-rent
- 4.1×
Monthly cashflow live
- Estimated rent
- $1,721 high interval (Pro) →
- Mortgage (P&I)
- −$445
- Tax from tax record
- −$173 /mo · $2,080/yr
- Insurance
- −$35
- HOA
- −$0
- Vacancy / Maint / Mgmt
- −$361
- Net cashflow
- $705
Break-even live
Sensitivity live
| Price | -10% $753 | -5% $729 | +0% $705 | +5% $681 | +10% $657 |
|---|---|---|---|---|---|
| Rent | -10% $569 | -5% $637 | +0% $705 | +5% $773 | +10% $841 |
| Rate | -1.0pp $748 | -0.5pp $727 | base $705 | +0.5pp $683 | +1.0pp $661 |
UW: 25.0% down · 7.5% · 30yr · 1.5% tax · 5.0% vac · 8.0% maint · 8.0% mgmt
Financing live
Cash to close
- Down payment
- $21,225
- Closing costs
- $2,547
- Reserves months
- —
- Total cash needed
- —
Loan-product check · same deal, 3 products live
Conventional
25% down · 7.5% · 30yr
- Down + closing
- —
- Monthly P&I
- —
- Monthly cashflow
- —
- DSCR
- —
- Eligible?
- —
Personal DTI + credit; lowest rate.
DSCR
20% down · 8.5% · 30yr
- Down + closing
- —
- Monthly P&I
- —
- Monthly cashflow
- —
- DSCR
- —
- Eligible?
- —
No personal income docs; deal must DSCR.
Hard money
10% down · 12.0% · 12mo
- Down + closing
- —
- Monthly P&I
- —
- Monthly cashflow
- —
- DSCR
- —
- Eligible?
- —
Short-term bridge; refi at stabilization.
Rent comps 20 comps
| Address | Beds | Baths | Sqft | Rent | $/sqft | DOM | Units | Dist |
|---|---|---|---|---|---|---|---|---|
| 3816 Avenue N Fort Worth, TX | 3.0 | 1.0 | 1108 | $1,550 | $1.40 | 7d | 1 | 0.27mi |
| 2302 Coleman Ave Fort Worth, TX | 3.0 | 2.0 | 1960 | $1,550 | $0.79 | 45d | 1 | 0.28mi |
| 3731 Avenue M Unit M Fort Worth, TX | 3.0 | 2.0 | 1425 | $1,900 | $1.33 | 24d | 1 | 0.33mi |
| 3921 Avenue H Unit H Fort Worth, TX | 3.0 | 2.0 | 1064 | $1,550 | $1.46 | 8d | 1 | 0.37mi |
| 2701 Vogt St Fort Worth, TX | 3.0 | 2.0 | 1090 | $1,475 | $1.35 | 15d | 1 | 0.37mi |
| 4312 Lorin Ave Fort Worth, TX | 4.0 | 2.0 | 1230 | $2,000 | $1.63 | 45d | 1 | 0.39mi |
| 2500 S Edgewood Ter Fort Worth, TX | 1.0–3.0 | 1.0–2.5 | 1123 | $1,895 | $1.69 | 3d | 34 | 0.50mi |
| 3302 Avenue H Unit 3300 Fort Worth, TX | 2.0 | 1.0 | 1050 | $1,150 | $1.10 | 45d | 1 | 0.87mi |
| 3300 Avenue H Fort Worth, TX | 2.0 | 1.0 | 1050 | $1,150 | $1.10 | 45d | 1 | 0.87mi |
| 4929 Willie St Fort Worth, TX | 3.0 | 2.0 | 1386 | $1,650 | $1.19 | 0d | 1 | 0.99mi |
| 4929 Willie St Fort Worth, TX | 3.0 | 2.0 | 1386 | $1,650 | $1.19 | 6d | 1 | 0.99mi |
| 2912 Avenue K Fort Worth, TX | 3.0 | 1.5 | 1200 | $1,600 | $1.33 | 45d | 1 | 1.10mi |
| 2909 Avenue K Fort Worth, TX | 3.0 | 2.0 | 1490 | $700 | $0.47 | 45d | 1 | 1.12mi |
| 501 S Edgewood Ter Fort Worth, TX | 1.0–2.0 | 1.0–2.0 | 887 | $1,575 | $1.77 | 14d | 10 | 1.24mi |
| 1007 Tierney Rd Unit 1007 Fort Worth, TX | 2.0 | 1.0 | 1600 | $1,250 | $0.78 | 45d | 1 | 1.28mi |
| 2815 Avenue E Fort Worth, TX | 2.0 | 1.0 | 2096 | $1,200 | $0.57 | 26d | 1 | 1.32mi |
| 3983 Griggs Ct Fort Worth, TX | 3.0 | 1.0 | 1062 | $1,500 | $1.41 | 0d | 1 | 1.38mi |
| 5328 Carol Ave Fort Worth, TX | 4.0 | 2.0 | 1230 | $2,100 | $1.71 | 45d | 1 | 1.44mi |
| 5055 Virgil St Fort Worth, TX | 3.0 | 2.0 | 1089 | $1,650 | $1.52 | 26d | 1 | 1.45mi |
| 4336 Jana Dr Fort Worth, TX | 3.0 | 1.0 | 1070 | $1,650 | $1.54 | 6d | 1 | 1.46mi |
Listing history 18 events
-
2026-06-21days on market $84,900 Active 9 DOM
-
2026-06-18days on market $84,900 Active 6 DOM
-
2026-06-17days on market $84,900 Active 5 DOM
-
2026-06-16days on market $84,900 Active 4 DOM
-
2026-06-15days on market $84,900 Active 3 DOM
-
2026-06-13pricestatusdays on market $84,900 Active 1 DOM
-
2026-03-06$125,000 Active
-
2025-12-14price $135,000
-
2025-12-14status Active
-
2025-11-22$129,000 Active
-
2019-02-27soldstatus Sold
-
2018-03-19status Pending
-
2018-03-16status Active Option Contract
-
2018-03-05historical
-
2018-03-01price $67,700
-
2018-03-01status Active
-
2018-02-27historical
-
2018-02-27$75,250
ⓘ Source: listings_history table (triggers on properties + properties_extension) + one-shot
backfill from property_details.listing_events for pre-trigger history.
Tax reassessment forecast TX · Resets to sale price
- Current annual tax
- $2,080 · $173/mo
- Projected year-2 tax
- $2,080 · $173/mo
- Expected delta
- $0/yr ($0/mo · 0.0%)
ⓘ Screening estimate from a state-policy table — verify with the county assessor before closing.
Climate risk First Street
- Flood 1/10 Low FEMA zone X (unshaded) · 0% chance over 30 yrs
- Wildfire 1/10 Low
- Heat 7/10 Severe 7 d/yr ≥110°F today · 22 d/yr by 30 yrs out
- Wind 5/10 Major 26% chance of damaging wind over 30 yrs
- Air quality 3/10 Moderate 3 unhealthy d/yr today · 4 by 30 yrs out
Nearby sold comps map
Loading sold comps map…
Walkable amenities ~0.75 mi
Loading nearby amenities…
Taxation est. · year 1
- Rental income
- $20,647
- − Mortgage interest
- −$4,756
- − Property taxes
- −$2,080
- − Insurance
- −$424
- − Repairs & maintenance
- −$1,652
- − Management
- −$1,652
- − Depreciation
- −$2,470
- Taxable income
- $7,614
- Est. tax owed @ 24.0%
- −$1,827
- After-tax cash flow
- $6,637/yr
For passive investors: Depreciation is non-cash, so a rental often shows a tax loss while cash-flowing — sheltering income. Rental losses are passive: they offset passive income freely, and up to $25,000/yr can offset ordinary (W-2) income if you actively participate and your MAGI is under $100k (phasing out to $0 by $150k); unused losses carry forward. On sale, claimed depreciation is recaptured at up to 25%, and gains may owe capital-gains tax (a 1031 exchange can defer both). Figures are a year-1 estimate at your 24.0% rate — not tax advice; consult a CPA.
Schools (NCES district)
- District
- Fort Worth ISD
- NCES district ID
- 4819700
- Math proficiency
- 18% ▼ -16.00%
- Reading proficiency
- 28% ▼ -6.00%
- Median HH income
- $42,109
- Composite
- 19.61/100
- National rank
- #8753
- State rank
- #742 of 826 in TX
Livability — Fort Worth
- Score
- 80/100
- State rank
- #49
- US rank
- #1954
Category grades
Schools grade is shown separately in the Schools card above.
Census & demographics
- Census place
- Fort Worth, TX
- County
- Tarrant County · 2,033,669 people
- City population
- 911,619
- Metro
- Dallas-Fort Worth-Arlington, TX
- Population (ZIP)
- 22,228
- Household income
- $45,770
- Rent vs Own
- Severe rent burden
- 884.0
Population outlook (Tarrant County) Hauer SSP2
- Today (2025)
- 2,380,417 people
- By 2030
- 2,578,900 · +8.3%
- By 2040
- 2,974,995 · +25.0%
- By 2050
- 3,350,489 · +40.8%
- By 2075
- 4,216,909 · +77.2%
- By 2100
- 4,741,527 · +99.2%
Race, ethnicity, and origin ACS 2023
- Neighborhood character
- Majority Hispanic (63%)
- Race & ethnicity
- Hispanic / Latino 63% Black 29% Two or more races 24% White 6%
- Hispanic origin (detail)
- Mexican 57%
- Foreign-born
- 28% · Canada
- Languages at home
- 44% English-only · Spanish 55% Other Indo-European 1%
Political lean MEDSL · Tarrant
- 2024 margin
- Lean R (+5.1) · D 46.7% · R 51.9% · Other 1.4%
- 2008→2024 swing
- +6.6pp toward D · 2008: -11.7pp · 2024: -5.1pp
- All cycles
- 2024: R+5.1 2020: D+0.2 2016: R+8.7 2012: R+15.7 2008: R+11.7
Not yet ingested
- Civics
- —
Market trends
- HPI YoY
- ▲ 27.33%
- Current HPI
- 219.2657
- Rent YoY
- —
- Metro
- Dallas-Fort Worth-Arlington, TX
- State GDP YoY
- ▲ 3.95%
- F500 in state
- 110
Industry mix (Fortune 500 HQ in TX)
| Industry | F500 HQs | Revenue |
|---|---|---|
| Energy | 16 | $1,198B |
|
||
| Technology | 5 | $198B |
|
||
| Engineering / Construction | 4 | $72B |
|
||
| Energy Services | 3 | $60B |
|
||
| Utilities | 3 | $41B |
|
||
| Healthcare | 2 | $330B |
|
||
Price history
+12.8% since first listed15 events — show timeline
- 2026-06-12 Listed $84,900 NTREIS
- 2026-06-11 Relisted — NTREIS
- 2026-06-11 Listing Removed — NTREIS
- 2026-03-06 Listed $125,000 NTREIS
- 2025-12-14 Price Changed $135,000 NTREIS
- 2025-12-14 Relisted — NTREIS
- 2025-11-22 Listed $129,000 NTREIS
- 2019-02-27 Sold (MLS) — NTREIS
- 2018-03-19 Pending — NTREIS
- 2018-03-16 Relisted — NTREIS
- 2018-03-05 Listing Removed — NTREIS
- 2018-03-01 Price Changed $67,700 NTREIS
- 2018-03-01 Relisted — NTREIS
- 2018-02-27 Listed $75,250 NTREIS
- 2018-02-27 Listing Removed — NTREIS
Property tax history
+3.8%/yrLatest (2025): $2,080 · -10.0% YoY. Source: county tax records.
Cash-flow waterfall
monthlySold comps — $/sqft
last 12 mo · ≤1 miLoading sold comps…