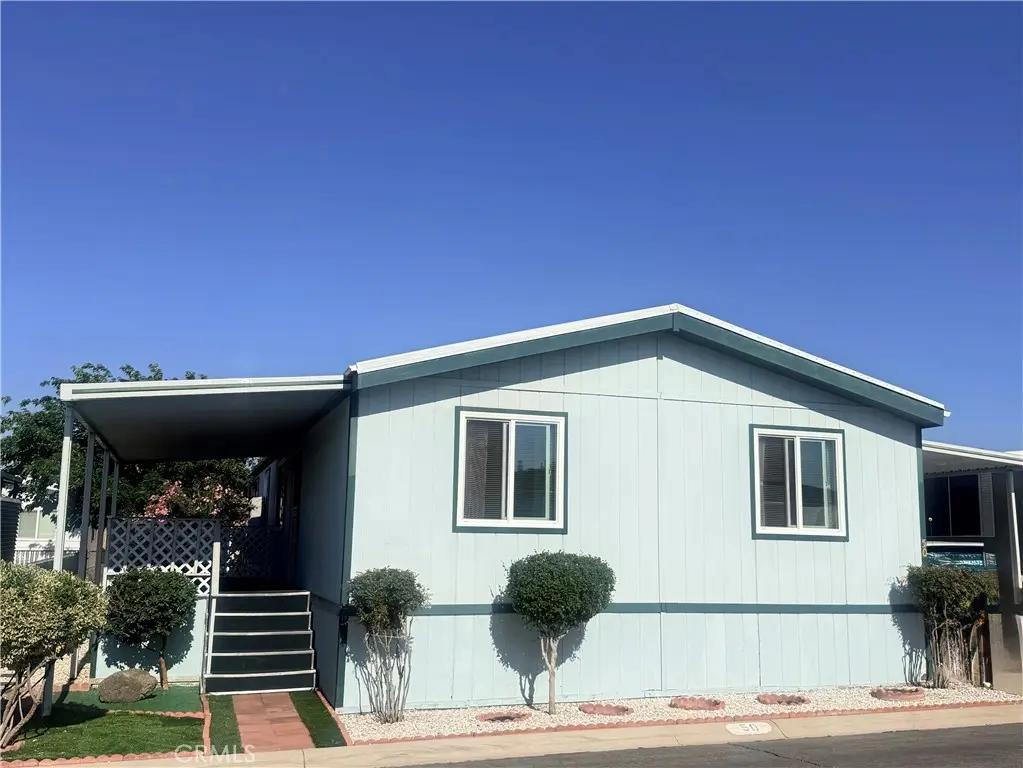
13393 Mariposa Rd #50 · Victorville, CA
Flood risk 6/10 · Moderate
- FEMA flood zone
- X (unshaded)
- Chance of flooding over 30 yrs
- 0.67%
- Est. flood insurance / yr
- $507 – $1,088
Fire risk 1/10 · Minimal
- Est. fire insurance / yr
- $659 – $1,223
Heat risk 7/10 · Major
- Hot days now (above 99°F)
- 3 days/yr
- Hot days in 30 yrs
- 8 days/yr
Wind risk 1/10 · Minimal
- Chance of severe wind over 30 yrs
- —
Air-quality risk 9/10 · Severe
- Unhealthy air days now
- 22 days/yr
- Unhealthy air days in 30 yrs
- 28 days/yr
Risk factors via First Street. Map © Google.
Why this score? — see what drove the C+ grade
The composite is a weighted blend of 9 inputs, each scored 0–100. Each bar is that input's sub-score; the figure is the points it added to the 100-point composite (weight × sub-score).
- Cash flow +30.0/30.0
- 1% rule +10.0/10.0
- DSCR +10.0/10.0
- Rent growth +3.6/5.0
- Livability +2.7/5.0
- Condition / age +2.5/5.0
- Schools +2.2/10.0
- ARV discount +0.0/15.0
- Appreciation +0.0/10.0
$98,900
🖨 Deal sheet 📄 Offer letter ✓ Due diligence
Listing remarks
Your new home awaits! This charming 3-bedroom, 2-bath home is located in one of Victorville’s most desirable senior parks, offering a vibrant community and great amenities including a clubhouse, tennis court, dog park, swimming pool, spa, and fitness room. Step inside to an open kitchen and a spacious living room with high ceilings—perfect for relaxing or entertaining. This home is move in ready, with some upgrades, new carpet in living room, and new kitchen floor, roof has just sealed, in addition double-pane windows, water heater, A/C dishwasher, swamp cooler and security side door were all installed from 2024-2025. The primary bedroom features its own private bathroom and a
Key facts
- Dog park
- Clubhouse
- Tennis court
Tags
Property features AI
Finance
- Other: Multi-unit body type: double
- Financial info: Land lease of $780 monthly (park); Rent includes: none
- HOA & community: Senior community; Community features include a dog park; Park name: Victor Villa; Manager approval required; Pets allowed
Exterior
- Parking: Carport; Parking included
- Utilities: Natural gas connected; Electricity connected (standard); Public/district water; Public sewer
- Home design: Single-story mobile home; Mobile home remains on site; Model 241940; Entry at ground level; Facing/entry level: 0
- Construction: Mobile home dimensions approximately 12' x 56'; 1 total story; Year built source: assessor
- Exterior features: Open patio; Community pool; Patio; 0–1 unit/acre lot density
Interior
- Kitchen: Gas range; Dishwasher; Water heater unit; Kitchen open to family room
- Bedrooms: All bedrooms located on the main level
- Flooring: Carpet; Laminate
- Bathrooms: 2 full bathrooms
- Heating & cooling: Central furnace heating; Central cooling
- Interior features: High ceilings (9 feet+); One-level layout; All bedrooms on the main level; Community spa
- Laundry & utility: Washer hookup; Gas dryer hookup; Has laundry
Neighborhood map
What this means for you Summary
Snapshot
- This is a 3-bed/2.0-bath manufactured listed at $99k.
Deal economics
- At list price, monthly cash flow is $1k ($15k/yr) — positive.
- The deal already cash-flows at list — no discount required.
- Meets the 1% rule at list price ($2k rent vs $99k).
- Recommended offer: $97k (1.5% below list) — sets the bar for market timing.
- Cap rate 21.7% vs local median 4.2% in Victorville — top-decile yield for the area; either an underpriced asset or a hidden risk that comps aren't pricing in. Stress-test before assuming the spread holds.
Location & tenants
- Location reads 54/100 on livability (#906 in CA) — a working-class tenant base; expect higher turnover. Strengths: housing A+; Watch: employment D+, schools D-, crime F.
- Victor Elementary (urban): math 25% / reading 25% proficiency, ranked #408 of 517 in CA (top 79%) — low school quality limits family demand, transient renter base, plan for 1-2y turnover; 70% free/reduced lunch — lower-income household profile, screen leases tightly.
- Market conditions: Rents rising fast (+4.3%/yr); 286 active listings in the ZIP; 20 comparable units currently listed for rent nearby; rentals leasing fast (median 2d on market — plan ~1-2 weeks tenant-placement turnaround); 5,458 units permitted in San Bernardino County in 2024 (1,500 in 5+ unit buildings).
- At $2,337/mo this rent would consume 45% of the median local household income ($62k/yr) (locally 2449% of renters already pay >50% of income on rent) — very limited rent-growth headroom before tenants either downsize or default.
Forward outlook
- Local home prices are declining (-3.0%/yr); year-one equity from $684 of loan paydown is wiped out by about $3k of value loss. Plan a longer hold.
- San Bernardino County population projected at +15% by 2050 — modest demand growth; plan on rents tracking national, not racing it.
- At projected returns (-3.0% appreciation + 4.3% rent growth), your $28k cash investment doubles in ~3 years — after that, you're playing with house money.
Negotiation context
- It's been on market 20 days — a 2% lower offer ($97k) is reasonable based on typical stale-listing flexibility.
Risks & watch-outs
- Climate carrying-cost: major flood risk; extreme-heat days projected 3→8/yr by 2055 (HVAC capex compounding) — expect insurance premiums to compound above CPI over the hold.
Questions for the listing agent
- Is there a deadline driving the sale (1031 exchange, divorce, estate, relocation)? That informs how much negotiation room exists.
- Schools are D-rated, which usually means shorter tenancies and higher turnover. Who's the typical renter profile here, and what's been the actual vacancy rate?
- Crime grade is F in this area — have there been break-ins, vandalism, or insurance claims at this property in the last 3 years? What carrier currently insures it and at what premium?
- What's the average days-on-market for RENTAL listings here right now (not sales)? A rising rental-DOM trend means longer vacancies and softer asking-rent achievability than the comps imply.
- What's the recent tenant-quality profile in this submarket — average credit score on applications, eviction rate, late-payment / NSF rate, and stable-employment percentage? A property-management company in the area should have these aggregated.
- How much new for-sale + rental construction is in the pipeline within 1–3 miles? Heavy new supply typically softens prices + rents 12–24 months out; constrained supply supports both.
Investment metrics
- 1% rule
- 2.36% ✓
- Cap rate
- 21.69%
- Cash-on-cash
- 55.00%
- DSCR
- 3.45
- GRM
- 3.5
CMA / ARV
- ARV (on-the-fly)
- $84,672
- Comps found
- 12
Show comp detail 12 sales within ~0.75 mi
| Address | Dist | Beds/Ba | Sqft | Sold | Price | $/sf | Match |
|---|---|---|---|---|---|---|---|
| 13393 Mariposa Rd Spc 251 Rd | 0.00mi | 3/2.0 | 1,320 (-2%) | 8mo | $115,000 | $87 | 91 |
| 13393 Mariposa Rd SPC 126 | 0.00mi | 2/2.0 (-1) | 1,344 (0%) | 6mo | $105,500 | $78 | 90 |
| 13393 Mariposa Rd #167 | 0.06mi | 3/2.0 | 1,344 (0%) | 9mo | $85,000 | $63 | 90 |
| 13393 Mariposa Rd #220 | 0.00mi | 2/2.0 (-1) | 1,368 (+2%) | 4mo | $65,000 | $48 | 89 |
| 13393 Mariposa Rd #255 | 0.00mi | 2/2.0 (-1) | 1,344 (0%) | 10mo | $112,000 | $83 | 86 |
| 13393 Mariposa Rd, #97 | 0.06mi | 3/2.0 | 1,440 (+7%) | 3mo | $90,600 | $63 | 82 |
| 13393 Mariposa Rd #92 | 0.00mi | 3/2.0 | 1,431 (+6%) | 10mo | $144,000 | $101 | 81 |
| 13393 Mariposa #114 | 0.00mi | 2/2.0 (-1) | 1,440 (+7%) | 4mo | $85,500 | $59 | 80 |
| 13393 Mariposa Rd #35 | 0.00mi | 3/2.0 | 1,464 (+9%) | 10mo | $65,000 | $44 | 77 |
| 13393 Mariposa #7 | 0.00mi | 3/2.0 | 1,152 (-14%) | 5mo | $67,000 | $58 | 72 |
| 13393 Mariposa Rd #42 | 0.00mi | 3/2.0 | 1,152 (-14%) | 11mo | $78,000 | $68 | 67 |
| 13393 Mariposa #188 | 0.24mi | 2/2.0 (-1) | 1,512 (+12%) | 6mo | $78,000 | $52 | 58 |
Match score weights: distance 35% · size 25% · config 20% · recency 20%. Top-matched comps best support the ARV.
Projected returns pro-forma
-3.0% appreciation · 4.27% rent growth · sell at horizon
- IRR
- 54.6%
- Equity multiple
- 3.45×
- Total profit
- $67,804
- Equity at exit
- $14,746
- IRR
- 60.1%
- Equity multiple
- 7.35×
- Total profit
- $175,747
- Equity at exit
- $8,551
Cash invested: $27,692 (down + closing). Projections, not guarantees.
Landlord ↔ Tenant lean methodology
- Overall (STATE)
- 18 Strongly Tenant-Friendly
- State California
- 18 Strongly Tenant-Friendly · D+13
- County
- — inherits STATE
- City
- — inherits STATE
ZIP-level market 92395
- Home prices YoY
- -14.7%
- Rents YoY
- 4.3%
- Active inventory
- 286
- Price-to-rent
- 3.5×
Monthly cashflow live
- Estimated rent
- $2,337 high interval (Pro) →
- Mortgage (P&I)
- −$519
- Tax from tax record
- −$18 /mo · $211/yr
- Insurance
- −$41
- HOA
- −$0
- Vacancy / Maint / Mgmt
- −$491
- Net cashflow
- $1,269
Break-even live
UW: 25.0% down · 7.5% · 30yr · 1.5% tax · 5.0% vac · 8.0% maint · 8.0% mgmt
Financing live
Cash to close
- Down payment
- $24,725
- Closing costs
- $2,967
- Reserves months
- —
- Total cash needed
- —
Loan-product check · same deal, 3 products live
Conventional
25% down · 7.5% · 30yr
- Down + closing
- —
- Monthly P&I
- —
- Monthly cashflow
- —
- DSCR
- —
- Eligible?
- —
Personal DTI + credit; lowest rate.
DSCR
20% down · 8.5% · 30yr
- Down + closing
- —
- Monthly P&I
- —
- Monthly cashflow
- —
- DSCR
- —
- Eligible?
- —
No personal income docs; deal must DSCR.
Hard money
10% down · 12.0% · 12mo
- Down + closing
- —
- Monthly P&I
- —
- Monthly cashflow
- —
- DSCR
- —
- Eligible?
- —
Short-term bridge; refi at stabilization.
Rent comps 20 comps
| Address | Beds | Baths | Sqft | Rent | $/sqft | DOM | Units | Dist |
|---|---|---|---|---|---|---|---|---|
| 15678 Inca Way Victorville, CA | 3.0 | 2.0 | 1399 | $2,200 | $1.57 | 16d | 1 | 0.20mi |
| 15563 Keokuk Way Victorville, CA | 4.0 | 2.0 | 1501 | $3,100 | $2.07 | 2d | 1 | 0.33mi |
| 13632 Nassau Dr Victorville, CA | 3.0 | 2.0 | 1298 | $1,990 | $1.53 | 1d | 1 | 0.38mi |
| 15450 Nisqualli Rd Victorville, CA | 1.0–3.0 | 1.0–2.0 | 940 | $2,681 | $2.85 | 1d | 4 | 0.44mi |
| 13024 Rainwood Ct Victorville, CA | 2.0 | 2.0 | 1159 | $1,800 | $1.55 | 1d | 1 | 0.56mi |
| 13601 Arroyo Dr Victorville, CA | 4.0 | 2.0 | 1339 | $2,300 | $1.72 | 10d | 1 | 0.58mi |
| 15663 Whispering Creek Way Victorville, CA | 4.0 | 2.0 | 1780 | $2,700 | $1.52 | 2d | 1 | 0.61mi |
| 13925 Burning Tree Dr Victorville, CA | 3.0 | 2.0 | 1440 | $2,250 | $1.56 | 1d | 1 | 0.84mi |
| 12692 Senecio Ave Victorville, CA | 3.0 | 2.0 | 1275 | $2,300 | $1.80 | 1d | 1 | 0.87mi |
| 16376 Appletree Ln Victorville, CA | 3.0 | 2.0 | 1544 | $2,450 | $1.59 | 1d | 1 | 1.07mi |
| 13520 Third Ave Victorville, CA | 2.0–3.0 | 2.0–2.5 | 1000 | $2,338 | $2.34 | 1d | 1 | 1.13mi |
| 14257 Sage St Victorville, CA | 3.0 | 3.0 | 1319 | $2,500 | $1.90 | 1d | 1 | 1.19mi |
| 14236 Oxford Pl Victorville, CA | 4.0 | 2.0 | 1445 | $2,350 | $1.63 | 2d | 1 | 1.22mi |
| 14344 Mcart Rd Victorville, CA | 2.0–3.0 | 2.0 | 1042 | $2,395 | $2.30 | 1d | 5 | 1.27mi |
| 14299 La Paz Dr Unit 3A Victorville, CA | 2.0 | 1.5 | 880 | $1,495 | $1.70 | 1d | 1 | 1.38mi |
| 13860 Navarro Dr Victorville, CA | 2.0 | 2.0 | 1255 | $1,850 | $1.47 | 1d | 1 | 1.44mi |
| 14374 Borego Rd Victorville, CA | 1.0–2.0 | 1.0–2.0 | 842 | $2,080 | $2.47 | 1d | 12 | 1.45mi |
| 15230 Seneca Rd Victorville, CA | 1.0–3.0 | 1.0–2.0 | 805 | $2,005 | $2.49 | 1d | 12 | 1.47mi |
| 16653 Sholic St Victorville, CA | 4.0 | 2.0 | 1546 | $2,095 | $1.36 | 15d | 1 | 1.48mi |
| 14599 Santa Fe Trl Victorville, CA | 3.0 | 2.0 | 1521 | $2,250 | $1.48 | 1d | 1 | 1.49mi |
Listing history 14 events
-
2026-06-18days on market $98,900 Active 20 DOM
-
2026-06-17days on market $98,900 Active 19 DOM
-
2026-06-16days on market $98,900 Active 18 DOM
-
2026-06-15days on market $98,900 Active 17 DOM
-
2026-06-13days on market $98,900 Active 15 DOM
-
2026-06-13days on market $98,900 Active 14 DOM
-
2026-06-09days on market $98,900 Active 11 DOM
-
2026-06-08days on market $98,900 Active 10 DOM
-
2026-06-07days on market $98,900 Active 9 DOM
-
2026-06-04days on market $98,900 Active 6 DOM
-
2026-06-03days on market $98,900 Active 5 DOM
-
2026-06-02days on market $98,900 Active 4 DOM
-
2026-06-01days on market $98,900 Active 3 DOM
-
2026-05-31days on market $98,900 Active 2 DOM
ⓘ Source: listings_history table (triggers on properties + properties_extension) + one-shot
backfill from property_details.listing_events for pre-trigger history.
Tax reassessment forecast CA · Resets to sale price
- Current annual tax
- $211 · $18/mo
- Projected year-2 tax
- $752 · $63/mo
- Expected delta
- +$541/yr (+$45/mo · 256.6%)
ⓘ Screening estimate from a state-policy table — verify with the county assessor before closing.
Climate risk First Street
- Flood 6/10 Major FEMA zone X (unshaded) · 67% chance over 30 yrs
- Wildfire 1/10 Low
- Heat 7/10 Severe 3 d/yr ≥99°F today · 8 d/yr by 30 yrs out
- Wind 1/10 Low
- Air quality 9/10 Extreme 22 unhealthy d/yr today · 28 by 30 yrs out
Nearby sold comps map
Loading sold comps map…
Walkable amenities ~0.75 mi
Loading nearby amenities…
Taxation est. · year 1
- Rental income
- $28,050
- − Mortgage interest
- −$5,540
- − Property taxes
- −$211
- − Insurance
- −$494
- − Repairs & maintenance
- −$2,244
- − Management
- −$2,244
- − Depreciation
- −$2,877
- Taxable income
- $14,439
- Est. tax owed @ 24.0%
- −$3,465
- After-tax cash flow
- $11,765/yr
For passive investors: Depreciation is non-cash, so a rental often shows a tax loss while cash-flowing — sheltering income. Rental losses are passive: they offset passive income freely, and up to $25,000/yr can offset ordinary (W-2) income if you actively participate and your MAGI is under $100k (phasing out to $0 by $150k); unused losses carry forward. On sale, claimed depreciation is recaptured at up to 25%, and gains may owe capital-gains tax (a 1031 exchange can defer both). Figures are a year-1 estimate at your 24.0% rate — not tax advice; consult a CPA.
Schools (NCES district)
- District
- Victor Elementary
- NCES district ID
- 0641040
- Math proficiency
- 25% ▬ 0.00%
- Reading proficiency
- 25% ▼ -9.00%
- Median HH income
- $44,949
- Composite
- 21.58/100
- National rank
- #8304
- State rank
- #408 of 517 in CA
Livability — Victorville
- Score
- 54/100
- State rank
- #906
- US rank
- #24038
Category grades
Schools grade is shown separately in the Schools card above.
Census & demographics
- Census place
- Victorville, CA
- County
- San Bernardino County · 2,030,291 people
- City population
- 154,418
- Metro
- Riverside-San Bernardino-Ontario, CA
- Population (ZIP)
- 47,375
- Household income
- $62,102
- Rent vs Own
- Severe rent burden
- 2449.0
Population outlook (San Bernardino County) Hauer SSP2
- Today (2025)
- 2,300,329 people
- By 2030
- 2,378,907 · +3.4%
- By 2040
- 2,523,137 · +9.7%
- By 2050
- 2,642,388 · +14.9%
- By 2075
- 2,880,769 · +25.2%
- By 2100
- 2,909,436 · +26.5%
Race, ethnicity, and origin ACS 2023
- Neighborhood character
- Diverse neighborhood (Simpson 0.65)
- Race & ethnicity
- Hispanic / Latino 49% White 30% Two or more races 19% Black 13% Asian 4% Native American 1%
- Hispanic origin (detail)
- Mexican 40% Puerto Rican 1%
- Common ancestry
- Romanian 1% Slovak 1% Portuguese 1%
- Foreign-born
- 18% · Canada, South Korea, Guatemala
- Languages at home
- 63% English-only · Spanish 31% Tagalog/Filipino 1% Arabic 1%
Political lean MEDSL · San Bernardino
- 2024 margin
- Toss-up / Even · D 47.5% · R 49.7% · Other 2.8%
- 2008→2024 swing
- -8.5pp toward R · 2008: 6.3pp · 2024: -2.1pp
- All cycles
- 2024: R+2.1 2020: D+10.7 2016: D+9.8 2012: D+5.4 2008: D+6.3
Not yet ingested
- Civics
- —
Market trends
- HPI YoY
- ▼ -68.10%
- Current HPI
- 395.2836
- Rent YoY
- ▲ 4.27%
- Metro
- Riverside-San Bernardino-Ontario, CA
- State GDP YoY
- ▲ 3.21%
- F500 in state
- 116
Industry mix (Fortune 500 HQ in CA)
| Industry | F500 HQs | Revenue |
|---|---|---|
| Technology | 27 | $1,492B |
|
||
| Financial Services | 3 | $174B |
|
||
| Retail | 3 | $44B |
|
||
| Insurance | 3 | $26B |
|
||
| Media / Entertainment | 2 | $115B |
|
||
| Pharmaceuticals / Biotech | 2 | $62B |
|
||
Price history
1 event — show timeline
- 2026-05-29 Listed $98,900 CRMLS
Property tax history
-0.8%/yrLatest (2025): $211 · +5.1% YoY. Source: county tax records.
Cash-flow waterfall
monthlySold comps — $/sqft
last 12 mo · ≤1 miLoading sold comps…