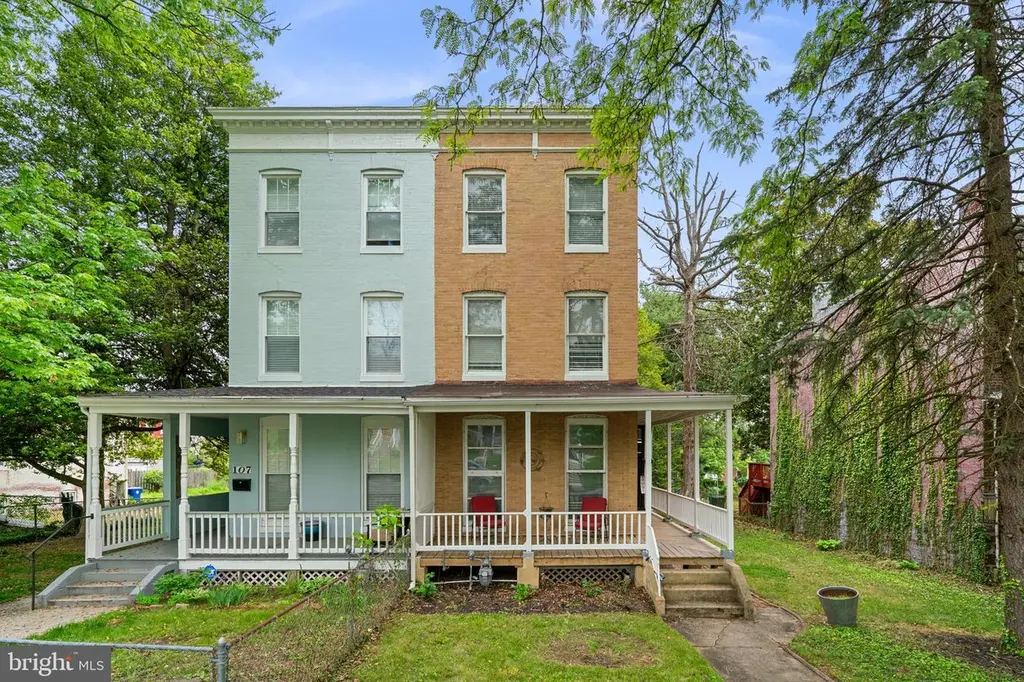
109 S Augusta Ave · Baltimore, MD
Flood risk 1/10 · Minimal
- FEMA flood zone
- X (unshaded)
- Chance of flooding over 30 yrs
- 0.0%
- Est. flood insurance / yr
- $473 – $860
Fire risk 1/10 · Minimal
- Est. fire insurance / yr
- $755 – $1,403
Heat risk 7/10 · Major
- Hot days now (above 103°F)
- 7 days/yr
- Hot days in 30 yrs
- 15 days/yr
Wind risk 5/10 · Moderate
- Chance of severe wind over 30 yrs
- 24.0%
Air-quality risk 3/10 · Minor
- Unhealthy air days now
- 3 days/yr
- Unhealthy air days in 30 yrs
- 4 days/yr
Risk factors via First Street. Map © Google.
Why this score? — see what drove the C grade
The composite is a weighted blend of 9 inputs, each scored 0–100. Each bar is that input's sub-score; the figure is the points it added to the 100-point composite (weight × sub-score).
- Cash flow +22.0/30.0
- ARV discount +9.6/15.0
- DSCR +7.0/10.0
- 1% rule +5.3/10.0
- Rent growth +3.8/5.0
- Livability +3.8/5.0
- Condition / age +2.5/5.0
- Schools +1.0/10.0
- Appreciation +0.0/10.0
$230,000
🖨 Deal sheet (PDF) 📄 Offer letter ✓ Due diligence
Listing remarks
Unlock the door to your future with an exclusive offer: Qualify for an exceptional 5.5% financing rate for one year OR $12,500 in down payment assistance meaning no down payment is required. ARM financing also available at 5.625% rate for 5 years. Charming three-story townhouse offering 4 bedrooms, 2 bathrooms, and 1,932 finished square feet, ideally located in established Irvington. A spacious wraparound front porch creates a warm and inviting first impression. // Inside, the main level features recently installed luxury vinyl plank flooring (2025) and a welcoming foyer. French doors open to a sunlit formal living room with floor-to-ceiling windows, while opposite, a versatile family or di
Key facts
- Built 1920
- Listed 49 days
Property features AI
Exterior
- Parking: On-street parking
- Utilities: Public water; Public sewer; Natural gas hot water; Natural gas heating; Electric for cooling
- Home design: End of row townhouse; Fee simple ownership
- Construction: Brick and frame construction; Shingle roof; Permanent foundation; Basement with full, unfinished interior access via connecting stairway (below-grade footprint covers property); Above-grade and below-grade structures noted; Year built (assessor)
- Exterior features: Patio(s); Not in a federal flood zone
Interior
- Kitchen: Gas oven/range; Range hood; Refrigerator
- Bedrooms: One bedroom on the main level; Two bedrooms on the first upper level; Two bedrooms on the second upper level
- Flooring: Luxury vinyl plank; Carpet; Wood floors
- Bathrooms: Two full bathrooms (one on main level, one on upper level)
- Heating & cooling: Forced air heating (natural gas); Ceiling fan cooling (electric)
- Interior features: Ceiling fans; Carpet; Crown molding; Curved staircase; Dining area; Family room off kitchen; Gourmet kitchen; Master bath(s); Wood floors; Drywall
- Laundry & utility: Main-floor laundry; High-efficiency water heater
Neighborhood map
What this means for you Summary
Snapshot
- This is a 5-bed/2.0-bath townhouse listed at $230k.
Deal economics
- At list price, monthly cash flow is $367 ($4k/yr) — positive.
- The deal already cash-flows at list — no discount required.
- Meets the 1% rule at list price ($2k rent vs $230k).
- Recommended offer: $223k (3.0% below list) — sets the bar for market timing.
- Cap rate 8.2% vs local median 6.0% in Baltimore — top-decile yield for the area; either an underpriced asset or a hidden risk that comps aren't pricing in. Stress-test before assuming the spread holds.
Location & tenants
- Location reads 76/100 on livability (#90 in MD, #3,396 nationally) — a middle-class / working-renter tenant base. Strengths: amenities A+, commute A+, housing A+; Watch: schools D, crime F.
- Baltimore City Public Schools (urban): math 7% / reading 16% proficiency, ranked #24 of 24 in MD (top 100%) — low school quality limits family demand, transient renter base, plan for 1-2y turnover; 79% free/reduced lunch — lower-income household profile, screen leases tightly.
- Market conditions: Rents rising fast (+5.4%/yr); 252 active listings in the ZIP; 7 comparable units currently listed for rent nearby; rentals at typical pace (median 25d on market — plan ~3-4 weeks tenant-placement turnaround); 43% of comp listings sitting > 30 days — soft ceiling on asking rent; 1,273 units permitted in Baltimore city in 2024 (1,104 in 5+ unit buildings).
- At $2,366/mo this rent would consume 47% of the median local household income ($60k/yr) (locally 2776% of renters already pay >50% of income on rent) — very limited rent-growth headroom before tenants either downsize or default.
Forward outlook
- Local home prices are declining (-3.0%/yr); year-one equity from $2k of loan paydown is wiped out by about $7k of value loss. Plan a longer hold.
- Baltimore County population projected to shrink 4% by 2050 — rents likely to lag national; underwrite the cash flow, not the appreciation.
- At projected returns (-3.0% appreciation + 5.4% rent growth), your $64k cash investment doubles in ~10 years — after that, you're playing with house money.
Negotiation context
- It's been on market 49 days — a 3% lower offer ($223k) is reasonable based on typical stale-listing flexibility.
- 13 sale attempts since 26y ago; this cycle's ask has dropped $20k (8%) from the opening price — seller is motivated, your offer sets the floor, not the list.
- Current owner paid $84k; list at $230k implies a 175% gain — meaningful room to come down on a strong offer.
Risks & watch-outs
- Watch-outs: built in 1920 — expect roof / HVAC / electrical / plumbing capex.
- Climate carrying-cost: moderate wind risk, 24% chance of damaging wind over 30y; extreme-heat days projected 7→15/yr by 2055 (HVAC capex compounding) — expect insurance premiums to compound above CPI over the hold.
Questions for the listing agent
- It's been on market 49 days. Have you received any prior offers? Is the seller open to a 3% concession, seller financing, or rate buy-down credit?
- Built in 1920 — when were the roof, HVAC, electrical panel, plumbing, and water heater last replaced?
- Is there a deadline driving the sale (1031 exchange, divorce, estate, relocation)? That informs how much negotiation room exists.
- Schools are D-rated, which usually means shorter tenancies and higher turnover. Who's the typical renter profile here, and what's been the actual vacancy rate?
- Crime grade is F in this area — have there been break-ins, vandalism, or insurance claims at this property in the last 3 years? What carrier currently insures it and at what premium?
- What's the average days-on-market for RENTAL listings here right now (not sales)? A rising rental-DOM trend means longer vacancies and softer asking-rent achievability than the comps imply.
- What's the recent tenant-quality profile in this submarket — average credit score on applications, eviction rate, late-payment / NSF rate, and stable-employment percentage? A property-management company in the area should have these aggregated.
- How much new for-sale + rental construction is in the pipeline within 1–3 miles? Heavy new supply typically softens prices + rents 12–24 months out; constrained supply supports both.
Investment metrics
- 1% rule
- 1.03% ✓
- Cap rate
- 8.21%
- Cash-on-cash
- 6.85%
- DSCR
- 1.30
- GRM
- 8.1
CMA / ARV
- ARV (median comp)
- $241,116
- List price
- $230,000
- Delta
- -4.61%
- Verdict
- FAIR
- Comps
- 20 within 1.0 mi
Show comp detail 12 sales within ~0.75 mi
| Address | Dist | Beds/Ba | Sqft | Sold | Price | $/sf | Match |
|---|---|---|---|---|---|---|---|
| 3804 Old Frederick Rd | 0.26mi | 5/2.5 | 1,872 (-3%) | 1mo | $250,000 | $134 | 80 |
| 4404 Frederick Ave | 0.31mi | 4/2.0 (-1) | 1,880 (-3%) | 5mo | $240,000 | $128 | 72 |
| 405 N Loudon Ave | 0.51mi | 5/2.0 | 1,896 (-2%) | 2mo | $175,000 | $92 | 72 |
| 327 Lyndhurst St | 0.52mi | 4/2.5 (-1) | 1,953 (+1%) | 4mo | $216,000 | $111 | 64 |
| 414 Normandy Ave | 0.53mi | 4/3.5 (-1) | 1,976 (+2%) | 1mo | $255,000 | $129 | 60 |
| 4413 Maple Wood Dr | 0.48mi | 4/3.5 (-1) | 1,980 (+2%) | 9mo | $345,000 | $174 | 55 |
| 307 Old Frederick Mews | 0.49mi | 4/3.5 (-1) | 1,996 (+3%) | 9mo | $367,500 | $184 | 53 |
| 24 S Tremont Rd | 0.59mi | 4/2.0 (-1) | 1,800 (-7%) | 5mo | $220,000 | $122 | 52 |
| 4515 Maple Wood Dr | 0.59mi | 4/3.5 (-1) | 2,056 (+6%) | 2mo | $351,000 | $171 | 49 |
| 3805 Harlem Ave | 0.74mi | 4/1.5 (-1) | 1,867 (-3%) | 7mo | $82,500 | $44 | 48 |
| 513 Normandy Ave | 0.59mi | 4/2.0 (-1) | 2,160 (+12%) | 1mo | $257,000 | $119 | 47 |
| 4526 Birchwood Dr | 0.56mi | 4/3.5 (-1) | 2,196 (+14%) | 8mo | $285,000 | $130 | 33 |
Match score weights: distance 35% · size 25% · config 20% · recency 20%. Top-matched comps best support the ARV.
Projected returns pro-forma
-3.0% appreciation · 5.38% rent growth · sell at horizon
- IRR
- -3.3%
- Equity multiple
- 0.87×
- Total profit
- $-8,089
- Equity at exit
- $34,294
- IRR
- 8.8%
- Equity multiple
- 1.75×
- Total profit
- $48,002
- Equity at exit
- $19,886
Cash invested: $64,400 (down + closing). Projections, not guarantees.
Landlord ↔ Tenant lean methodology
- Overall (CITY)
- 12 Strongly Tenant-Friendly
- State Maryland
- 27 Tenant-Leaning · D+14
- County
- — inherits STATE
- City Baltimore
- 12 Strongly Tenant-Friendly · D+58
ZIP-level market 21229
- Rents YoY
- 5.4%
- Active inventory
- 252
- Price-to-rent
- 8.1×
Monthly cashflow live
- Estimated rent
- $2,366 high interval (Pro) →
- Mortgage (P&I)
- −$1,206
- Tax from tax record
- −$200 /mo · $2,396/yr
- Insurance
- −$96
- HOA
- −$0
- Vacancy / Maint / Mgmt
- −$497
- Net cashflow
- $367
Break-even live
Sensitivity live
| Price | -10% $498 | -5% $432 | +0% $367 | +5% $302 | +10% $237 |
|---|---|---|---|---|---|
| Rent | -10% $180 | -5% $274 | +0% $367 | +5% $461 | +10% $554 |
| Rate | -1.0pp $483 | -0.5pp $426 | base $367 | +0.5pp $308 | +1.0pp $247 |
UW: 25.0% down · 7.5% · 30yr · 1.5% tax · 5.0% vac · 8.0% maint · 8.0% mgmt
Financing live
Cash to close
- Down payment
- $57,500
- Closing costs
- $6,900
- Reserves months
- —
- Total cash needed
- —
Loan-product check · same deal, 3 products live
Conventional
25% down · 7.5% · 30yr
- Down + closing
- —
- Monthly P&I
- —
- Monthly cashflow
- —
- DSCR
- —
- Eligible?
- —
Personal DTI + credit; lowest rate.
DSCR
20% down · 8.5% · 30yr
- Down + closing
- —
- Monthly P&I
- —
- Monthly cashflow
- —
- DSCR
- —
- Eligible?
- —
No personal income docs; deal must DSCR.
Hard money
10% down · 12.0% · 12mo
- Down + closing
- —
- Monthly P&I
- —
- Monthly cashflow
- —
- DSCR
- —
- Eligible?
- —
Short-term bridge; refi at stabilization.
Rent comps 7 comps
| Address | Beds | Baths | Sqft | Rent | $/sqft | DOM | Units | Dist |
|---|---|---|---|---|---|---|---|---|
| 409 Normandy Ave Baltimore, MD | 4.0 | 1.0 | 1640 | $1,500 | $0.91 | 24d | 1 | 0.50mi |
| 405 N Edgewood St Baltimore, MD | 4.0 | 2.0 | 1408 | $2,950 | $2.10 | 5d | 1 | 0.68mi |
| 3619 Edmondson Ave Baltimore, MD | 4.0 | 3.5 | 1962 | $2,800 | $1.43 | 44d | 1 | 0.69mi |
| 3507 Edmondson Ave Baltimore, MD | 4.0 | 2.0 | 1428 | $2,300 | $1.61 | 44d | 1 | 0.74mi |
| 623 N Grantley St Baltimore, MD | 4.0 | 2.0 | 1250 | $2,000 | $1.60 | 24d | 1 | 0.79mi |
| 730 Linnard St Unit 1 Baltimore, MD | 4.0 | 1.0 | 1360 | $1,750 | $1.29 | 24d | 1 | 0.87mi |
| 715 N Rosedale St Baltimore, MD | 5.0 | 3.0 | 1542 | $2,550 | $1.65 | 44d | 1 | 1.15mi |
Listing history 50 events
-
2026-06-18days on market $230,000 Active 49 DOM
-
2026-06-17days on market $230,000 Active 48 DOM
-
2026-06-16pricedays on market $230,000 Active 47 DOM
-
2026-06-15days on market $240,000 Active 46 DOM
-
2026-06-13days on market $240,000 Active 44 DOM
-
2026-06-09days on market $240,000 Active 40 DOM
-
2026-06-08days on market $240,000 Active 39 DOM
-
2026-06-07days on market $240,000 Active 38 DOM
-
2026-06-04days on market $240,000 Active 35 DOM
-
2026-06-03days on market $240,000 Active 34 DOM
-
2026-06-02days on market $240,000 Active 33 DOM
-
2026-06-01days on market $240,000 Active 32 DOM
-
2026-05-31days on market $240,000 Active 31 DOM
-
2026-04-30$250,000 Active 1307-char remark
-
2026-04-28price $250,000 1307-char remark
-
2026-04-28historical $265,000 1307-char remark
-
2025-11-19historical
-
2025-11-17price $265,000
-
2025-08-26price $279,999
-
2025-07-19price $299,999
-
2025-05-21$305,000 Active
-
2025-05-20historical
-
2023-11-24historical
-
2023-11-09$60,000 Active
-
2023-11-09historical
-
2023-10-04price $187,000
-
2023-08-29price $192,500
-
2023-08-21$199,500 Active
-
2023-08-10historical
-
2023-07-20price $199,999
-
2023-06-17price $215,000
-
2023-06-07price $235,000
-
2023-06-04$250,000 Active
-
2023-01-27historical
-
2023-01-22price $165,000
-
2023-01-11status Active
-
2023-01-09historical Active Under Contract
-
2023-01-09status Active
-
2023-01-08price $167,000
-
2023-01-07historical Active Under Contract
-
2022-12-16status Pending
-
2022-12-13historical Active Under Contract
-
2022-11-16price $175,000
-
2022-11-11$194,500 Active
-
2022-11-08historical
-
2022-10-25historical
-
2022-10-07$165,000 Active
-
2022-09-30historical
-
2018-09-18historical
-
2018-09-18historical Withdrawn
ⓘ Source: listings_history table (triggers on properties + properties_extension) + one-shot
backfill from property_details.listing_events for pre-trigger history.
Tax reassessment forecast MD · Partial reset (capped growth)
- Current annual tax
- $2,396 · $200/mo
- Projected year-2 tax
- $2,451 · $204/mo
- Expected delta
- +$56/yr (+$5/mo · 2.3%)
ⓘ Screening estimate from a state-policy table — verify with the county assessor before closing.
Climate risk First Street
- Flood 1/10 Low FEMA zone X (unshaded) · 0% chance over 30 yrs
- Wildfire 1/10 Low
- Heat 7/10 Severe 7 d/yr ≥103°F today · 15 d/yr by 30 yrs out
- Wind 5/10 Major 24% chance of damaging wind over 30 yrs
- Air quality 3/10 Moderate 3 unhealthy d/yr today · 4 by 30 yrs out
Nearby sold comps map
Loading sold comps map…
Walkable amenities ~0.75 mi
Loading nearby amenities…
Taxation est. · year 1
- Rental income
- $28,390
- − Mortgage interest
- −$12,884
- − Property taxes
- −$2,396
- − Insurance
- −$1,150
- − Repairs & maintenance
- −$2,271
- − Management
- −$2,271
- − Depreciation
- −$6,691
- Taxable income
- $727
- Est. tax owed @ 24.0%
- −$175
- After-tax cash flow
- $4,234/yr
For passive investors: Depreciation is non-cash, so a rental often shows a tax loss while cash-flowing — sheltering income. Rental losses are passive: they offset passive income freely, and up to $25,000/yr can offset ordinary (W-2) income if you actively participate and your MAGI is under $100k (phasing out to $0 by $150k); unused losses carry forward. On sale, claimed depreciation is recaptured at up to 25%, and gains may owe capital-gains tax (a 1031 exchange can defer both). Figures are a year-1 estimate at your 24.0% rate — not tax advice; consult a CPA.
Schools (NCES district)
- District
- Baltimore City Public Schools
- NCES district ID
- 2400090
- Math proficiency
- 7% ▼ -9.00%
- Reading proficiency
- 16% ▼ -5.00%
- Median HH income
- $42,108
- Composite
- 10.08/100
- National rank
- #9805
- State rank
- #24 of 24 in MD
Livability — Baltimore
- Score
- 76/100
- State rank
- #90
- US rank
- #3396
Category grades
Schools grade is shown separately in the Schools card above.
Census & demographics
- Census place
- Baltimore, MD
- County
- Baltimore City · 558,601 people
- City population
- 588,727
- Metro
- Baltimore-Columbia-Towson, MD
- Population (ZIP)
- 46,679
- Household income
- $60,047
- Rent vs Own
- Severe rent burden
- 2776.0
Population outlook (Baltimore County) Hauer SSP2
- Today (2025)
- 624,249 people
- By 2030
- 621,541 · -0.4%
- By 2040
- 609,756 · -2.3%
- By 2050
- 597,249 · -4.3%
- By 2075
- 552,236 · -11.5%
- By 2100
- 513,934 · -17.7%
Race, ethnicity, and origin ACS 2023
- Neighborhood character
- Predominantly Black (73%)
- Race & ethnicity
- Black 73% White 15% Hispanic / Latino 6% Two or more races 4% Asian 3%
- Hispanic origin (detail)
- Common ancestry
- Lithuanian 1% Romanian 1% Serbian 1%
- Foreign-born
- 5% · Canada, Philippines
- Languages at home
- 91% English-only · Spanish 4% Other Indo-European 2% Other Asian/Pacific 1%
Political lean MEDSL · Baltimore
- 2024 margin
- Solid D (+73.0) · D 85.2% · R 12.2% · Other 2.6%
- 2008→2024 swing
- -2.5pp toward R · 2008: 75.5pp · 2024: 73.0pp
- All cycles
- 2024: D+73.0 2020: D+76.6 2016: D+74.6 2012: D+76.4 2008: D+75.5
Not yet ingested
- Civics
- —
Market trends
- HPI YoY
- ▼ -259.07%
- Current HPI
- 226.896
- Rent YoY
- ▲ 5.38%
- Metro
- Baltimore-Columbia-Towson, MD
- State GDP YoY
- ▲ 2.97%
- F500 in state
- 12
Industry mix (Fortune 500 HQ in MD)
| Industry | F500 HQs | Revenue |
|---|---|---|
| Aerospace / Defense | 1 | $71B |
|
||
| Utilities | 1 | $25B |
|
||
| Hotels | 1 | $24B |
|
||
| Consumer Goods | 1 | $7B |
|
||
| Real Estate | 1 | $6B |
|
||
| Chemicals | 1 | $2B |
|
||
Price history
+253.8% since first listed52 events — show timeline
- 2026-06-15 Price Changed $230,000 BRIGHT MLS
- 2026-05-29 Price Changed $240,000 BRIGHT MLS
- 2026-04-30 Listed $250,000 BRIGHT MLS
- 2026-04-28 Price Changed $250,000 BRIGHT MLS
- 2026-04-28 Coming Soon $265,000 BRIGHT MLS
- 2025-11-19 Listing Removed — BRIGHT MLS
- 2025-11-17 Price Changed $265,000 BRIGHT MLS
- 2025-08-26 Price Changed $279,999 BRIGHT MLS
- 2025-07-19 Price Changed $299,999 BRIGHT MLS
- 2025-05-21 Listed $305,000 BRIGHT MLS
- 2025-05-20 Coming Soon — BRIGHT MLS
- 2023-11-24 Listing Removed — BRIGHT MLS
- 2023-11-09 Listing Removed — BRIGHT MLS
- 2023-11-09 Listed $60,000 BRIGHT MLS
- 2023-10-04 Price Changed $187,000 BRIGHT MLS
- 2023-08-29 Price Changed $192,500 BRIGHT MLS
- 2023-08-21 Listed $199,500 BRIGHT MLS
- 2023-08-10 Listing Removed — BRIGHT MLS
- 2023-07-20 Price Changed $199,999 BRIGHT MLS
- 2023-06-17 Price Changed $215,000 BRIGHT MLS
- 2023-06-07 Price Changed $235,000 BRIGHT MLS
- 2023-06-04 Listed $250,000 BRIGHT MLS
- 2023-01-27 Listing Removed — BRIGHT MLS
- 2023-01-22 Price Changed $165,000 BRIGHT MLS
- 2023-01-11 Relisted — BRIGHT MLS
- 2023-01-09 Contingent — BRIGHT MLS
- 2023-01-09 Relisted — BRIGHT MLS
- 2023-01-08 Price Changed $167,000 BRIGHT MLS
- 2023-01-07 Contingent — BRIGHT MLS
- 2022-12-16 Pending — BRIGHT MLS
- 2022-12-13 Contingent — BRIGHT MLS
- 2022-11-16 Price Changed $175,000 BRIGHT MLS
- 2022-11-11 Listed $194,500 BRIGHT MLS
- 2022-11-08 Coming Soon — BRIGHT MLS
- 2022-10-25 Listing Removed — BRIGHT MLS
- 2022-10-07 Listed $165,000 BRIGHT MLS
- 2022-09-30 Coming Soon — BRIGHT MLS
- 2018-09-18 Listing Removed — BRIGHT MLS
- 2018-09-18 Delisted — MRIS
- 2018-07-17 Price Changed $119,900 BRIGHT MLS
- 2018-07-17 Price Changed — MRIS
- 2018-07-03 Price Changed $135,000 BRIGHT MLS
- 2018-07-03 Price Changed — MRIS
- 2018-04-30 Listed — MRIS
- 2018-04-30 Listed $140,000 BRIGHT MLS
- 2007-05-28 Sold (MLS) $83,500 MRIS
- 2007-02-20 Delisted — MRIS
- 2007-02-16 Listed $79,900 MRIS
- 2000-12-01 Sold (MLS) $48,000 MRIS
- 2000-09-15 Delisted — MRIS
- 2000-02-16 Listed $48,000 MRIS
- 1993-04-19 Sold (Public Records) $65,000 Public Records
Property tax history
+0.9%/yrLatest (2025): $2,396 · +5.5% YoY. Source: county tax records.
Cash-flow waterfall
monthlySold comps — $/sqft
last 12 mo · ≤1 miLoading sold comps…