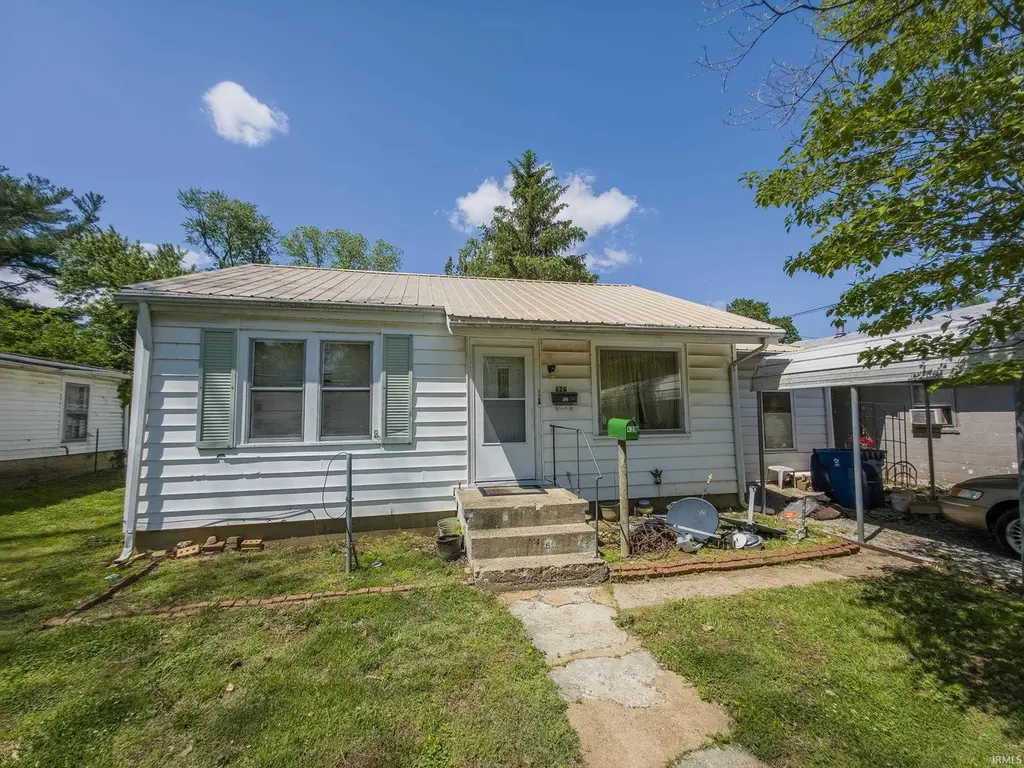
426 E 7th St · Mount Carmel, IL
Flood risk 1/10 · Minimal
- FEMA flood zone
- X (unshaded)
- Chance of flooding over 30 yrs
- 0.0%
- Est. flood insurance / yr
- $473 – $860
Fire risk 1/10 · Minimal
- Est. fire insurance / yr
- $804 – $1,492
Heat risk 4/10 · Minor
- Hot days now (above 107°F)
- 7 days/yr
- Hot days in 30 yrs
- 19 days/yr
Wind risk 2/10 · Minimal
- Chance of severe wind over 30 yrs
- 3.0%
Air-quality risk 2/10 · Minimal
- Unhealthy air days now
- 1 days/yr
- Unhealthy air days in 30 yrs
- 2 days/yr
Risk factors via First Street. Map © Google.
Why this score? — see what drove the B+ grade
The composite is a weighted blend of 9 inputs, each scored 0–100. Each bar is that input's sub-score; the figure is the points it added to the 100-point composite (weight × sub-score).
- Cash flow +30.0/30.0
- 1% rule +10.0/10.0
- DSCR +10.0/10.0
- Appreciation +10.0/10.0
- ARV discount +7.5/15.0
- Livability +3.2/5.0
- Rent growth +2.5/5.0
- Condition / age +2.5/5.0
- Schools +1.5/10.0
$49,900
🖨 Deal sheet (PDF) 📄 Offer letter ✓ Due diligence
Listing remarks
Affordable 2-bedroom, 1-bath home featuring a metal roof, newer furnace, newer walk-in shower, some hardwood flooring, and attractive woodwork. Additional amenities include a carport, detached garage, storage shed, gas water heater, and laundry area. Situated on a 48' x 65' lot with a crawl space foundation. A great opportunity for an owner-occupant or investor.
Key facts
- Hardwood flooring
- Metal roof
- Woodwork
Tags
Property features AI
Finance
- Financial info: Annual property tax noted
Exterior
- Utilities: Public water; Public sewer
- Home design: Single-family residence (site-built); 1 story
- Construction: Vinyl siding; Block foundation
- Exterior features: Lot dimensions approximately 49 ft x 66 ft; Lot includes other/unspecified features
Interior
- Bedrooms: Bedrooms located on main level
- Bathrooms: 1 full bathroom (main level)
- Heating & cooling: Central air conditioning; Forced air heating
- Interior features: 5 total rooms; Crawl space / no basement
- Laundry & utility: Main-level laundry
Neighborhood map
What this means for you Summary
Snapshot
- This is a 2-bed/1.0-bath other listed at $50k.
Deal economics
- At list price, monthly cash flow is $260 ($3k/yr) — positive.
- The deal already cash-flows at list — no discount required.
- Meets the 1% rule at list price ($809 rent vs $50k).
Location & tenants
- Location reads 64/100 on livability (#700 in IL) — a middle-class / working-renter tenant base. Strengths: crime A+, cost of living A+, housing A; Watch: amenities F, commute F, employment D-.
- Wabash CUSD 348 (town): math 14% / reading 20% proficiency, ranked #478 of 620 in IL (top 77%) — low school quality limits family demand, transient renter base, plan for 1-2y turnover.
- Zoned schools: Mt Carmel Grade School (math 13% / reading 14%, grade F, #1,354 of 2,056 statewide, top 66%, 395 students, 0% FRL); Mt Carmel Junior High School (math 12% / reading 32%, grade F, #389 of 665 statewide, top 60%, 202 students, 0% FRL); Mount Carmel High School (math 17% / reading 17%, grade F, #430 of 693 statewide, top 66%, 466 students, 0% FRL) — zoned schools average 0% FRL vs 41% district-wide (41 pts lower); this property's tenant base skews higher-income than the district average.
- Market conditions: 20 active listings in the ZIP; 2 units permitted in Wabash County in 2024 (0 in 5+ unit buildings).
Forward outlook
- In year one you build about $5k of equity ($345 loan paydown + $5k appreciation (10.0% local appreciation)).
- Wabash County population projected at -23% by 2050 — secular population decline; favor cash flow + early exit over multi-decade hold.
- At projected returns (10.0% appreciation + 3.0% rent growth), your $14k cash investment doubles in ~2 years — after that, you're playing with house money.
- By year 6, paydown + projected appreciation supports a ~$31k cash-out refi (75% LTV) — recoverable capital for the next deal without selling this one.
Negotiation context
- Only 14 days on market — expect competitive offers; lowballing is unlikely to land.
Risks & watch-outs
- Watch-outs: built in 1948 — expect roof / HVAC / electrical / plumbing capex.
Questions for the listing agent
- Built in 1948 — when were the roof, HVAC, electrical panel, plumbing, and water heater last replaced?
- Is there a deadline driving the sale (1031 exchange, divorce, estate, relocation)? That informs how much negotiation room exists.
- Schools are F-rated, which usually means shorter tenancies and higher turnover. Who's the typical renter profile here, and what's been the actual vacancy rate?
- What's the average days-on-market for RENTAL listings here right now (not sales)? A rising rental-DOM trend means longer vacancies and softer asking-rent achievability than the comps imply.
- What's the recent tenant-quality profile in this submarket — average credit score on applications, eviction rate, late-payment / NSF rate, and stable-employment percentage? A property-management company in the area should have these aggregated.
- How much new for-sale + rental construction is in the pipeline within 1–3 miles? Heavy new supply typically softens prices + rents 12–24 months out; constrained supply supports both.
Investment metrics
- 1% rule
- 1.62% ✓
- Cap rate
- 12.53%
- Cash-on-cash
- 22.29%
- DSCR
- 1.99
- GRM
- 5.1
CMA / ARV
No comps found within radius.
Projected returns pro-forma
10.0% appreciation · 3.0% rent growth · sell at horizon
- IRR
- 41.0%
- Equity multiple
- 4.13×
- Total profit
- $43,740
- Equity at exit
- $44,954
- IRR
- 35.4%
- Equity multiple
- 9.29×
- Total profit
- $115,875
- Equity at exit
- $96,945
Cash invested: $13,972 (down + closing). Projections, not guarantees.
Landlord ↔ Tenant lean methodology
- Overall (STATE)
- 43 Moderately Tenant-Leaning
- State Illinois
- 43 Moderately Tenant-Leaning · D+7
- County
- — inherits STATE
- City
- — inherits STATE
ZIP-level market 62863
- Home prices YoY
- 10.9%
- Active inventory
- 20
- Price-to-rent
- 5.1×
Monthly cashflow live
- Estimated rent
- $809 medium interval (Pro) →
- Mortgage (P&I)
- −$262
- Tax from tax record
- −$97 /mo · $1,168/yr
- Insurance
- −$21
- HOA
- −$0
- Vacancy / Maint / Mgmt
- −$170
- Net cashflow
- $260
Break-even live
Sensitivity live
| Price | -10% $288 | -5% $274 | +0% $260 | +5% $245 | +10% $231 |
|---|---|---|---|---|---|
| Rent | -10% $196 | -5% $228 | +0% $260 | +5% $291 | +10% $323 |
| Rate | -1.0pp $285 | -0.5pp $272 | base $260 | +0.5pp $247 | +1.0pp $233 |
UW: 25.0% down · 7.5% · 30yr · 1.5% tax · 5.0% vac · 8.0% maint · 8.0% mgmt
Financing live
Cash to close
- Down payment
- $12,475
- Closing costs
- $1,497
- Reserves months
- —
- Total cash needed
- —
Loan-product check · same deal, 3 products live
Conventional
25% down · 7.5% · 30yr
- Down + closing
- —
- Monthly P&I
- —
- Monthly cashflow
- —
- DSCR
- —
- Eligible?
- —
Personal DTI + credit; lowest rate.
DSCR
20% down · 8.5% · 30yr
- Down + closing
- —
- Monthly P&I
- —
- Monthly cashflow
- —
- DSCR
- —
- Eligible?
- —
No personal income docs; deal must DSCR.
Hard money
10% down · 12.0% · 12mo
- Down + closing
- —
- Monthly P&I
- —
- Monthly cashflow
- —
- DSCR
- —
- Eligible?
- —
Short-term bridge; refi at stabilization.
Listing history 11 events
-
2026-06-22days on market $49,900 Active 14 DOM
-
2026-06-21days on market $49,900 Active 13 DOM
-
2026-06-21days on market $49,900 Active 12 DOM
-
2026-06-18days on market $49,900 Active 10 DOM
-
2026-06-17days on market $49,900 Active 9 DOM
-
2026-06-16days on market $49,900 Active 8 DOM
-
2026-06-15days on market $49,900 Active 7 DOM
-
2026-06-13days on market $49,900 Active 5 DOM
-
2026-06-12days on market $49,900 Active 4 DOM
-
2026-06-09remarks 364-char remark
-
2026-06-09$49,900 Active 1 DOM
ⓘ Source: listings_history table (triggers on properties + properties_extension) + one-shot
backfill from property_details.listing_events for pre-trigger history.
Tax reassessment forecast IL · Partial reset (capped growth)
- Current annual tax
- $1,168 · $97/mo
- Projected year-2 tax
- $1,168 · $97/mo
- Expected delta
- $0/yr ($0/mo · 0.0%)
ⓘ Screening estimate from a state-policy table — verify with the county assessor before closing.
Climate risk First Street
- Flood 1/10 Low FEMA zone X (unshaded) · 0% chance over 30 yrs
- Wildfire 1/10 Low
- Heat 4/10 Moderate 7 d/yr ≥107°F today · 19 d/yr by 30 yrs out
- Wind 2/10 Low 3% chance of damaging wind over 30 yrs
- Air quality 2/10 Low 1 unhealthy d/yr today · 2 by 30 yrs out
Nearby sold comps map
Loading sold comps map…
Walkable amenities ~0.75 mi
Loading nearby amenities…
Taxation est. · year 1
- Rental income
- $9,712
- − Mortgage interest
- −$2,795
- − Property taxes
- −$1,168
- − Insurance
- −$250
- − Repairs & maintenance
- −$777
- − Management
- −$777
- − Depreciation
- −$1,452
- Taxable income
- $2,493
- Est. tax owed @ 24.0%
- −$598
- After-tax cash flow
- $2,516/yr
For passive investors: Depreciation is non-cash, so a rental often shows a tax loss while cash-flowing — sheltering income. Rental losses are passive: they offset passive income freely, and up to $25,000/yr can offset ordinary (W-2) income if you actively participate and your MAGI is under $100k (phasing out to $0 by $150k); unused losses carry forward. On sale, claimed depreciation is recaptured at up to 25%, and gains may owe capital-gains tax (a 1031 exchange can defer both). Figures are a year-1 estimate at your 24.0% rate — not tax advice; consult a CPA.
Schools (NCES district)
- District
- Wabash CUSD 348
- NCES district ID
- 1740470
- Math proficiency
- 14% ▼ -12.00%
- Reading proficiency
- 20% ▼ -20.00%
- Median HH income
- $45,869
- Composite
- 15.01/100
- National rank
- #9359
- State rank
- #478 of 620 in IL
Livability — Mount Carmel
- Score
- 64/100
- State rank
- #700
- US rank
- #14280
Category grades
Schools grade is shown separately in the Schools card above.
Census & demographics
- Census place
- Mount Carmel, IL
- Population (ZIP)
- 9,438
Population outlook (Wabash County) Hauer SSP2
- Today (2025)
- 10,660 people
- By 2030
- 10,134 · -4.9%
- By 2040
- 9,122 · -14.4%
- By 2050
- 8,212 · -23.0%
- By 2075
- 6,435 · -39.6%
- By 2100
- 4,890 · -54.1%
Race, ethnicity, and origin ACS 2023
- Neighborhood character
- Predominantly White (94%)
- Race & ethnicity
- White 94% Two or more races 3% Hispanic / Latino 2% Asian 1% Black 1%
- Common ancestry
- Lithuanian 2% Slovak 2% Italian 2%
- Foreign-born
- 2% · South Korea, Canada
- Languages at home
- 97% English-only · Spanish 2% Korean 1%
Political lean MEDSL · Wabash
- 2024 margin
- Solid R (+53.8) · D 22.3% · R 76.2% · Other 1.5%
- 2008→2024 swing
- -40.1pp toward R · 2008: -13.7pp · 2024: -53.8pp
- All cycles
- 2024: R+53.8 2020: R+53.2 2016: R+53.6 2012: R+36.8 2008: R+13.7
Not yet ingested
- Civics
- —
Market trends
- HPI YoY
- ▲ 27.59%
- Current HPI
- 280.61
- Rent YoY
- —
- Metro
- —
- State GDP YoY
- ▲ 1.59%
- F500 in state
- 60
Industry mix (Fortune 500 HQ in IL)
| Industry | F500 HQs | Revenue |
|---|---|---|
| Insurance | 4 | $201B |
|
||
| Consumer Goods | 4 | $87B |
|
||
| Industrial Machinery | 3 | $64B |
|
||
| Healthcare | 2 | $55B |
|
||
| Retail / Pharmacy | 1 | $148B |
|
||
| Agriculture / Food | 1 | $86B |
|
||
Price history
1 event — show timeline
- 2026-06-08 Listed $49,900 IRMLS
Property tax history
+15.8%/yrLatest (2025): $1,168 · +232.8% YoY. Source: county tax records.
Cash-flow waterfall
monthlySold comps — $/sqft
last 12 mo · ≤1 miLoading sold comps…