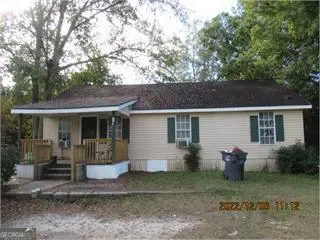
15 E Church St · Camilla, GA
Flood risk 8/10 · Major
- FEMA flood zone
- X (unshaded)
- Chance of flooding over 30 yrs
- 0.99%
- Est. flood insurance / yr
- $507 – $1,088
Fire risk 5/10 · Moderate
- Est. fire insurance / yr
- $963 – $1,789
Heat risk 8/10 · Major
- Hot days now (above 109°F)
- 7 days/yr
- Hot days in 30 yrs
- 20 days/yr
Wind risk 8/10 · Major
- Chance of severe wind over 30 yrs
- 99.0%
Air-quality risk 4/10 · Minor
- Unhealthy air days now
- 5 days/yr
- Unhealthy air days in 30 yrs
- 6 days/yr
Risk factors via First Street. Map © Google.
Why this score? — see what drove the B grade
The composite is a weighted blend of 9 inputs, each scored 0–100. Each bar is that input's sub-score; the figure is the points it added to the 100-point composite (weight × sub-score).
- Cash flow +30.0/30.0
- 1% rule +10.0/10.0
- DSCR +10.0/10.0
- ARV discount +8.2/15.0
- Appreciation +5.5/10.0
- Livability +3.0/5.0
- Rent growth +2.5/5.0
- Condition / age +2.5/5.0
- Schools +0.8/10.0
$69,900
🖨 Deal sheet 📄 Offer letter ✓ Due diligence
Listing remarks MLS
An investor dream. Live in tenants. newly renovated bathroom. Agent owned. There are three properties for sell in neighborhood. Call agent for bundle price.
Key facts
- 0.29 acre lot
- Built 1940
- Listed 267 days
Neighborhood map
What this means for you Summary
Snapshot
- This is a 3-bed/1.0-bath single-family listed at $70k.
Deal economics
- At list price, monthly cash flow is $334 ($4k/yr) — positive.
- The deal already cash-flows at list — no discount required.
- Meets the 1% rule at list price ($1k rent vs $70k).
- Recommended offer: $62k (12.0% below list) — sets the bar for market timing.
Location & tenants
- Location reads 60/100 on livability (#381 in GA) — a middle-class / working-renter tenant base. Strengths: cost of living A+, health & safety A+, housing A-; Watch: schools F, amenities F, commute F.
- Mitchell County (rural): math 8% / reading 11% proficiency, ranked #167 of 174 in GA (top 96%) — low school quality limits family demand, transient renter base, plan for 1-2y turnover; 80% free/reduced lunch — lower-income household profile, screen leases tightly.
- Market conditions: 28 active listings in the ZIP; 25 units permitted in Mitchell County in 2024 (0 in 5+ unit buildings).
Forward outlook
- In year one you build about $1k of equity ($483 loan paydown + $699 appreciation (1.0% local appreciation)).
- Mitchell County population projected at -29% by 2050 — secular population decline; favor cash flow + early exit over multi-decade hold.
- At projected returns (1.0% appreciation + 3.0% rent growth), your $20k cash investment doubles in ~4 years — after that, you're playing with house money.
Negotiation context
- It's been on market 268 days — a 12% lower offer ($62k) is reasonable based on typical stale-listing flexibility.
- 2 sale attempts with the ask held roughly flat each time — persistent listings suggest the price (not the market) is what's stuck; bring a comps-based counter.
Risks & watch-outs
- Watch-outs: flood insurance adds $66/mo; built in 1940 — expect roof / HVAC / electrical / plumbing capex.
- Climate carrying-cost: severe flood risk; severe wind risk, 99% chance of damaging wind over 30y; moderate wildfire risk; extreme-heat days projected 7→20/yr by 2055 (HVAC capex compounding) — expect insurance premiums to compound above CPI over the hold.
Questions for the listing agent
- It's been on market 268 days. Have you received any prior offers? Is the seller open to a 12% concession, seller financing, or rate buy-down credit?
- Built in 1940 — when were the roof, HVAC, electrical panel, plumbing, and water heater last replaced?
- What's the actual annual flood-insurance premium (NFIP or private), and is the property in a SFHA with mandatory coverage?
- Why hasn't it sold? Are there any deal-killer items the seller is aware of (foundation, flood, title, zoning, code violations)?
- Is there a deadline driving the sale (1031 exchange, divorce, estate, relocation)? That informs how much negotiation room exists.
- Schools are F-rated, which usually means shorter tenancies and higher turnover. Who's the typical renter profile here, and what's been the actual vacancy rate?
- What's the average days-on-market for RENTAL listings here right now (not sales)? A rising rental-DOM trend means longer vacancies and softer asking-rent achievability than the comps imply.
- What's the recent tenant-quality profile in this submarket — average credit score on applications, eviction rate, late-payment / NSF rate, and stable-employment percentage? A property-management company in the area should have these aggregated.
- How much new for-sale + rental construction is in the pipeline within 1–3 miles? Heavy new supply typically softens prices + rents 12–24 months out; constrained supply supports both.
Investment metrics
- 1% rule
- 1.55% ✓
- Cap rate
- 13.17%
- Cash-on-cash
- 24.55%
- DSCR
- 2.09
- GRM
- 5.4
CMA / ARV
- ARV (median comp)
- $71,000
- List price
- $69,900
- Delta
- -1.55%
- Verdict
- FAIR
- Comps
- 15 within 1.0 mi
Show comp detail 2 sales within ~0.75 mi
| Address | Dist | Beds/Ba | Sqft | Sold | Price | $/sf | Match |
|---|---|---|---|---|---|---|---|
| 30 Fry Pl | 0.29mi | 3/2.0 | 1,120 (0%) | 11mo | $56,000 | $50 | 73 |
| 43 Sunset Cir | 0.24mi | 3/1.0 | 1,000 (-11%) | 2mo | $30,000 | $30 | 69 |
Match score weights: distance 35% · size 25% · config 20% · recency 20%. Top-matched comps best support the ARV.
Projected returns pro-forma
1.0% appreciation · 3.0% rent growth · sell at horizon
- IRR
- 22.6%
- Equity multiple
- 2.16×
- Total profit
- $22,617
- Equity at exit
- $23,860
- IRR
- 25.5%
- Equity multiple
- 4.08×
- Total profit
- $60,372
- Equity at exit
- $31,706
Cash invested: $19,572 (down + closing). Projections, not guarantees.
Landlord ↔ Tenant lean methodology
- Overall (STATE)
- 90 Strongly Landlord-Friendly
- State Georgia
- 90 Strongly Landlord-Friendly · R+3
- County
- — inherits STATE
- City
- — inherits STATE
ZIP-level market 31730
- Home prices YoY
- 0.5%
- Active inventory
- 28
- Price-to-rent
- 5.4×
Monthly cashflow live
- Estimated rent
- $1,084 medium interval (Pro) →
- Mortgage (P&I)
- −$367
- Tax from tax record
- −$60 /mo · $719/yr
- Insurance
- −$29
- Flood insurance flood zone
- −$66 /mo · $798/yr
- HOA
- −$0
- Vacancy / Maint / Mgmt
- −$228
- Net cashflow
- $334
Break-even live
UW: 25.0% down · 7.5% · 30yr · 1.5% tax · 5.0% vac · 8.0% maint · 8.0% mgmt
Financing live
Cash to close
- Down payment
- $17,475
- Closing costs
- $2,097
- Reserves months
- —
- Total cash needed
- —
Loan-product check · same deal, 3 products live
Conventional
25% down · 7.5% · 30yr
- Down + closing
- —
- Monthly P&I
- —
- Monthly cashflow
- —
- DSCR
- —
- Eligible?
- —
Personal DTI + credit; lowest rate.
DSCR
20% down · 8.5% · 30yr
- Down + closing
- —
- Monthly P&I
- —
- Monthly cashflow
- —
- DSCR
- —
- Eligible?
- —
No personal income docs; deal must DSCR.
Hard money
10% down · 12.0% · 12mo
- Down + closing
- —
- Monthly P&I
- —
- Monthly cashflow
- —
- DSCR
- —
- Eligible?
- —
Short-term bridge; refi at stabilization.
Listing history 20 events
-
2026-06-19days on market $69,900 Active 268 DOM
-
2026-06-18days on market $69,900 Active 267 DOM
-
2026-06-17days on market $69,900 Active 266 DOM
-
2026-06-16days on market $69,900 Active 265 DOM
-
2026-06-15days on market $69,900 Active 264 DOM
-
2026-06-14days on market $69,900 Active 262 DOM
-
2026-06-13days on market $69,900 Active 261 DOM
-
2026-06-10days on market $69,900 Active 259 DOM
-
2026-06-09days on market $69,900 Active 258 DOM
-
2026-06-08days on market $69,900 Active 257 DOM
-
2026-06-07days on market $69,900 Active 256 DOM
-
2026-06-05days on market $69,900 Active 253 DOM
-
2026-06-03days on market $69,900 Active 252 DOM
-
2026-06-02days on market $69,900 Active 251 DOM
-
2026-06-01days on market $69,900 Active 250 DOM
-
2026-05-31days on market $69,900 Active 249 DOM
-
2026-05-30days on market $69,900 Active 248 DOM
-
2026-03-03status Back On Market 156-char remark
Show marketing remark (156 chars)
An investor dream. Live in tenants. newly renovated bathroom. Agent owned. There are three properties for sell in neighborhood. Call agent for bundle price.
-
2026-03-02historical 156-char remark
Show marketing remark (156 chars)
An investor dream. Live in tenants. newly renovated bathroom. Agent owned. There are three properties for sell in neighborhood. Call agent for bundle price.
-
2025-09-23$69,900 New 156-char remark
Show marketing remark (156 chars)
An investor dream. Live in tenants. newly renovated bathroom. Agent owned. There are three properties for sell in neighborhood. Call agent for bundle price.
ⓘ Source: listings_history table (triggers on properties + properties_extension) + one-shot
backfill from property_details.listing_events for pre-trigger history.
Tax reassessment forecast GA · Resets to sale price
- Current annual tax
- $719 · $60/mo
- Projected year-2 tax
- $719 · $60/mo
- Expected delta
- $0/yr ($0/mo · 0.0%)
ⓘ Screening estimate from a state-policy table — verify with the county assessor before closing.
Climate risk First Street
- Flood 8/10 Severe FEMA zone X (unshaded) · 99% chance over 30 yrs
- Wildfire 5/10 Major
- Heat 8/10 Severe 7 d/yr ≥109°F today · 20 d/yr by 30 yrs out
- Wind 8/10 Severe 99% chance of damaging wind over 30 yrs
- Air quality 4/10 Moderate 5 unhealthy d/yr today · 6 by 30 yrs out
Nearby sold comps map
Loading sold comps map…
Walkable amenities ~0.75 mi
Loading nearby amenities…
Taxation est. · year 1
- Rental income
- $13,003
- − Mortgage interest
- −$3,915
- − Property taxes
- −$719
- − Insurance
- −$1,147
- − Repairs & maintenance
- −$1,040
- − Management
- −$1,040
- − Depreciation
- −$2,033
- Taxable income
- $3,108
- Est. tax owed @ 24.0%
- −$746
- After-tax cash flow
- $3,262/yr
For passive investors: Depreciation is non-cash, so a rental often shows a tax loss while cash-flowing — sheltering income. Rental losses are passive: they offset passive income freely, and up to $25,000/yr can offset ordinary (W-2) income if you actively participate and your MAGI is under $100k (phasing out to $0 by $150k); unused losses carry forward. On sale, claimed depreciation is recaptured at up to 25%, and gains may owe capital-gains tax (a 1031 exchange can defer both). Figures are a year-1 estimate at your 24.0% rate — not tax advice; consult a CPA.
Schools (NCES district)
- District
- Mitchell County
- NCES district ID
- 1303690
- Math proficiency
- 8% ▼ -19.00%
- Reading proficiency
- 11% ▼ -16.00%
- Median HH income
- $36,119
- Composite
- 7.87/100
- National rank
- #9927
- State rank
- #167 of 174 in GA
Livability — Camilla
- Score
- 60/100
- State rank
- #381
- US rank
- #19244
Category grades
Schools grade is shown separately in the Schools card above.
Census & demographics
- Census place
- Camilla, GA
- Population (ZIP)
- 8,337
Population outlook (Mitchell County) Hauer SSP2
- Today (2025)
- 20,489 people
- By 2030
- 19,310 · -5.8%
- By 2040
- 16,971 · -17.2%
- By 2050
- 14,616 · -28.7%
- By 2075
- 9,435 · -54.0%
- By 2100
- 5,424 · -73.5%
Race, ethnicity, and origin ACS 2023
- Neighborhood character
- Diverse neighborhood (Simpson 0.56)
- Race & ethnicity
- Black 59% White 29% Hispanic / Latino 6% Two or more races 6%
- Hispanic origin (detail)
- Mexican 3% Puerto Rican 4%
- Common ancestry
- Slovak 1% Serbian 1% Hispanic 1%
- Foreign-born
- 4% · Canada, United Kingdom
- Languages at home
- 94% English-only · Spanish 5% French/Haitian/Cajun 1%
Political lean MEDSL · Mitchell
- 2024 margin
- R (+16.3) · D 41.7% · R 58.0%
- 2008→2024 swing
- -12.3pp toward R · 2008: -4.1pp · 2024: -16.3pp
- All cycles
- 2024: R+16.3 2020: R+10.5 2016: R+9.9 2012: R+0.9 2008: R+4.1
Not yet ingested
- Civics
- —
Market trends
- HPI YoY
- ▲ 1.00%
- Current HPI
- 201.7084
- Rent YoY
- —
- Metro
- —
- State GDP YoY
- ▲ 2.66%
- F500 in state
- 28
Industry mix (Fortune 500 HQ in GA)
| Industry | F500 HQs | Revenue |
|---|---|---|
| Paper / Packaging | 2 | $29B |
|
||
| Retail | 1 | $160B |
|
||
| Transportation / Logistics | 1 | $91B |
|
||
| Airlines | 1 | $62B |
|
||
| Consumer Goods | 1 | $47B |
|
||
| Utilities | 1 | $25B |
|
||
Price history
3 events — show timeline
- 2026-03-03 Relisted — GAMLS
- 2026-03-02 Listing Removed — GAMLS
- 2025-09-23 Listed $69,900 GAMLS
Property tax history
+0.4%/yrLatest (2025): $719 · -0.3% YoY. Source: county tax records.
Cash-flow waterfall
monthlySold comps — $/sqft
last 12 mo · ≤1 miLoading sold comps…