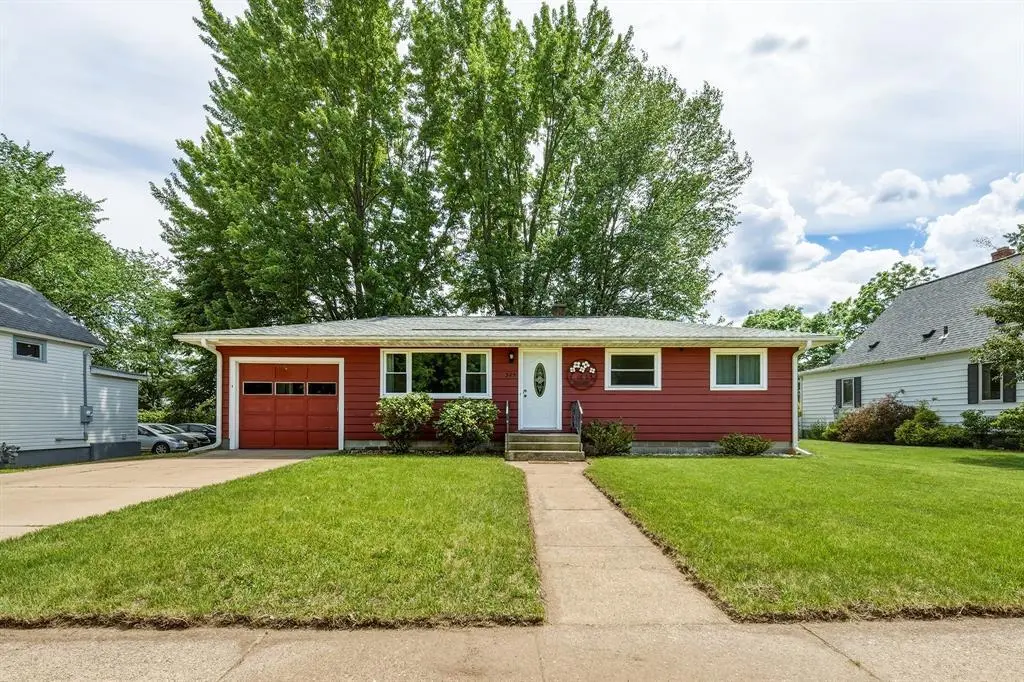
325 Selma St · Eau Claire, WI
Flood risk 1/10 · Minimal
- FEMA flood zone
- X (unshaded)
- Chance of flooding over 30 yrs
- 0.0%
- Est. flood insurance / yr
- $473 – $860
Fire risk 3/10 · Minor
- Est. fire insurance / yr
- $636 – $1,182
Heat risk 2/10 · Minimal
- Hot days now (above 97°F)
- 7 days/yr
- Hot days in 30 yrs
- 13 days/yr
Wind risk 1/10 · Minimal
- Chance of severe wind over 30 yrs
- —
Air-quality risk 2/10 · Minimal
- Unhealthy air days now
- 1 days/yr
- Unhealthy air days in 30 yrs
- 1 days/yr
Risk factors via First Street. Map © Google.
Why this score? — see what drove the D grade
The composite is a weighted blend of 9 inputs, each scored 0–100. Each bar is that input's sub-score; the figure is the points it added to the 100-point composite (weight × sub-score).
- Cash flow +13.1/30.0
- ARV discount +7.3/15.0
- Livability +4.5/5.0
- DSCR +3.9/10.0
- 1% rule +3.8/10.0
- Schools +3.5/10.0
- Rent growth +3.0/5.0
- Condition / age +2.5/5.0
- Appreciation +0.0/10.0
$240,000
🖨 Deal sheet (PDF) 📄 Offer letter ✓ Due diligence
Listing remarks MLS
Meticulously maintained 1 owner, 3 bdrm ranch. Home features hrdwd flrs, new furnace & A/C, remodeled bthrm, updated windows, possible first flr lndry & finished lower level. Great neighborhood location offers easy access to downtown or North Crossing.
Key facts
- Spacious backyard
- Convenient location
- 8,712 sq ft lot
Tags
Property features AI
Exterior
- Parking: Attached 1-car garage
- Utilities: Municipal water; Municipal sewer; Natural gas service
- Home design: Single-family, one-story home; Approximately 1,501–1,750 total finished area with about 912 finished above grade and 600 finished below grade
- Construction: Block foundation
- Exterior features: Aluminum/steel exterior; Garden shed; Lot under 1/2 acre (approximately 0.2 acre); Zoned residential
Interior
- Kitchen: Range/oven; Refrigerator; Kitchen located on main level (approx. 9 x 9)
- Bedrooms: Master bedroom on main level, about 9 x 13; Second bedroom on main level, about 8 x 11; Third bedroom on main level, about 10 x 11
- Bathrooms: 2 full bathrooms
- Heating & cooling: Forced air heating (natural gas); Central air conditioning
- Interior features: Circuit breakers; Basement is full, partially finished, with block foundation
- Laundry & utility: Washer; Dryer
Neighborhood map
What this means for you Summary
Snapshot
- This is a 3-bed/2.0-bath single-family listed at $240k.
Deal economics
- At list price, monthly cash flow is $-9 ($-110/yr) — negative.
- To cash-flow at today's rent, offer at most $238k (0.7% below list).
- To meet the 1% rule (rent ≥ 1% of price), the offer needs to be $211k (12.3% below list).
- Recommended offer: $211k (12.3% below list) — sets the bar for 1% rule.
- Cap rate 6.2% vs local median 2.5% in Eau Claire — top-decile yield for the area; either an underpriced asset or a hidden risk that comps aren't pricing in. Stress-test before assuming the spread holds.
Location & tenants
- Location reads 89/100 on livability (#10 in WI, #121 nationally) — a professional / high-income tenant draw. Strengths: amenities A+, cost of living A+, housing A+.
- Eau Claire Area School District (urban): math 38% / reading 43% proficiency, ranked #150 of 342 in WI (top 44%) — families likely to look elsewhere, expect single-tenant / working-renter base with shorter leases.
- Zoned schools: Roosevelt Elementary (math 37% / reading 42%, grade F, #490 of 1,041 statewide, top 53%, 255 students, 40% FRL); Delong Middle (math 32% / reading 42%, grade F, #175 of 383 statewide, top 48%, 893 students, 44% FRL); North High (math 38% / reading 46%, grade F, #74 of 483 statewide, top 18%, 1,663 students, 41% FRL).
- Market conditions: Rents rising (+2.0%/yr); 215 active listings in the ZIP; 6 comparable units currently listed for rent nearby; rentals lingering (median 46d on market — plan ~5-8 weeks vacancy on turnover, expect pricing pressure); 50% of comp listings sitting > 30 days — soft ceiling on asking rent; 583 units permitted in Eau Claire County in 2024 (325 in 5+ unit buildings).
- This rent runs 35% of the median local income ($72k/yr) — at the standard rent-burdened threshold; future hikes will face affordability resistance.
Forward outlook
- Local home prices are declining (-3.0%/yr); year-one equity from $2k of loan paydown is wiped out by about $7k of value loss. Plan a longer hold.
- Eau Claire County population projected at +14% by 2050 — modest demand growth; plan on rents tracking national, not racing it.
Negotiation context
- Only 2 days on market — expect competitive offers; lowballing is unlikely to land.
- 2 sale attempts since 18y ago with the ask held roughly flat each time — persistent listings suggest the price (not the market) is what's stuck; bring a comps-based counter.
- Current owner paid $205k; 17% above their basis — modest negotiation headroom, anchor on the comps not their cost.
Questions for the listing agent
- What do current leases actually rent for vs. the listed asking? Can we see a recent rent roll and the last 12 months of T-12 income?
- Built in 1963 — when were the roof, HVAC, electrical panel, plumbing, and water heater last replaced?
- Is there a deadline driving the sale (1031 exchange, divorce, estate, relocation)? That informs how much negotiation room exists.
- Schools are B-rated — typically a magnet for longer-tenancy family renters. What's the average tenant stay here, and is there a school-zone premium baked into asking?
- The area grade is low — what's the realistic commute time and amenity access for the typical tenant pool here? Any planned neighborhood developments (good or bad) we should know about?
- What's the average days-on-market for RENTAL listings here right now (not sales)? A rising rental-DOM trend means longer vacancies and softer asking-rent achievability than the comps imply.
- What's the recent tenant-quality profile in this submarket — average credit score on applications, eviction rate, late-payment / NSF rate, and stable-employment percentage? A property-management company in the area should have these aggregated.
- How much new for-sale + rental construction is in the pipeline within 1–3 miles? Heavy new supply typically softens prices + rents 12–24 months out; constrained supply supports both.
Investment metrics
- 1% rule
- 0.88% ✗
- Cap rate
- 6.25%
- Cash-on-cash
- -0.16%
- DSCR
- 0.99
- GRM
- 9.5
CMA / ARV
- ARV (on-the-fly)
- $238,896
- Comps found
- 12
Show comp detail 12 sales within ~0.75 mi
| Address | Dist | Beds/Ba | Sqft | Sold | Price | $/sf | Match |
|---|---|---|---|---|---|---|---|
| 3003 8th St | 0.25mi | 3/2.0 | 1,424 (-6%) | 1mo | $225,000 | $158 | 78 |
| 2719 4th St | 0.34mi | 3/1.5 | 1,484 (-2%) | 8mo | $232,900 | $157 | 72 |
| 3024 7th St | 0.21mi | 2/1.5 (-1) | 1,588 (+5%) | 4mo | $250,000 | $157 | 71 |
| 2713 11th St | 0.54mi | 3/1.5 | 1,568 (+4%) | 3mo | $255,000 | $163 | 64 |
| 610 Truax Blvd | 0.15mi | 3/1.5 | 1,724 (+14%) | 6mo | $235,000 | $136 | 63 |
| 2911 6th St | 0.17mi | 2/1.5 (-1) | 1,678 (+11%) | 6mo | $259,900 | $155 | 62 |
| 2718 5th St | 0.35mi | 3/1.5 | 1,680 (+11%) | 4mo | $240,000 | $143 | 60 |
| 599 Hagman St Lot 36 | 0.66mi | 2/2.0 (-1) | 1,448 (-4%) | 3mo | $322,868 | $223 | 54 |
| 1027 Pershing St | 0.62mi | 2/2.0 (-1) | 1,564 (+3%) | 7mo | $212,000 | $136 | 54 |
| 2805 7th St | 0.31mi | 3/1.0 | 1,301 (-14%) | 5mo | $232,500 | $179 | 54 |
| 663 Hagman St Lot 38 | 0.69mi | 2/2.0 (-1) | 1,448 (-4%) | 5mo | $334,553 | $231 | 52 |
| 3004 14th St | 0.64mi | 3/1.5 | 1,716 (+14%) | 8mo | $296,500 | $173 | 39 |
Match score weights: distance 35% · size 25% · config 20% · recency 20%. Top-matched comps best support the ARV.
Projected returns pro-forma
-3.0% appreciation · 2.01% rent growth · sell at horizon
- IRR
- -17.7%
- Equity multiple
- 0.38×
- Total profit
- $-41,509
- Equity at exit
- $35,785
- IRR
- -11.8%
- Equity multiple
- 0.33×
- Total profit
- $-45,086
- Equity at exit
- $20,751
Cash invested: $67,200 (down + closing). Projections, not guarantees.
Landlord ↔ Tenant lean methodology
- Overall (STATE)
- 73 Landlord-Friendly
- State Wisconsin
- 73 Landlord-Friendly · R+2
- County
- — inherits STATE
- City
- — inherits STATE
ZIP-level market 54703
- Rents YoY
- 2.0%
- Active inventory
- 215
- Price-to-rent
- 9.5×
Monthly cashflow live
- Estimated rent
- $2,106 medium interval (Pro) →
- Mortgage (P&I)
- −$1,259
- Tax from tax record
- −$314 /mo · $3,769/yr
- Insurance
- −$100
- HOA
- −$0
- Vacancy / Maint / Mgmt
- −$442
- Net cashflow
- $-9
Break-even live
Sensitivity live
| Price | -10% $127 | -5% $59 | +0% $-9 | +5% $-77 | +10% $-145 |
|---|---|---|---|---|---|
| Rent | -10% $-175 | -5% $-92 | +0% $-9 | +5% $74 | +10% $157 |
| Rate | -1.0pp $112 | -0.5pp $52 | base $-9 | +0.5pp $-71 | +1.0pp $-135 |
UW: 25.0% down · 7.5% · 30yr · 1.5% tax · 5.0% vac · 8.0% maint · 8.0% mgmt
Financing live
Cash to close
- Down payment
- $60,000
- Closing costs
- $7,200
- Reserves months
- —
- Total cash needed
- —
Loan-product check · same deal, 3 products live
Conventional
25% down · 7.5% · 30yr
- Down + closing
- —
- Monthly P&I
- —
- Monthly cashflow
- —
- DSCR
- —
- Eligible?
- —
Personal DTI + credit; lowest rate.
DSCR
20% down · 8.5% · 30yr
- Down + closing
- —
- Monthly P&I
- —
- Monthly cashflow
- —
- DSCR
- —
- Eligible?
- —
No personal income docs; deal must DSCR.
Hard money
10% down · 12.0% · 12mo
- Down + closing
- —
- Monthly P&I
- —
- Monthly cashflow
- —
- DSCR
- —
- Eligible?
- —
Short-term bridge; refi at stabilization.
Rent comps 6 comps
| Address | Beds | Baths | Sqft | Rent | $/sqft | DOM | Units | Dist |
|---|---|---|---|---|---|---|---|---|
| 1127 Glenn Pl Unit Left Eau Claire, WI | 3.0 | 2.0 | 1950 | $1,850 | $0.95 | 45d | 1 | 0.83mi |
| 2016 N Oxford Ave Eau Claire, WI | 2.0 | 1.0–2.0 | 1023 | $2,600 | $2.54 | 15d | 33 | 0.84mi |
| 315 Riverfront Ter Eau Claire, WI | 1.0–2.0 | 1.0–2.0 | 974 | $1,725 | $1.77 | 45d | 10 | 1.22mi |
| 224 N Barstow St Eau Claire, WI | 1.0–2.0 | 1.0–2.0 | 828 | $2,350 | $2.84 | 15d | 20 | 1.29mi |
| 100 N Farwell St Eau Claire, WI | 2.0 | 1.0–2.0 | 787 | $2,950 | $3.75 | 15d | 13 | 1.40mi |
| 1014 Oxford Ave Unit 1/2 Eau Claire, WI | 4.0 | 1.0 | 1244 | $1,396 | $1.12 | 45d | 1 | 1.49mi |
Listing history 2 events
-
2026-06-21remarks 699-char remark
-
2026-06-21$240,000 Active 2 DOM
ⓘ Source: listings_history table (triggers on properties + properties_extension) + one-shot
backfill from property_details.listing_events for pre-trigger history.
Tax reassessment forecast WI · Partial reset (capped growth)
- Current annual tax
- $3,769 · $314/mo
- Projected year-2 tax
- $4,104 · $342/mo
- Expected delta
- +$336/yr (+$28/mo · 8.9%)
ⓘ Screening estimate from a state-policy table — verify with the county assessor before closing.
Climate risk First Street
- Flood 1/10 Low FEMA zone X (unshaded) · 0% chance over 30 yrs
- Wildfire 3/10 Moderate
- Heat 2/10 Low 7 d/yr ≥97°F today · 13 d/yr by 30 yrs out
- Wind 1/10 Low
- Air quality 2/10 Low 1 unhealthy d/yr today · 1 by 30 yrs out
Nearby sold comps map
Loading sold comps map…
Walkable amenities ~0.75 mi
Loading nearby amenities…
Taxation est. · year 1
- Rental income
- $25,269
- − Mortgage interest
- −$13,444
- − Property taxes
- −$3,769
- − Insurance
- −$1,200
- − Repairs & maintenance
- −$2,021
- − Management
- −$2,021
- − Depreciation
- −$6,982
- Taxable loss
- −$4,169
- Est. tax savings @ 24.0%
- +$1,001
- After-tax cash flow
- $891/yr
For passive investors: Depreciation is non-cash, so a rental often shows a tax loss while cash-flowing — sheltering income. Rental losses are passive: they offset passive income freely, and up to $25,000/yr can offset ordinary (W-2) income if you actively participate and your MAGI is under $100k (phasing out to $0 by $150k); unused losses carry forward. On sale, claimed depreciation is recaptured at up to 25%, and gains may owe capital-gains tax (a 1031 exchange can defer both). Figures are a year-1 estimate at your 24.0% rate — not tax advice; consult a CPA.
Schools (NCES district)
- District
- Eau Claire Area School District
- NCES district ID
- 5504050
- Math proficiency
- 38% ▼ -9.00%
- Reading proficiency
- 43% ▬ 0.00%
- Median HH income
- $48,206
- Composite
- 34.72/100
- National rank
- #5135
- State rank
- #150 of 342 in WI
Livability — Eau Claire
- Score
- 89/100
- State rank
- #10
- US rank
- #121
Category grades
Schools grade is shown separately in the Schools card above.
Census & demographics
- Census place
- Eau Claire, WI
- County
- Eau Claire County · 96,114 people
- City population
- 87,167
- Metro
- Eau Claire, WI
- Population (ZIP)
- 44,153
- Household income
- $71,518
- Rent vs Own
- Severe rent burden
- 1614.0
Population outlook (Eau Claire County) Hauer SSP2
- Today (2025)
- 109,006 people
- By 2030
- 112,587 · +3.3%
- By 2040
- 118,674 · +8.9%
- By 2050
- 124,085 · +13.8%
- By 2075
- 135,804 · +24.6%
- By 2100
- 139,875 · +28.3%
Race, ethnicity, and origin ACS 2023
- Neighborhood character
- Predominantly White (85%)
- Race & ethnicity
- White 85% Asian 6% Two or more races 4% Hispanic / Latino 4% Black 2%
- Common ancestry
- Portuguese 16% Romanian 5% Lithuanian 3%
- Foreign-born
- 3% · Canada, China
- Languages at home
- 92% English-only · Other Asian/Pacific 4% Spanish 3%
Political lean MEDSL · Eau Claire
- 2024 margin
- D (+10.6) · D 54.6% · R 44.0% · Other 1.4%
- 2008→2024 swing
- -11.6pp toward R · 2008: 22.1pp · 2024: 10.6pp
- All cycles
- 2024: D+10.6 2020: D+10.8 2016: D+7.3 2012: D+13.6 2008: D+22.1
Not yet ingested
- Civics
- —
Market trends
- HPI YoY
- ▼ -276.20%
- Current HPI
- 218.2747
- Rent YoY
- ▲ 2.01%
- Metro
- Eau Claire, WI
- State GDP YoY
- ▲ 2.10%
- F500 in state
- 20
Industry mix (Fortune 500 HQ in WI)
| Industry | F500 HQs | Revenue |
|---|---|---|
| Industrial Machinery | 4 | $23B |
|
||
| Industrial Technology | 2 | $36B |
|
||
| Insurance | 1 | $36B |
|
||
| Professional Services | 1 | $19B |
|
||
| Utilities | 1 | $9B |
|
||
| Consumer Goods | 1 | $3B |
|
||
Price history
+128.6% since first listed7 events — show timeline
- 2026-06-17 Listed $240,000 RANWW
- 2021-06-24 Sold (Public Records) $205,000 Public Records
- 2017-07-12 Sold (Public Records) $128,000 Public Records
- 2008-12-11 Sold (Public Records) $102,000 Public Records
- 2008-10-14 Listing Removed — NORTHSTARMLS as Distributed by MLS Grid
- 2008-10-10 Sold (MLS) $102,000 NORTHSTARMLS as Distributed by MLS Grid
- 2008-07-14 Listed $105,000 NORTHSTARMLS as Distributed by MLS Grid
Property tax history
+5.4%/yrLatest (2025): $3,769 · +2.6% YoY. Source: county tax records.
Cash-flow waterfall
monthlySold comps — $/sqft
last 12 mo · ≤1 miLoading sold comps…