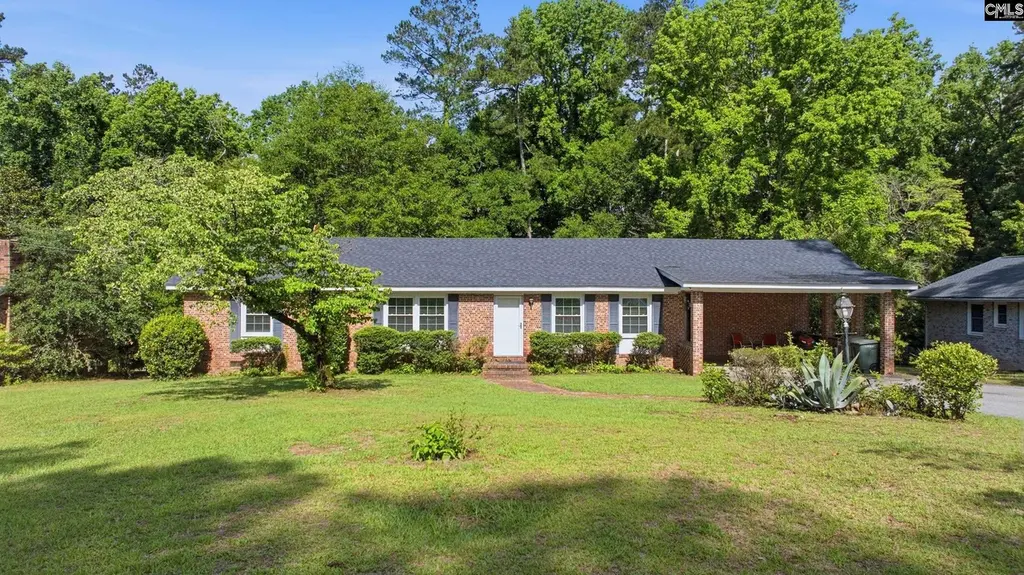
1968 Pinebrook St · Orangeburg, SC
Flood risk 1/10 · Minimal
- FEMA flood zone
- X (unshaded)
- Chance of flooding over 30 yrs
- 0.0%
- Est. flood insurance / yr
- $473 – $860
Fire risk 3/10 · Minor
- Est. fire insurance / yr
- $783 – $1,453
Heat risk 7/10 · Major
- Hot days now (above 108°F)
- 7 days/yr
- Hot days in 30 yrs
- 16 days/yr
Wind risk 8/10 · Major
- Chance of severe wind over 30 yrs
- 80.0%
Air-quality risk 3/10 · Minor
- Unhealthy air days now
- 3 days/yr
- Unhealthy air days in 30 yrs
- 3 days/yr
Risk factors via First Street. Map © Google.
Why this score? — see what drove the C+ grade
The composite is a weighted blend of 9 inputs, each scored 0–100. Each bar is that input's sub-score; the figure is the points it added to the 100-point composite (weight × sub-score).
- Cash flow +20.3/30.0
- ARV discount +15.0/15.0
- DSCR +6.4/10.0
- Appreciation +5.0/10.0
- Schools +5.0/10.0
- 1% rule +4.4/10.0
- Livability +2.7/5.0
- Rent growth +2.5/5.0
- Condition / age +2.5/5.0
$245,000
🖨 Deal sheet 📄 Offer letter ✓ Due diligence
Listing remarks
Welcome home to this beautifully updated 4-bedroom, 2-bath brick ranch style home nestled in a quiet, well-established neighborhood in Orangeburg, SC. Situated on over half an acre, this home offers the perfect blend of charm, space, and functionality. Inside, you’ll find two spacious living areas, including a formal living room that can easily fit your lifestyle needs. The versatile flex room provides endless possibilities, perfect for a home office, den, playroom, flex space, or 5th br/guest room. The updated kitchen features refreshed cabinetry, backsplash, appliances and inviting eat-in dining area ideal for everyday living and entertaining. Both bathrooms have also been tastefull
Key facts
- Mature greenery
- Backyard oasis
- Updated kitchen
Tags
Property features AI
Exterior
- Parking: Carport attached; Six parking spaces
- Utilities: Public sewer
- Home design: Single-story
- Construction: Crawlspace foundation
- Exterior features: Brick exterior above foundation; Paved road access; Public water
Interior
- Kitchen: Eat-in kitchen; Pantry; Backsplash; Ceiling fan
- Bedrooms: Master bedroom on the main level
- Bathrooms: Two full bathrooms
- Heating & cooling: Central heating; Central air
- Interior features: One fireplace; Free-standing range
Neighborhood map
What this means for you Summary
Snapshot
- This is a 3-bed/2.0-bath single-family listed at $245k.
Deal economics
- At list price, monthly cash flow is $314 ($4k/yr) — positive.
- The deal already cash-flows at list — no discount required.
- To meet the 1% rule (rent ≥ 1% of price), the offer needs to be $230k (6.1% below list).
- Recommended offer: $230k (6.1% below list) — sets the bar for 1% rule.
- Cap rate 7.8% vs local median 4.2% in Orangeburg — top-decile yield for the area; either an underpriced asset or a hidden risk that comps aren't pricing in. Stress-test before assuming the spread holds.
Location & tenants
- Location reads 54/100 on livability (#324 in SC) — a working-class tenant base; expect higher turnover. Strengths: cost of living A+, health & safety B; Watch: housing C-, crime F, amenities D-.
- Zoned schools: Marshall Elementary (math 24%, 651 students, 100% FRL); Orangeburg Wilkinson High (math 22%, 1,073 students, 100% FRL).
- Market conditions: 1 active listings in the ZIP; 1 comparable units currently listed for rent nearby; 87 units permitted in Orangeburg County in 2024 (0 in 5+ unit buildings).
Forward outlook
- In year one you build about $9k of equity ($2k loan paydown + $7k appreciation (3.0% local appreciation)).
- Orangeburg County population projected at -27% by 2050 — secular population decline; favor cash flow + early exit over multi-decade hold.
- At projected returns (3.0% appreciation + 3.0% rent growth), your $69k cash investment doubles in ~5 years — after that, you're playing with house money.
- By year 4, paydown + projected appreciation supports a ~$31k cash-out refi (75% LTV) — recoverable capital for the next deal without selling this one.
Negotiation context
- It's been on market 21 days — a 2% lower offer ($241k) is reasonable based on typical stale-listing flexibility.
- Current owner paid $138k; list at $245k implies a 78% gain — meaningful room to come down on a strong offer.
Risks & watch-outs
- Climate carrying-cost: severe wind risk, 80% chance of damaging wind over 30y; extreme-heat days projected 7→16/yr by 2055 (HVAC capex compounding) — expect insurance premiums to compound above CPI over the hold.
Questions for the listing agent
- Built in 1963 — when were the roof, HVAC, electrical panel, plumbing, and water heater last replaced?
- Is there a deadline driving the sale (1031 exchange, divorce, estate, relocation)? That informs how much negotiation room exists.
- Schools are F-rated, which usually means shorter tenancies and higher turnover. Who's the typical renter profile here, and what's been the actual vacancy rate?
- Crime grade is F in this area — have there been break-ins, vandalism, or insurance claims at this property in the last 3 years? What carrier currently insures it and at what premium?
- What's the average days-on-market for RENTAL listings here right now (not sales)? A rising rental-DOM trend means longer vacancies and softer asking-rent achievability than the comps imply.
- What's the recent tenant-quality profile in this submarket — average credit score on applications, eviction rate, late-payment / NSF rate, and stable-employment percentage? A property-management company in the area should have these aggregated.
- How much new for-sale + rental construction is in the pipeline within 1–3 miles? Heavy new supply typically softens prices + rents 12–24 months out; constrained supply supports both.
Investment metrics
- 1% rule
- 0.94% ✗
- Cap rate
- 7.83%
- Cash-on-cash
- 5.50%
- DSCR
- 1.24
- GRM
- 8.9
CMA / ARV
- ARV (on-the-fly)
- $317,592
- Comps found
- 7
Show comp detail 7 sales within ~0.75 mi
| Address | Dist | Beds/Ba | Sqft | Sold | Price | $/sf | Match |
|---|---|---|---|---|---|---|---|
| 2049 Pinebrook St | 0.08mi | 4/2.0 (+1) | 2,406 (0%) | 20mo | $267,500 | $111 | 74 |
| 1665 NE Spring Valley Cir | 0.48mi | 3/2.5 | 2,322 (-4%) | 9mo | $135,000 | $58 | 63 |
| 131 Club Acres Blvd | 0.68mi | 3/2.0 | 2,376 (-1%) | 8mo | $285,000 | $120 | 60 |
| 168 Cloister Cove Ln | 0.39mi | 4/3.0 (+1) | 2,103 (-13%) | 2mo | $330,000 | $157 | 50 |
| 2550 Lakeside Dr | 0.55mi | 3/2.5 | 2,266 (-6%) | 22mo | $300,000 | $132 | 44 |
| 180 Sago Palm Dr | 0.65mi | 4/2.5 (+1) | 2,558 (+6%) | 12mo | $380,000 | $149 | 42 |
| 1724 Old Riley St | 0.65mi | 3/3.0 | 2,250 (-6%) | 23mo | $299,000 | $133 | 36 |
Match score weights: distance 35% · size 25% · config 20% · recency 20%. Top-matched comps best support the ARV.
Projected returns pro-forma
3.0% appreciation · 3.0% rent growth · sell at horizon
- IRR
- 12.6%
- Equity multiple
- 1.72×
- Total profit
- $49,445
- Equity at exit
- $110,163
- IRR
- 14.6%
- Equity multiple
- 3.16×
- Total profit
- $147,896
- Equity at exit
- $169,774
Cash invested: $68,600 (down + closing). Projections, not guarantees.
Landlord ↔ Tenant lean methodology
- Overall (STATE)
- 90 Strongly Landlord-Friendly
- State South Carolina
- 90 Strongly Landlord-Friendly · R+6
- County
- — inherits STATE
- City
- — inherits STATE
ZIP-level market 29118-2950
- Active inventory
- 1
- Price-to-rent
- 8.9×
Monthly cashflow live
- Estimated rent
- $2,300 medium interval (Pro) →
- Mortgage (P&I)
- −$1,285
- Tax from tax record
- −$116 /mo · $1,391/yr
- Insurance
- −$102
- HOA
- −$0
- Vacancy / Maint / Mgmt
- −$483
- Net cashflow
- $314
Break-even live
UW: 25.0% down · 7.5% · 30yr · 1.5% tax · 5.0% vac · 8.0% maint · 8.0% mgmt
Financing live
Cash to close
- Down payment
- $61,250
- Closing costs
- $7,350
- Reserves months
- —
- Total cash needed
- —
Loan-product check · same deal, 3 products live
Conventional
25% down · 7.5% · 30yr
- Down + closing
- —
- Monthly P&I
- —
- Monthly cashflow
- —
- DSCR
- —
- Eligible?
- —
Personal DTI + credit; lowest rate.
DSCR
20% down · 8.5% · 30yr
- Down + closing
- —
- Monthly P&I
- —
- Monthly cashflow
- —
- DSCR
- —
- Eligible?
- —
No personal income docs; deal must DSCR.
Hard money
10% down · 12.0% · 12mo
- Down + closing
- —
- Monthly P&I
- —
- Monthly cashflow
- —
- DSCR
- —
- Eligible?
- —
Short-term bridge; refi at stabilization.
Rent comps 1 comps
| Address | Beds | Baths | Sqft | Rent | $/sqft | DOM | Units | Dist |
|---|---|---|---|---|---|---|---|---|
| 3234 Hunter Dr Orangeburg, SC | 3.0 | 2.5 | 1989 | $2,300 | $1.16 | 3d | 1 | 1.29mi |
Listing history 17 events
-
2026-06-19days on market $245,000 Active 21 DOM
-
2026-06-18days on market $245,000 Active 20 DOM
-
2026-06-17days on market $245,000 Active 19 DOM
-
2026-06-16days on market $245,000 Active 18 DOM
-
2026-06-15days on market $245,000 Active 17 DOM
-
2026-06-14days on market $245,000 Active 15 DOM
-
2026-06-12days on market $245,000 Active 14 DOM
-
2026-06-09days on market $245,000 Active 11 DOM
-
2026-06-08days on market $245,000 Active 10 DOM
-
2026-06-07days on market $245,000 Active 9 DOM
-
2026-06-07days on market $245,000 Active 8 DOM
-
2026-06-04days on market $245,000 Active 5 DOM
-
2026-06-02days on market $245,000 Active 4 DOM
-
2026-06-01days on market $245,000 Active 3 DOM
-
2026-05-31days on market $245,000 Active 2 DOM
-
2026-05-29$245,000 Active
-
2013-01-29soldstatus $137,500
ⓘ Source: listings_history table (triggers on properties + properties_extension) + one-shot
backfill from property_details.listing_events for pre-trigger history.
Tax reassessment forecast SC · Resets to sale price
- Current annual tax
- $1,391 · $116/mo
- Projected year-2 tax
- $1,396 · $116/mo
- Expected delta
- +$6/yr ($0/mo · 0.4%)
ⓘ Screening estimate from a state-policy table — verify with the county assessor before closing.
Climate risk First Street
- Flood 1/10 Low FEMA zone X (unshaded) · 0% chance over 30 yrs
- Wildfire 3/10 Moderate
- Heat 7/10 Severe 7 d/yr ≥108°F today · 16 d/yr by 30 yrs out
- Wind 8/10 Severe 80% chance of damaging wind over 30 yrs
- Air quality 3/10 Moderate 3 unhealthy d/yr today · 3 by 30 yrs out
Nearby sold comps map
Loading sold comps map…
Walkable amenities ~0.75 mi
Loading nearby amenities…
Taxation est. · year 1
- Rental income
- $27,600
- − Mortgage interest
- −$13,724
- − Property taxes
- −$1,391
- − Insurance
- −$1,225
- − Repairs & maintenance
- −$2,208
- − Management
- −$2,208
- − Depreciation
- −$7,127
- Taxable loss
- −$283
- Est. tax savings @ 24.0%
- +$68
- After-tax cash flow
- $3,839/yr
For passive investors: Depreciation is non-cash, so a rental often shows a tax loss while cash-flowing — sheltering income. Rental losses are passive: they offset passive income freely, and up to $25,000/yr can offset ordinary (W-2) income if you actively participate and your MAGI is under $100k (phasing out to $0 by $150k); unused losses carry forward. On sale, claimed depreciation is recaptured at up to 25%, and gains may owe capital-gains tax (a 1031 exchange can defer both). Figures are a year-1 estimate at your 24.0% rate — not tax advice; consult a CPA.
Schools (NCES district)
No district data.
Livability — Orangeburg
- Score
- 54/100
- State rank
- #324
- US rank
- #23942
Category grades
Schools grade is shown separately in the Schools card above.
Census & demographics
- Census place
- Orangeburg, SC
Population outlook (Orangeburg County) Hauer SSP2
- Today (2025)
- 82,698 people
- By 2030
- 78,615 · -4.9%
- By 2040
- 69,308 · -16.2%
- By 2050
- 60,629 · -26.7%
- By 2075
- 42,678 · -48.4%
- By 2100
- 28,136 · -66.0%
Not yet ingested
- Political lean
- —
- Race & ethnicity
- —
- Common origin
- —
- Civics
- —
Market trends
- HPI YoY
- —
- Current HPI
- —
- Rent YoY
- —
- Metro
- —
- State GDP YoY
- ▲ 4.51%
- F500 in state
- 2
Industry mix (Fortune 500 HQ in SC)
| Industry | F500 HQs | Revenue |
|---|---|---|
| Packaging | 1 | $7B |
|
||
Price history
+78.2% since first listed2 events — show timeline
- 2026-05-29 Listed $245,000 Consolidated MLS
- 2013-01-29 Sold (Public Records) $137,500 Public Records
Property tax history
+5.6%/yrLatest (2024): $1,391 · +19.1% YoY. Source: county tax records.
Cash-flow waterfall
monthlySold comps — $/sqft
last 12 mo · ≤1 miLoading sold comps…