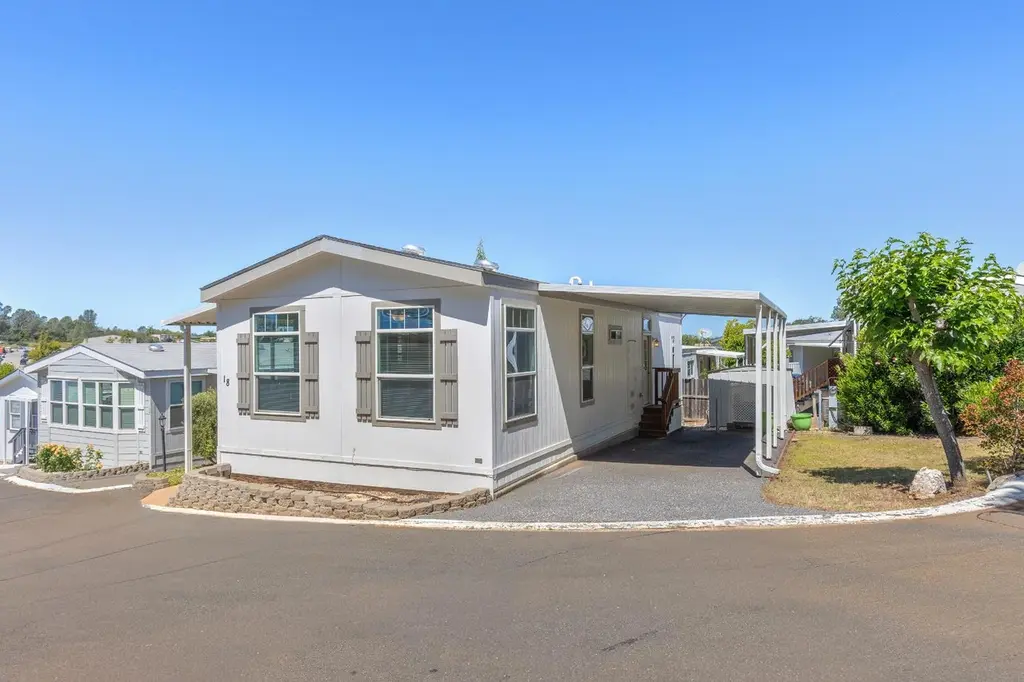
2540 Grass Valley Hwy #18 · North Auburn, CA
Flood risk 1/10 · Minimal
- FEMA flood zone
- X (unshaded)
- Chance of flooding over 30 yrs
- 0.0%
- Est. flood insurance / yr
- $507 – $1,088
Fire risk 10/10 · Severe
- Est. fire insurance / yr
- $659 – $1,223
Heat risk 6/10 · Moderate
- Hot days now (above 99°F)
- 7 days/yr
- Hot days in 30 yrs
- 15 days/yr
Wind risk 1/10 · Minimal
- Chance of severe wind over 30 yrs
- —
Air-quality risk 10/10 · Severe
- Unhealthy air days now
- 34 days/yr
- Unhealthy air days in 30 yrs
- 41 days/yr
Risk factors via First Street. Map © Google.
Why this score? — see what drove the C+ grade
The composite is a weighted blend of 9 inputs, each scored 0–100. Each bar is that input's sub-score; the figure is the points it added to the 100-point composite (weight × sub-score).
- Cash flow +30.0/30.0
- DSCR +10.0/10.0
- 1% rule +8.9/10.0
- Schools +4.9/10.0
- Rent growth +3.1/5.0
- Livability +3.1/5.0
- Condition / age +2.5/5.0
- ARV discount +0.0/15.0
- Appreciation +0.0/10.0
$130,000
🖨 Deal sheet (PDF) 📄 Offer letter ✓ Due diligence
Listing remarks
Bright, modern, move in ready home with functional layout, natural light, and comfort in a welcoming senior community setting. Located in Golden Chain Mobile Home Park, a 55+ community in Auburn, this well-maintained 2018 manufactured home features a great floor plan designed for easy living. The functional kitchen opens seamlessly to the living room and dining area, creating a bright, connected space perfect for everyday comfort. Enjoy a small side yard with grass, offering a outdoor area without the upkeep of a large yard. Ideally situated near the canal and just minutes from the hospital, dining, and grocery shopping, this home combines convenience, care, and low-maintenance living.
Key facts
- Functional kitchen
- Small side yard
- Near the canal
Tags
Property features AI
Finance
- Financial info: Land lease amount: $825
- HOA & community: No homeowners association; Located in a senior community; Land lease: no (land lease amount listed separately)
Exterior
- Parking: Attached covered parking; Guest parking available
- Utilities: Individual electric meter; Individual gas meter; Natural gas connected; Public water; Public sewer
- Home design: Manufactured home in a park; Double wide; Built in 2018
- Construction: Fleetwood make; Wood skirting
- Exterior features: Composition roof; Porch; Covered patio; Porch steps; Lot details: see remarks
Interior
- Kitchen: Free standing gas range; Free standing refrigerator; Dishwasher; Microwave; Range hood; Disposal; Pantry
- Bedrooms: 2 bedrooms
- Flooring: Carpet; Laminate
- Bathrooms: 2 full bathrooms; One bathroom with tub and shower over; Shower stall(s)
- Heating & cooling: Central heating (natural gas); Central air conditioning; Ceiling fans
- Interior features: Open great room living area; Pantry cabinet; Dining and living area combined; Covered porch and covered patio with porch steps; Pets allowed (with limit)
- Laundry & utility: Washer and dryer included; Laundry located inside the home; 220V outlet in laundry area
Neighborhood map
What this means for you Summary
Snapshot
- This is a 2-bed/2.0-bath manufactured listed at $130k.
Deal economics
- At list price, monthly cash flow is $526 ($6k/yr) — positive.
- The deal already cash-flows at list — no discount required.
- Meets the 1% rule at list price ($2k rent vs $130k).
- Cap rate 11.2% vs local median 2.6% in North Auburn — top-decile yield for the area; either an underpriced asset or a hidden risk that comps aren't pricing in. Stress-test before assuming the spread holds.
Location & tenants
- Location reads 61/100 on livability (#519 in CA) — a middle-class / working-renter tenant base. Strengths: employment A-, housing A-; Watch: crime D-, amenities F, commute F.
- Placer Union High (suburban): math 39% / reading 72% proficiency, ranked #98 of 517 in CA (top 19%) — acceptable for families but not a draw, mixed tenant base, ~2y average lease.
- Zoned schools: Ev Cain Middle (math 23% / reading 43%, grade F, #199 of 498 statewide, top 40%, 524 students, 45% FRL); Placer High (math 30% / reading 62%, grade D-, #409 of 1,170 statewide, top 36%, 1,310 students, 30% FRL).
- Zoned-school proficiency averages 40% at this address vs 56% district-wide (-16 pts) — the specific schools serving this property underperform the Placer Union High average; the district grade overstates school quality for this exact location.
- Market conditions: Rents rising (+2.3%/yr); 205 active listings in the ZIP; 10 comparable units currently listed for rent nearby; rentals leasing fast (median 10d on market — plan ~1-2 weeks tenant-placement turnaround); solid renter incomes; 3,535 units permitted in Placer County in 2024 (689 in 5+ unit buildings).
Forward outlook
- Local home prices are declining (-3.0%/yr); year-one equity from $899 of loan paydown is wiped out by about $4k of value loss. Plan a longer hold.
- Placer County population projected at +20% by 2050 — long-run rental-demand tailwind backs the buy-and-hold thesis.
- At projected returns (-3.0% appreciation + 2.3% rent growth), your $36k cash investment doubles in ~8 years — after that, you're playing with house money.
Negotiation context
- Only 5 days on market — expect competitive offers; lowballing is unlikely to land.
Risks & watch-outs
- Climate carrying-cost: severe wildfire risk; extreme-heat days projected 7→15/yr by 2055 (HVAC capex compounding) — expect insurance premiums to compound above CPI over the hold.
Questions for the listing agent
- Is there a deadline driving the sale (1031 exchange, divorce, estate, relocation)? That informs how much negotiation room exists.
- Schools are F-rated, which usually means shorter tenancies and higher turnover. Who's the typical renter profile here, and what's been the actual vacancy rate?
- Crime grade is D in this area — have there been break-ins, vandalism, or insurance claims at this property in the last 3 years? What carrier currently insures it and at what premium?
- What's the average days-on-market for RENTAL listings here right now (not sales)? A rising rental-DOM trend means longer vacancies and softer asking-rent achievability than the comps imply.
- What's the recent tenant-quality profile in this submarket — average credit score on applications, eviction rate, late-payment / NSF rate, and stable-employment percentage? A property-management company in the area should have these aggregated.
- How much new for-sale + rental construction is in the pipeline within 1–3 miles? Heavy new supply typically softens prices + rents 12–24 months out; constrained supply supports both.
Investment metrics
- 1% rule
- 1.39% ✓
- Cap rate
- 11.15%
- Cash-on-cash
- 17.36%
- DSCR
- 1.77
- GRM
- 6.0
CMA / ARV
- ARV (on-the-fly)
- $110,400
- Comps found
- 8
Show comp detail 8 sales within ~0.75 mi
| Address | Dist | Beds/Ba | Sqft | Sold | Price | $/sf | Match |
|---|---|---|---|---|---|---|---|
| 2540 Grass Valley Hwy #18 | 0.00mi | 2/2.0 | 960 (0%) | 1mo | $131,000 | $136 | 99 |
| 2540 Grass Valley Hwy #112 | 0.00mi | 2/2.0 | 840 (-12%) | 6mo | $80,000 | $95 | 75 |
| 2540 Grass Valley Hwy #12 | 0.30mi | 2/2.0 | 1,026 (+7%) | 3mo | $115,000 | $112 | 72 |
| 2540 Grass Valley Hwy #27 | 0.30mi | 2/2.0 | 1,040 (+8%) | 2mo | $92,000 | $88 | 70 |
| 2540 Grass Valley Hwy #51 | 0.00mi | 2/1.0 | 840 (-12%) | 13mo | $72,000 | $86 | 64 |
| 2540 Grass Valley Hwy #75 | 0.30mi | 2/2.0 | 1,060 (+10%) | 7mo | $157,000 | $148 | 63 |
| 2540 Grass Valley Hwy #133 | 0.30mi | 2/2.0 | 840 (-12%) | 6mo | $97,000 | $115 | 60 |
| 2540 Grass Valley Hwy #17 | 0.30mi | 2/2.0 | 1,000 (+4%) | 24mo | $165,000 | $165 | 59 |
Match score weights: distance 35% · size 25% · config 20% · recency 20%. Top-matched comps best support the ARV.
Projected returns pro-forma
-3.0% appreciation · 2.34% rent growth · sell at horizon
- IRR
- 8.0%
- Equity multiple
- 1.31×
- Total profit
- $11,301
- Equity at exit
- $19,383
- IRR
- 16.7%
- Equity multiple
- 2.33×
- Total profit
- $48,308
- Equity at exit
- $11,240
Cash invested: $36,400 (down + closing). Projections, not guarantees.
Landlord ↔ Tenant lean methodology
- Overall (STATE)
- 18 Strongly Tenant-Friendly
- State California
- 18 Strongly Tenant-Friendly · D+13
- County
- — inherits STATE
- City
- — inherits STATE
ZIP-level market 95603
- Rents YoY
- 2.3%
- Active inventory
- 205
- Price-to-rent
- 6.0×
Monthly cashflow live
- Estimated rent
- $1,804 high interval (Pro) →
- Mortgage (P&I)
- −$682
- Tax est. 1.5%
- −$162 /mo · $1,950/yr
- Insurance
- −$54
- HOA
- −$0
- Vacancy / Maint / Mgmt
- −$379
- Net cashflow
- $526
Break-even live
Sensitivity live
| Price | -10% $616 | -5% $571 | +0% $526 | +5% $482 | +10% $437 |
|---|---|---|---|---|---|
| Rent | -10% $384 | -5% $455 | +0% $526 | +5% $598 | +10% $669 |
| Rate | -1.0pp $592 | -0.5pp $560 | base $526 | +0.5pp $493 | +1.0pp $458 |
UW: 25.0% down · 7.5% · 30yr · 1.5% tax · 5.0% vac · 8.0% maint · 8.0% mgmt
Financing live
Cash to close
- Down payment
- $32,500
- Closing costs
- $3,900
- Reserves months
- —
- Total cash needed
- —
Loan-product check · same deal, 3 products live
Conventional
25% down · 7.5% · 30yr
- Down + closing
- —
- Monthly P&I
- —
- Monthly cashflow
- —
- DSCR
- —
- Eligible?
- —
Personal DTI + credit; lowest rate.
DSCR
20% down · 8.5% · 30yr
- Down + closing
- —
- Monthly P&I
- —
- Monthly cashflow
- —
- DSCR
- —
- Eligible?
- —
No personal income docs; deal must DSCR.
Hard money
10% down · 12.0% · 12mo
- Down + closing
- —
- Monthly P&I
- —
- Monthly cashflow
- —
- DSCR
- —
- Eligible?
- —
Short-term bridge; refi at stabilization.
Rent comps 10 comps
| Address | Beds | Baths | Sqft | Rent | $/sqft | DOM | Units | Dist |
|---|---|---|---|---|---|---|---|---|
| 11754 Jones St Unit 11754 Auburn, CA | 1.0 | 1.0 | 700 | $1,595 | $2.28 | 5d | 1 | 0.21mi |
| 11752 Jones St Unit 11752 Auburn, CA | 2.0 | 1.0 | 815 | $1,795 | $2.20 | 12d | 1 | 0.21mi |
| 11700 Garnet Way #4 Auburn, CA | 2.0 | 1.0 | 840 | $1,695 | $2.02 | 19d | 1 | 0.64mi |
| 11550 Garnet Way #2 Auburn, CA | 2.0 | 1.5 | 966 | $1,725 | $1.79 | 9d | 1 | 0.74mi |
| 3585 Sapphire Dr #4 Auburn, CA | 2.0 | 1.0 | 900 | $1,375 | $1.53 | 0d | 1 | 0.75mi |
| 3633 Park Dr #2 Auburn, CA | 2.0 | 1.0 | 922 | $1,699 | $1.84 | 0d | 1 | 0.79mi |
| 3713 Park Dr #4 Auburn, CA | 1.0 | 1.0 | 900 | $1,675 | $1.86 | 14d | 1 | 0.88mi |
| 3681 Galena Dr #2 Auburn, CA | 2.0 | 1.5 | 991 | $1,800 | $1.82 | 9d | 1 | 0.92mi |
| 3711 Galena Dr #3 Auburn, CA | 2.0 | 1.5 | 991 | $1,850 | $1.87 | 3d | 1 | 0.94mi |
| 11325 Quartz Dr Auburn, CA | 1.0–2.0 | 1.0 | 775 | $2,069 | $2.67 | 0d | 8 | 0.96mi |
Climate risk First Street
- Flood 1/10 Low FEMA zone X (unshaded) · 0% chance over 30 yrs
- Wildfire 10/10 Extreme
- Heat 6/10 Major 7 d/yr ≥99°F today · 15 d/yr by 30 yrs out
- Wind 1/10 Low
- Air quality 10/10 Extreme 34 unhealthy d/yr today · 41 by 30 yrs out
Nearby sold comps map
Loading sold comps map…
Walkable amenities ~0.75 mi
Loading nearby amenities…
Taxation est. · year 1
- Rental income
- $21,643
- − Mortgage interest
- −$7,282
- − Property taxes
- −$1,950
- − Insurance
- −$650
- − Repairs & maintenance
- −$1,731
- − Management
- −$1,731
- − Depreciation
- −$3,782
- Taxable income
- $4,516
- Est. tax owed @ 24.0%
- −$1,084
- After-tax cash flow
- $5,233/yr
For passive investors: Depreciation is non-cash, so a rental often shows a tax loss while cash-flowing — sheltering income. Rental losses are passive: they offset passive income freely, and up to $25,000/yr can offset ordinary (W-2) income if you actively participate and your MAGI is under $100k (phasing out to $0 by $150k); unused losses carry forward. On sale, claimed depreciation is recaptured at up to 25%, and gains may owe capital-gains tax (a 1031 exchange can defer both). Figures are a year-1 estimate at your 24.0% rate — not tax advice; consult a CPA.
Schools (NCES district)
- District
- Placer Union High
- NCES district ID
- 0630750
- Math proficiency
- 39% ▲ 1.00%
- Reading proficiency
- 72% ▲ 3.00%
- Median HH income
- $69,119
- Composite
- 49.04/100
- National rank
- #2060
- State rank
- #98 of 517 in CA
Livability — North Auburn
- Score
- 61/100
- State rank
- #519
- US rank
- #17512
Category grades
Schools grade is shown separately in the Schools card above.
Census & demographics
- Census place
- North Auburn, CA
- County
- Placer County · 390,510 people
- City population
- 28,195
- Metro
- Sacramento-Roseville-Folsom, CA
- Population (ZIP)
- 28,432
- Household income
- $85,357
- Rent vs Own
- Severe rent burden
- 1017.0
Population outlook (Placer County) Hauer SSP2
- Today (2025)
- 422,709 people
- By 2030
- 444,249 · +5.1%
- By 2040
- 480,192 · +13.6%
- By 2050
- 506,390 · +19.8%
- By 2075
- 550,219 · +30.2%
- By 2100
- 547,760 · +29.6%
Race, ethnicity, and origin ACS 2023
- Neighborhood character
- Predominantly White (73%)
- Race & ethnicity
- White 73% Hispanic / Latino 17% Two or more races 11% Asian 3%
- Hispanic origin (detail)
- Mexican 12%
- Common ancestry
- Italian 3% Slovak 3% Lithuanian 2%
- Foreign-born
- 9% · Canada, South Korea
- Languages at home
- 88% English-only · Spanish 10% Other Indo-European 1% Tagalog/Filipino 1%
Political lean MEDSL · Placer
- 2024 margin
- Lean R (+8.5) · D 44.3% · R 52.8% · Other 2.9%
- 2008→2024 swing
- +2.8pp toward D · 2008: -11.3pp · 2024: -8.5pp
- All cycles
- 2024: R+8.5 2020: R+6.7 2016: R+11.3 2012: R+20.1 2008: R+11.3
Not yet ingested
- Civics
- —
Market trends
- HPI YoY
- ▼ -500.89%
- Current HPI
- 251.4573
- Rent YoY
- ▲ 2.34%
- Metro
- Sacramento-Roseville-Folsom, CA
- State GDP YoY
- ▲ 3.21%
- F500 in state
- 116
Industry mix (Fortune 500 HQ in CA)
| Industry | F500 HQs | Revenue |
|---|---|---|
| Technology | 27 | $1,492B |
|
||
| Financial Services | 3 | $174B |
|
||
| Retail | 3 | $44B |
|
||
| Insurance | 3 | $26B |
|
||
| Media / Entertainment | 2 | $115B |
|
||
| Pharmaceuticals / Biotech | 2 | $62B |
|
||
Cash-flow waterfall
monthlySold comps — $/sqft
last 12 mo · ≤1 miLoading sold comps…