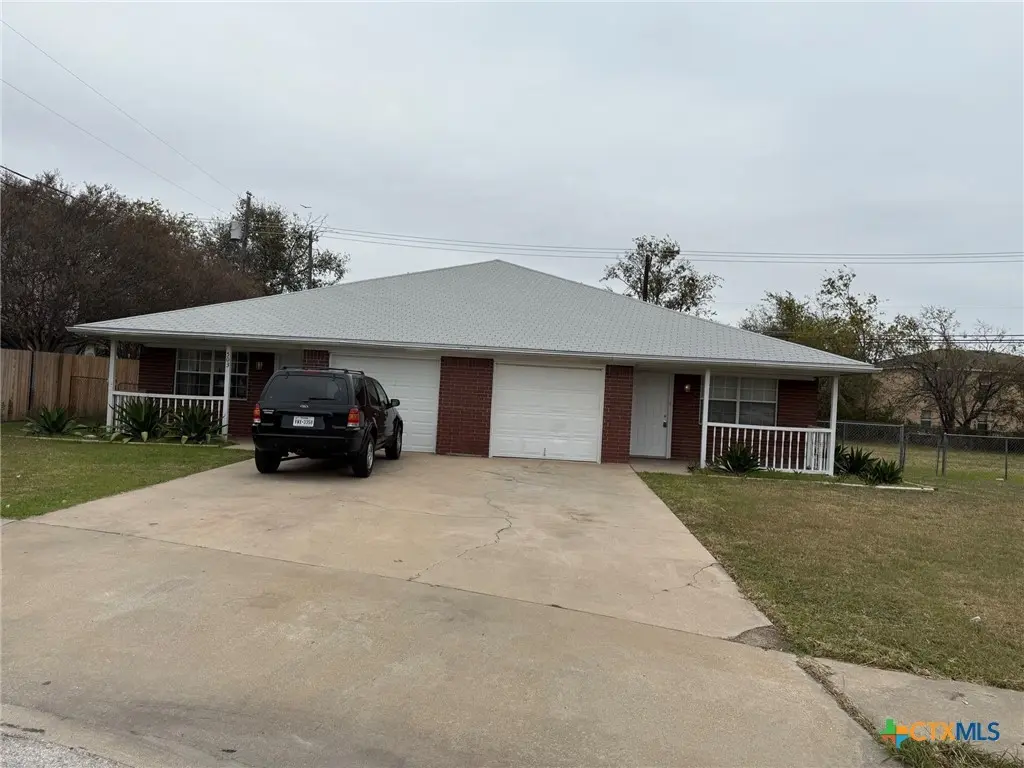
503 Angus Cir · Killeen, TX
Flood risk 6/10 · Moderate
- FEMA flood zone
- X (unshaded)
- Chance of flooding over 30 yrs
- 0.72%
- Est. flood insurance / yr
- $507 – $1,088
Fire risk 5/10 · Moderate
- Est. fire insurance / yr
- $1,222 – $2,270
Heat risk 8/10 · Major
- Hot days now (above 107°F)
- 7 days/yr
- Hot days in 30 yrs
- 24 days/yr
Wind risk 6/10 · Moderate
- Chance of severe wind over 30 yrs
- 56.0%
Air-quality risk 1/10 · Minimal
- Unhealthy air days now
- 0 days/yr
- Unhealthy air days in 30 yrs
- 0 days/yr
Risk factors via First Street. Map © Google.
Why this score? — see what drove the D- grade
The composite is a weighted blend of 9 inputs, each scored 0–100. Each bar is that input's sub-score; the figure is the points it added to the 100-point composite (weight × sub-score).
- ARV discount +15.0/15.0
- Cash flow +9.0/30.0
- Livability +3.2/5.0
- Schools +3.0/10.0
- 1% rule +2.9/10.0
- DSCR +2.5/10.0
- Condition / age +2.5/5.0
- Rent growth +2.0/5.0
- Appreciation +0.0/10.0
$240,000
🖨 Deal sheet (PDF) 📄 Offer letter ✓ Due diligence
Listing remarks MLS
Duplex has been well maintained and good rental history/cash flow history.
Key facts
- Quiet cul-de-sac
- Convenient location
- Garage
Tags
Property features AI
Finance
- Financial info: Two-unit property; Each unit currently showing actual rent of $1,000
Exterior
- Parking: Has garage (1 garage space)
- Utilities: Public water; Public sewer
- Home design: Single-story building; Resale property
- Construction: Brick veneer/masonry exterior; Composition/shingle roof; Slab foundation; Year built per assessor
- Exterior features: Chain link fence around back yard; City lot, less than quarter acre; City street frontage; No water features
Interior
- Kitchen: Electric range; Refrigerator; Some electric appliances
- Bedrooms: Two 3-bedroom units (each unit described as having 3 bedrooms)
- Flooring: Tile
- Bathrooms: Two 2-bath units (each unit described as having 2 bathrooms)
- Heating & cooling: Central electric air conditioning; Electric heating
- Interior features: Tile flooring; Tub with shower
- Laundry & utility: Laundry located in garage
Neighborhood map
What this means for you Summary
Snapshot
- This is a 6-bed/1.0-bath townhouse listed at $240k.
Deal economics
- At list price, monthly cash flow is $-191 ($-2k/yr) — negative.
- To cash-flow at today's rent, offer at most $206k (14.1% below list).
- To meet the 1% rule (rent ≥ 1% of price), the offer needs to be $189k (21.4% below list).
- Recommended offer: $189k (21.4% below list) — sets the bar for 1% rule.
- Cap rate 5.3% vs local median 3.9% in Killeen — top-decile yield for the area; either an underpriced asset or a hidden risk that comps aren't pricing in. Stress-test before assuming the spread holds.
Location & tenants
- Location reads 63/100 on livability (#853 in TX) — a middle-class / working-renter tenant base. Strengths: cost of living A+, housing A+; Watch: amenities D, employment D, crime D-.
- Killeen ISD (urban): math 31% / reading 38% proficiency, ranked #524 of 826 in TX (top 63%) — families likely to look elsewhere, expect single-tenant / working-renter base with shorter leases.
- Zoned schools: Reeces Creek El (math 23% / reading 29%, grade F, #2,954 of 4,322 statewide, top 69%, 856 students, 67% FRL); C E Ellison H S (math 20% / reading 51%, grade F, #941 of 1,632 statewide, top 58%, 1,682 students, 57% FRL).
- Market conditions: Rents soft (-1.9%/yr); 644 active listings in the ZIP; 1 comparable units currently listed for rent nearby; 3,222 units permitted in Bell County in 2024 (246 in 5+ unit buildings).
- This rent runs 31% of the median local income ($74k/yr) — at the standard rent-burdened threshold; future hikes will face affordability resistance.
Forward outlook
- Local home prices are declining (-3.0%/yr); year-one equity from $2k of loan paydown is wiped out by about $7k of value loss. Plan a longer hold.
- Bell County population projected at +21% by 2050 — long-run rental-demand tailwind backs the buy-and-hold thesis.
Negotiation context
- It's been on market 42 days — a 3% lower offer ($233k) is reasonable based on typical stale-listing flexibility.
- 8 sale attempts since 16y ago with the ask held roughly flat each time — persistent listings suggest the price (not the market) is what's stuck; bring a comps-based counter.
- Current owner paid $130k; list at $240k implies a 85% gain — meaningful room to come down on a strong offer.
Risks & watch-outs
- Climate carrying-cost: major flood risk; major wind risk, 56% chance of damaging wind over 30y; moderate wildfire risk; extreme-heat days projected 7→24/yr by 2055 (HVAC capex compounding) — expect insurance premiums to compound above CPI over the hold.
Questions for the listing agent
- What do current leases actually rent for vs. the listed asking? Can we see a recent rent roll and the last 12 months of T-12 income?
- It's been on market 42 days. Have you received any prior offers? Is the seller open to a 21% concession, seller financing, or rate buy-down credit?
- Is there a deadline driving the sale (1031 exchange, divorce, estate, relocation)? That informs how much negotiation room exists.
- Schools are D-rated, which usually means shorter tenancies and higher turnover. Who's the typical renter profile here, and what's been the actual vacancy rate?
- Crime grade is D in this area — have there been break-ins, vandalism, or insurance claims at this property in the last 3 years? What carrier currently insures it and at what premium?
- The area grade is low — what's the realistic commute time and amenity access for the typical tenant pool here? Any planned neighborhood developments (good or bad) we should know about?
- What's the average days-on-market for RENTAL listings here right now (not sales)? A rising rental-DOM trend means longer vacancies and softer asking-rent achievability than the comps imply.
- What's the recent tenant-quality profile in this submarket — average credit score on applications, eviction rate, late-payment / NSF rate, and stable-employment percentage? A property-management company in the area should have these aggregated.
- How much new for-sale + rental construction is in the pipeline within 1–3 miles? Heavy new supply typically softens prices + rents 12–24 months out; constrained supply supports both.
Investment metrics
- 1% rule
- 0.79% ✗
- Cap rate
- 5.34%
- Cash-on-cash
- -3.41%
- DSCR
- 0.85
- GRM
- 10.6
CMA / ARV
- ARV (median comp)
- $362,500
- List price
- $240,000
- Delta
- -33.79%
- Verdict
- UNDERPRICED
- Comps
- 2 within 1.0 mi
Show comp detail 1 sale within ~0.75 mi
| Address | Dist | Beds/Ba | Sqft | Sold | Price | $/sf | Match |
|---|---|---|---|---|---|---|---|
| 3102 Baldwin Loop | 0.49mi | 6/4.0 | 2,598 (+14%) | 4mo | $350,000 | $135 | 39 |
Match score weights: distance 35% · size 25% · config 20% · recency 20%. Top-matched comps best support the ARV.
Projected returns pro-forma
-3.0% appreciation · 0.0% rent growth · sell at horizon
- IRR
- -25.4%
- Equity multiple
- 0.16×
- Total profit
- $-56,539
- Equity at exit
- $35,785
- IRR
- -35.2%
- Equity multiple
- -0.28×
- Total profit
- $-86,083
- Equity at exit
- $20,751
Cash invested: $67,200 (down + closing). Projections, not guarantees.
Landlord ↔ Tenant lean methodology
- Overall (STATE)
- 87 Strongly Landlord-Friendly
- State Texas
- 87 Strongly Landlord-Friendly · R+5
- County
- — inherits STATE
- City
- — inherits STATE
ZIP-level market 76542
- Home prices YoY
- -21.7%
- Rents YoY
- -1.9%
- Active inventory
- 644
- Price-to-rent
- 10.6×
Monthly cashflow live
- Estimated rent
- $1,886 medium interval (Pro) →
- Mortgage (P&I)
- −$1,259
- Tax from tax record
- −$322 /mo · $3,866/yr
- Insurance
- −$100
- HOA
- −$0
- Vacancy / Maint / Mgmt
- −$396
- Net cashflow
- $-191
Break-even live
Sensitivity live
| Price | -10% $-55 | -5% $-123 | +0% $-191 | +5% $-259 | +10% $-327 |
|---|---|---|---|---|---|
| Rent | -10% $-340 | -5% $-265 | +0% $-191 | +5% $-116 | +10% $-42 |
| Rate | -1.0pp $-70 | -0.5pp $-130 | base $-191 | +0.5pp $-253 | +1.0pp $-316 |
UW: 25.0% down · 7.5% · 30yr · 1.5% tax · 5.0% vac · 8.0% maint · 8.0% mgmt
Financing live
Cash to close
- Down payment
- $60,000
- Closing costs
- $7,200
- Reserves months
- —
- Total cash needed
- —
Loan-product check · same deal, 3 products live
Conventional
25% down · 7.5% · 30yr
- Down + closing
- —
- Monthly P&I
- —
- Monthly cashflow
- —
- DSCR
- —
- Eligible?
- —
Personal DTI + credit; lowest rate.
DSCR
20% down · 8.5% · 30yr
- Down + closing
- —
- Monthly P&I
- —
- Monthly cashflow
- —
- DSCR
- —
- Eligible?
- —
No personal income docs; deal must DSCR.
Hard money
10% down · 12.0% · 12mo
- Down + closing
- —
- Monthly P&I
- —
- Monthly cashflow
- —
- DSCR
- —
- Eligible?
- —
Short-term bridge; refi at stabilization.
Rent comps 1 comps
| Address | Beds | Baths | Sqft | Rent | $/sqft | DOM | Units | Dist |
|---|---|---|---|---|---|---|---|---|
| 1701 Lennox Ave Killeen, TX | 5.0 | 2.0 | 1858 | $1,450 | $0.78 | 45d | 1 | 1.00mi |
Listing history 38 events
-
2026-06-18days on market $240,000 Active 42 DOM
-
2026-06-17pricedays on market $240,000 Active 41 DOM
-
2026-06-16days on market $250,000 Active 40 DOM
-
2026-06-15days on market $250,000 Active 39 DOM
-
2026-06-14days on market $250,000 Active 37 DOM
-
2026-06-13days on market $250,000 Active 36 DOM
-
2026-06-10days on market $250,000 Active 34 DOM
-
2026-06-09days on market $250,000 Active 33 DOM
-
2026-06-08days on market $250,000 Active 32 DOM
-
2026-06-07days on market $250,000 Active 31 DOM
-
2026-06-03days on market $250,000 Active 27 DOM
-
2026-06-02days on market $250,000 Active 26 DOM
-
2026-06-01days on market $250,000 Active 25 DOM
-
2026-05-31days on market $250,000 Active 24 DOM
-
2026-05-30days on market $250,000 Active 23 DOM
-
2026-05-07$250,000 Active 319-char remark
-
2026-04-17historical $1,000
-
2026-04-05$1,000
-
2026-03-29historical $1,000
-
2026-03-21$1,000
-
2025-09-14historical $1,100
-
2025-08-21$1,100
-
2025-08-09historical $1,100
-
2025-08-05$1,100
-
2025-05-02historical $1,100
-
2025-04-24price $1,100
-
2025-04-22price $11,100
-
2025-03-13$1,150
-
2022-02-15price $1,000
-
2022-02-13price $1,000
-
2012-07-30soldstatus
-
2012-07-27soldstatus $130,000 74-char remark
Show marketing remark (74 chars)
Duplex has been well maintained and good rental history/cash flow history.
-
2011-07-06$139,900 74-char remark
Show marketing remark (74 chars)
Duplex has been well maintained and good rental history/cash flow history.
-
2011-06-30historical
-
2010-05-05$139,900
-
2001-01-31soldstatus
-
1995-10-19soldstatus
-
1994-11-15soldstatus
ⓘ Source: listings_history table (triggers on properties + properties_extension) + one-shot
backfill from property_details.listing_events for pre-trigger history.
Tax reassessment forecast TX · Resets to sale price
- Current annual tax
- $3,866 · $322/mo
- Projected year-2 tax
- $4,392 · $366/mo
- Expected delta
- +$526/yr (+$44/mo · 13.6%)
ⓘ Screening estimate from a state-policy table — verify with the county assessor before closing.
Climate risk First Street
- Flood 6/10 Major FEMA zone X (unshaded) · 72% chance over 30 yrs
- Wildfire 5/10 Major
- Heat 8/10 Severe 7 d/yr ≥107°F today · 24 d/yr by 30 yrs out
- Wind 6/10 Major 56% chance of damaging wind over 30 yrs
- Air quality 1/10 Low 0 unhealthy d/yr today · 0 by 30 yrs out
Nearby sold comps map
Loading sold comps map…
Walkable amenities ~0.75 mi
Loading nearby amenities…
Taxation est. · year 1
- Rental income
- $22,630
- − Mortgage interest
- −$13,444
- − Property taxes
- −$3,866
- − Insurance
- −$1,200
- − Repairs & maintenance
- −$1,810
- − Management
- −$1,810
- − Depreciation
- −$6,982
- Taxable loss
- −$6,483
- Est. tax savings @ 24.0%
- +$1,556
- After-tax cash flow
- $-736/yr
For passive investors: Depreciation is non-cash, so a rental often shows a tax loss while cash-flowing — sheltering income. Rental losses are passive: they offset passive income freely, and up to $25,000/yr can offset ordinary (W-2) income if you actively participate and your MAGI is under $100k (phasing out to $0 by $150k); unused losses carry forward. On sale, claimed depreciation is recaptured at up to 25%, and gains may owe capital-gains tax (a 1031 exchange can defer both). Figures are a year-1 estimate at your 24.0% rate — not tax advice; consult a CPA.
Schools (NCES district)
- District
- Killeen ISD
- NCES district ID
- 4825660
- Math proficiency
- 31% ▼ -16.00%
- Reading proficiency
- 38% ▼ -3.00%
- Median HH income
- $47,665
- Composite
- 29.69/100
- National rank
- #6458
- State rank
- #524 of 826 in TX
Livability — Killeen
- Score
- 63/100
- State rank
- #853
- US rank
- #15359
Category grades
Schools grade is shown separately in the Schools card above.
Census & demographics
- Census place
- Killeen, TX
- County
- Bell County · 345,090 people
- City population
- 163,398
- Metro
- Killeen-Temple, TX
- Population (ZIP)
- 53,892
- Household income
- $74,055
- Rent vs Own
- Severe rent burden
- 1167.0
Population outlook (Bell County) Hauer SSP2
- Today (2025)
- 371,114 people
- By 2030
- 389,104 · +4.8%
- By 2040
- 420,592 · +13.3%
- By 2050
- 447,779 · +20.7%
- By 2075
- 499,130 · +34.5%
- By 2100
- 505,680 · +36.3%
Race, ethnicity, and origin ACS 2023
- Neighborhood character
- Highly diverse neighborhood (Simpson 0.74)
- Race & ethnicity
- Black 34% White 27% Hispanic / Latino 26% Two or more races 17% Asian 5%
- Hispanic origin (detail)
- Mexican 13% Puerto Rican 9%
- Common ancestry
- Italian 1% Lithuanian 1% Slovak 1%
- Foreign-born
- 10% · Canada, South Korea, Vietnam
- Languages at home
- 79% English-only · Spanish 15% Korean 1% German/W. Germanic 1%
Political lean MEDSL · Bell
- 2024 margin
- R (+16.2) · D 41.3% · R 57.6% · Other 1.1%
- 2008→2024 swing
- -6.5pp toward R · 2008: -9.8pp · 2024: -16.2pp
- All cycles
- 2024: R+16.2 2020: R+8.5 2016: R+15.1 2012: R+16.4 2008: R+9.8
Not yet ingested
- Civics
- —
Market trends
- HPI YoY
- ▼ -43.94%
- Current HPI
- 158.4385
- Rent YoY
- ▼ -1.85%
- Metro
- Killeen-Temple, TX
- State GDP YoY
- ▲ 3.95%
- F500 in state
- 110
Industry mix (Fortune 500 HQ in TX)
| Industry | F500 HQs | Revenue |
|---|---|---|
| Energy | 16 | $1,198B |
|
||
| Technology | 5 | $198B |
|
||
| Engineering / Construction | 4 | $72B |
|
||
| Energy Services | 3 | $60B |
|
||
| Utilities | 3 | $41B |
|
||
| Healthcare | 2 | $330B |
|
||
Price history
+71.6% since first listed24 events — show timeline
- 2026-06-16 Price Changed $240,000 CTXMLS
- 2026-05-07 Listed $250,000 CTXMLS
- 2026-04-17 Rental Removed $1,000 BUILDIUM
- 2026-04-05 Listed for Rent $1,000 BUILDIUM
- 2026-03-29 Rental Removed $1,000 BUILDIUM
- 2026-03-21 Listed for Rent $1,000 BUILDIUM
- 2025-09-14 Rental Removed $1,100 BUILDIUM
- 2025-08-21 Listed for Rent $1,100 BUILDIUM
- 2025-08-09 Rental Removed $1,100 BUILDIUM
- 2025-08-05 Listed for Rent $1,100 BUILDIUM
- 2025-05-02 Rental Removed $1,100 BUILDIUM
- 2025-04-24 Price Changed $1,100 BUILDIUM
- 2025-04-22 Price Changed $11,100 BUILDIUM
- 2025-03-13 Listed for Rent $1,150 BUILDIUM
- 2022-02-15 Price Changed $1,000 RENT.
- 2022-02-13 Price Changed $1,000 BUILDIUM
- 2012-07-30 Sold (Public Records) — Public Records
- 2012-07-27 Sold (MLS) $130,000 CTXMLS
- 2011-07-06 Listed $139,900 CTXMLS
- 2011-06-30 Listing Removed — CTXMLS
- 2010-05-05 Listed $139,900 CTXMLS
- 2001-01-31 Sold (Public Records) — Public Records
- 1995-10-19 Sold (Public Records) — Public Records
- 1994-11-15 Sold (Public Records) — Public Records
Property tax history
+5.2%/yrLatest (2026): $3,866 · -2.9% YoY. Source: county tax records.
Cash-flow waterfall
monthlySold comps — $/sqft
last 12 mo · ≤1 miLoading sold comps…