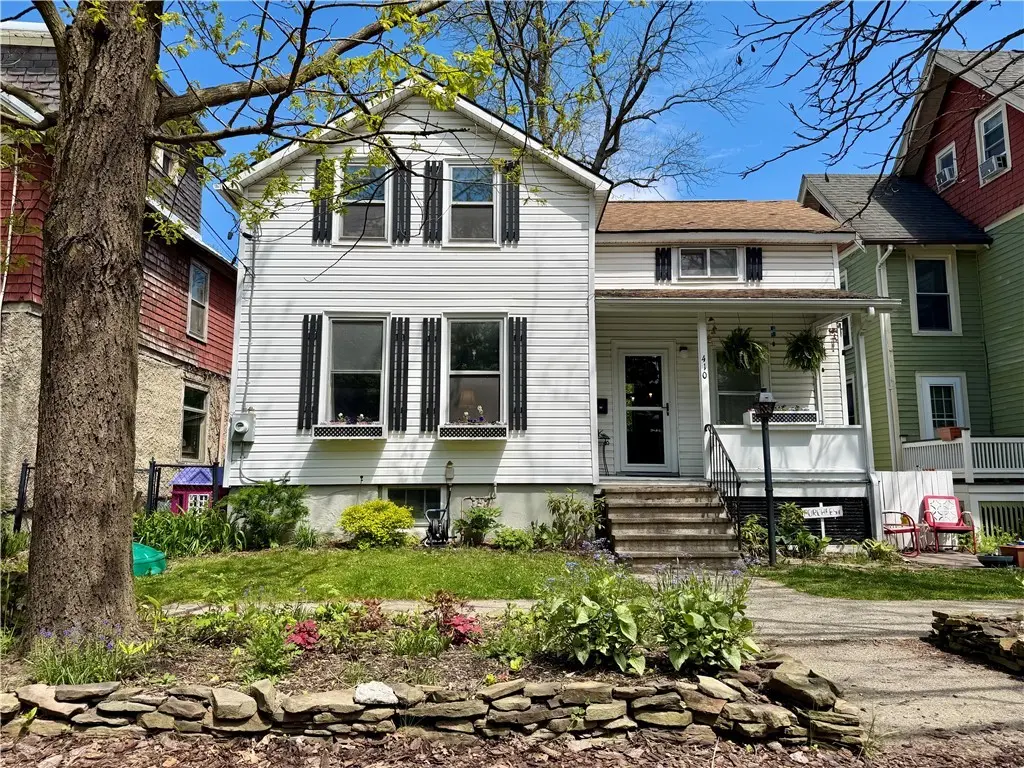
410 E Marshall St · Ithaca, NY
Flood risk 6/10 · Moderate
- FEMA flood zone
- X (shaded)
- Chance of flooding over 30 yrs
- 0.68%
- Est. flood insurance / yr
- $473 – $860
Fire risk 1/10 · Minimal
- Est. fire insurance / yr
- $691 – $1,283
Heat risk 3/10 · Minor
- Hot days now (above 94°F)
- 8 days/yr
- Hot days in 30 yrs
- 17 days/yr
Wind risk 2/10 · Minimal
- Chance of severe wind over 30 yrs
- 1.0%
Air-quality risk 2/10 · Minimal
- Unhealthy air days now
- 0 days/yr
- Unhealthy air days in 30 yrs
- 1 days/yr
Risk factors via First Street. Map © Google.
Why this score? — see what drove the D+ grade
The composite is a weighted blend of 9 inputs, each scored 0–100. Each bar is that input's sub-score; the figure is the points it added to the 100-point composite (weight × sub-score).
- ARV discount +15.0/15.0
- Cash flow +11.9/30.0
- Schools +5.4/10.0
- Livability +3.9/5.0
- Rent growth +3.8/5.0
- 1% rule +3.7/10.0
- DSCR +3.5/10.0
- Condition / age +2.5/5.0
- Appreciation +0.0/10.0
$333,000
🖨 Deal sheet (PDF) 📄 Offer letter ✓ Due diligence
Listing remarks MLS
Sweet and charming in Fall Creek. Updated kitchen with cathedral ceilings. Hardwood floors throughout with gas fireplace in the living room. Updated tiled bath. Newer furnace with dry storage in basement. Den and built-in bed on main floor. Easy living in a great neighborhood!
Key facts
- Open floor plan
- Updated amenities
- Front porch
Tags
Property features AI
Exterior
- Parking: No garage (street parking available)
- Utilities: Public water; Sewer connected; Water connected; Natural gas service
- Home design: Single-family residence; One story
- Construction: Vinyl siding; Stone foundation; Built with traditional construction materials
- Exterior features: Near public transit; Rectangular lot; Workshop (outbuilding); Full basement
Interior
- Kitchen: Dishwasher; Gas oven; Gas range; Microwave; Refrigerator
- Flooring: Hardwood; Ceramic tile; Tile; Varied flooring
- Bathrooms: One full bathroom (main level)
- Heating & cooling: Forced-air heating (natural gas); Central air conditioning
- Interior features: Breakfast bar; Eat-in kitchen; Kitchen island; Wood and tile flooring variations; Fireplace (1)
- Laundry & utility: Washer and dryer; Main-level laundry room; Gas water heater
Neighborhood map
What this means for you Summary
Snapshot
- This is a 2-bed/1.0-bath single-family listed at $333k.
Deal economics
- At list price, monthly cash flow is $-84 ($-1k/yr) — negative.
- To cash-flow at today's rent, offer at most $318k (4.5% below list).
- To meet the 1% rule (rent ≥ 1% of price), the offer needs to be $291k (12.6% below list).
- Recommended offer: $291k (12.6% below list) — sets the bar for 1% rule.
Location & tenants
- Location reads 77/100 on livability (#210 in NY, #3,240 nationally) — a middle-class / working-renter tenant base. Strengths: amenities A+, commute A+, health & safety A+; Watch: housing C-, employment D+, cost of living D.
- Ithaca City School District (urban): math 57% / reading 71% proficiency, ranked #195 of 590 in NY (top 33%) — acceptable for families but not a draw, mixed tenant base, ~2y average lease.
- Zoned schools: Fall Creek Elementary School (math 37% / reading 62%, grade D, #1,085 of 2,108 statewide, top 56%, 232 students, 40% FRL); Boynton Middle School (math 36% / reading 64%, grade C, #261 of 729 statewide, top 36%, 526 students, 36% FRL); Ithaca Senior High School (math 95% / reading 95%, grade A+, #83 of 1,100 statewide, top 8%, 1,341 students, 31% FRL).
- Market conditions: Rents rising fast (+5.2%/yr); 324 active listings in the ZIP; 8 comparable units currently listed for rent nearby; rentals lingering (median 46d on market — plan ~5-8 weeks vacancy on turnover, expect pricing pressure); 100% of comp listings sitting > 30 days — soft ceiling on asking rent; 382 units permitted in Tompkins County in 2024 (208 in 5+ unit buildings).
- At $2,912/mo this rent would consume 49% of the median local household income ($71k/yr) (locally 5169% of renters already pay >50% of income on rent) — very limited rent-growth headroom before tenants either downsize or default.
Forward outlook
- Local home prices are declining (-3.0%/yr); year-one equity from $2k of loan paydown is wiped out by about $10k of value loss. Plan a longer hold.
- Tompkins County population projected at +17% by 2050 — long-run rental-demand tailwind backs the buy-and-hold thesis.
Negotiation context
- It's been on market 41 days — a 3% lower offer ($323k) is reasonable based on typical stale-listing flexibility.
- 2 sale attempts since 10y ago; this cycle's ask has dropped $26k (7%) from the opening price — seller is motivated, your offer sets the floor, not the list.
- Current owner paid $275k; 21% above their basis — modest negotiation headroom, anchor on the comps not their cost.
Risks & watch-outs
- Watch-outs: built in 1890 — expect roof / HVAC / electrical / plumbing capex.
- Climate carrying-cost: major flood risk — expect insurance premiums to compound above CPI over the hold.
Questions for the listing agent
- What do current leases actually rent for vs. the listed asking? Can we see a recent rent roll and the last 12 months of T-12 income?
- It's been on market 41 days. Have you received any prior offers? Is the seller open to a 13% concession, seller financing, or rate buy-down credit?
- Built in 1890 — when were the roof, HVAC, electrical panel, plumbing, and water heater last replaced?
- Is there a deadline driving the sale (1031 exchange, divorce, estate, relocation)? That informs how much negotiation room exists.
- Schools are A-rated — typically a magnet for longer-tenancy family renters. What's the average tenant stay here, and is there a school-zone premium baked into asking?
- The area grade is low — what's the realistic commute time and amenity access for the typical tenant pool here? Any planned neighborhood developments (good or bad) we should know about?
- What's the average days-on-market for RENTAL listings here right now (not sales)? A rising rental-DOM trend means longer vacancies and softer asking-rent achievability than the comps imply.
- What's the recent tenant-quality profile in this submarket — average credit score on applications, eviction rate, late-payment / NSF rate, and stable-employment percentage? A property-management company in the area should have these aggregated.
- How much new for-sale + rental construction is in the pipeline within 1–3 miles? Heavy new supply typically softens prices + rents 12–24 months out; constrained supply supports both.
Investment metrics
- 1% rule
- 0.87% ✗
- Cap rate
- 5.99%
- Cash-on-cash
- -1.08%
- DSCR
- 0.95
- GRM
- 9.5
CMA / ARV
- ARV (median comp)
- $431,282
- List price
- $333,000
- Delta
- -20.01%
- Verdict
- UNDERPRICED
- Comps
- 20 within 1.0 mi
Show comp detail 11 sales within ~0.75 mi
| Address | Dist | Beds/Ba | Sqft | Sold | Price | $/sf | Match |
|---|---|---|---|---|---|---|---|
| 836-838 N Aurora St | 0.25mi | 3/1.0 (+1) | 1,184 (+0%) | 11mo | $402,500 | $340 | 74 |
| 311 Turner Pl | 0.71mi | 2/1.0 | 1,216 (+3%) | 10mo | $369,000 | $303 | 54 |
| 215 Second St | 0.40mi | 1/1.5 (-1) | 1,226 (+4%) | 21mo | $400,000 | $326 | 51 |
| 121 Thurston Ave | 0.62mi | 3/2.0 (+1) | 1,248 (+6%) | 6mo | $370,000 | $296 | 48 |
| 311 Park Pl | 0.56mi | 3/2.0 (+1) | 1,248 (+6%) | 9mo | $380,000 | $304 | 48 |
| 402 Columbia St | 0.72mi | 3/1.0 (+1) | 1,176 (-1%) | 15mo | $220,000 | $187 | 48 |
| 107 E Falls St | 0.47mi | 3/2.0 (+1) | 1,086 (-8%) | 9mo | $365,000 | $336 | 48 |
| 206 Hancock St | 0.38mi | 2/1.5 | 1,044 (-12%) | 17mo | $127,680 | $122 | 47 |
| 103 Madison St | 0.33mi | 3/1.0 (+1) | 1,344 (+14%) | 14mo | $369,000 | $275 | 46 |
| 115 E York St | 0.51mi | 3/2.0 (+1) | 1,248 (+6%) | 18mo | $395,000 | $317 | 43 |
| 418 W Court St | 0.57mi | 3/2.0 (+1) | 1,313 (+11%) | 18mo | $345,000 | $263 | 31 |
Match score weights: distance 35% · size 25% · config 20% · recency 20%. Top-matched comps best support the ARV.
Projected returns pro-forma
-3.0% appreciation · 5.22% rent growth · sell at horizon
- IRR
- -15.5%
- Equity multiple
- 0.44×
- Total profit
- $-52,585
- Equity at exit
- $49,651
- IRR
- -3.5%
- Equity multiple
- 0.75×
- Total profit
- $-23,767
- Equity at exit
- $28,792
Cash invested: $93,240 (down + closing). Projections, not guarantees.
Landlord ↔ Tenant lean methodology
- Overall (STATE)
- 15 Strongly Tenant-Friendly
- State New York
- 15 Strongly Tenant-Friendly · D+10
- County
- — inherits STATE
- City
- — inherits STATE
ZIP-level market 14850
- Rents YoY
- 5.2%
- Active inventory
- 324
- Price-to-rent
- 9.5×
Monthly cashflow live
- Estimated rent
- $2,912 high interval (Pro) →
- Mortgage (P&I)
- −$1,746
- Tax from tax record
- −$500 /mo · $5,995/yr
- Insurance
- −$139
- HOA
- −$0
- Lot rent
- −$0
- Vacancy / Maint / Mgmt
- −$611
- Net cashflow
- $-84
Break-even live
Sensitivity live
| Price | -10% $104 | -5% $10 | +0% $-84 | +5% $-179 | +10% $-273 |
|---|---|---|---|---|---|
| Rent | -10% $-314 | -5% $-199 | +0% $-84 | +5% $31 | +10% $146 |
| Rate | -1.0pp $83 | -0.5pp $0 | base $-84 | +0.5pp $-171 | +1.0pp $-258 |
UW: 25.0% down · 7.5% · 30yr · 1.5% tax · 5.0% vac · 8.0% maint · 8.0% mgmt
Financing live
Cash to close
- Down payment
- $83,250
- Closing costs
- $9,990
- Reserves months
- —
- Total cash needed
- —
Loan-product check · same deal, 3 products live
Conventional
25% down · 7.5% · 30yr
- Down + closing
- —
- Monthly P&I
- —
- Monthly cashflow
- —
- DSCR
- —
- Eligible?
- —
Personal DTI + credit; lowest rate.
DSCR
20% down · 8.5% · 30yr
- Down + closing
- —
- Monthly P&I
- —
- Monthly cashflow
- —
- DSCR
- —
- Eligible?
- —
No personal income docs; deal must DSCR.
Hard money
10% down · 12.0% · 12mo
- Down + closing
- —
- Monthly P&I
- —
- Monthly cashflow
- —
- DSCR
- —
- Eligible?
- —
Short-term bridge; refi at stabilization.
Rent comps 8 comps
| Address | Beds | Baths | Sqft | Rent | $/sqft | DOM | Units | Dist |
|---|---|---|---|---|---|---|---|---|
| 430 W State St Ithaca, NY | 2.0 | 1.0–2.0 | 727 | $3,410 | $4.69 | 46d | 34 | 0.69mi |
| 127 College Ave Ithaca, NY | 3.0 | 1.0 | 958 | $2,885 | $3.01 | 46d | 1 | 0.71mi |
| 211 Linden Ave Ithaca, NY | 3.0 | 1.5 | 760 | $3,218 | $4.23 | 46d | 4 | 0.71mi |
| 320 Hillview Pl Ithaca, NY | 2.0–3.0 | 1.0 | 800 | $1,675 | $2.09 | 46d | 4 | 0.76mi |
| 323 Taughannock Blvd Ithaca, NY | 2.0 | 1.0–2.5 | 1167 | $6,402 | $5.48 | 46d | 6 | 0.92mi |
| 815 S Aurora St Ithaca, NY | 2.0–4.0 | 1.0 | 936 | $950 | $1.01 | 46d | 1 | 1.10mi |
| 139 Chestnut St Ithaca, NY | 1.0–3.0 | 1.0 | 850 | $1,745 | $2.05 | 46d | 1 | 1.20mi |
| 324 Spencer Rd Ithaca, NY | 2.0 | 1.0 | 850 | $2,545 | $2.99 | 46d | 8 | 1.25mi |
Listing history 25 events
-
2026-06-22pricedays on market $333,000 Active 41 DOM
-
2026-06-19days on market $345,000 Active 38 DOM
-
2026-06-18days on market $345,000 Active 37 DOM
-
2026-06-17days on market $345,000 Active 36 DOM
-
2026-06-16days on market $345,000 Active 35 DOM
-
2026-06-15days on market $345,000 Active 34 DOM
-
2026-06-14days on market $345,000 Active 32 DOM
-
2026-06-13days on market $345,000 Active 31 DOM
-
2026-06-10days on market $345,000 Active 29 DOM
-
2026-06-09days on market $345,000 Active 28 DOM
-
2026-06-08days on market $345,000 Active 27 DOM
-
2026-06-07days on market $345,000 Active 26 DOM
-
2026-06-05days on market $345,000 Active 23 DOM
-
2026-06-02days on market $345,000 Active 21 DOM
-
2026-06-01days on market $345,000 Active 20 DOM
-
2026-05-31days on market $345,000 Active 19 DOM
-
2026-05-30days on market $345,000 Active 18 DOM
-
2026-05-12$359,000 Active 1768-char remark
-
2022-08-11soldstatus $275,000
-
2016-04-14soldstatus $190,000 277-char remark
Show marketing remark (277 chars)
Sweet and charming in Fall Creek. Updated kitchen with cathedral ceilings. Hardwood floors throughout with gas fireplace in the living room. Updated tiled bath. Newer furnace with dry storage in basement. Den and built-in bed on main floor. Easy living in a great neighborhood!
-
2016-04-14soldstatus $190,000
Show marketing remark (277 chars)
Sweet and charming in Fall Creek. Updated kitchen with cathedral ceilings. Hardwood floors throughout with gas fireplace in the living room. Updated tiled bath. Newer furnace with dry storage in basement. Den and built-in bed on main floor. Easy living in a great neighborhood!
-
2016-02-03$190,000 277-char remark
Show marketing remark (277 chars)
Sweet and charming in Fall Creek. Updated kitchen with cathedral ceilings. Hardwood floors throughout with gas fireplace in the living room. Updated tiled bath. Newer furnace with dry storage in basement. Den and built-in bed on main floor. Easy living in a great neighborhood!
-
2010-08-06soldstatus $175,000
-
2003-08-04soldstatus $76,000
-
2000-09-18soldstatus $50,000
ⓘ Source: listings_history table (triggers on properties + properties_extension) + one-shot
backfill from property_details.listing_events for pre-trigger history.
Tax reassessment forecast NY · Partial reset (capped growth)
- Current annual tax
- $5,995 · $500/mo
- Projected year-2 tax
- $5,995 · $500/mo
- Expected delta
- $0/yr ($0/mo · 0.0%)
ⓘ Screening estimate from a state-policy table — verify with the county assessor before closing.
Climate risk First Street
- Flood 6/10 Major FEMA zone X (shaded) · 68% chance over 30 yrs
- Wildfire 1/10 Low
- Heat 3/10 Moderate 8 d/yr ≥94°F today · 17 d/yr by 30 yrs out
- Wind 2/10 Low 100% chance of damaging wind over 30 yrs
- Air quality 2/10 Low 0 unhealthy d/yr today · 1 by 30 yrs out
Nearby sold comps map
Loading sold comps map…
Walkable amenities ~0.75 mi
Loading nearby amenities…
Taxation est. · year 1
- Rental income
- $34,941
- − Mortgage interest
- −$18,653
- − Property taxes
- −$5,995
- − Insurance
- −$1,665
- − Repairs & maintenance
- −$2,795
- − Management
- −$2,795
- − Depreciation
- −$9,687
- Taxable loss
- −$6,649
- Est. tax savings @ 24.0%
- +$1,596
- After-tax cash flow
- $585/yr
For passive investors: Depreciation is non-cash, so a rental often shows a tax loss while cash-flowing — sheltering income. Rental losses are passive: they offset passive income freely, and up to $25,000/yr can offset ordinary (W-2) income if you actively participate and your MAGI is under $100k (phasing out to $0 by $150k); unused losses carry forward. On sale, claimed depreciation is recaptured at up to 25%, and gains may owe capital-gains tax (a 1031 exchange can defer both). Figures are a year-1 estimate at your 24.0% rate — not tax advice; consult a CPA.
Schools (NCES district)
- District
- Ithaca City School District
- NCES district ID
- 3615570
- Math proficiency
- 57% ▼ -5.00%
- Reading proficiency
- 71% ▲ 11.00%
- Median HH income
- $46,528
- Composite
- 54.01/100
- National rank
- #1397
- State rank
- #195 of 590 in NY
Livability — Ithaca
- Score
- 77/100
- State rank
- #210
- US rank
- #3240
Category grades
Schools grade is shown separately in the Schools card above.
Census & demographics
- Census place
- Ithaca, NY
- County
- Tompkins County · 68,610 people
- City population
- 68,610
- Metro
- Ithaca, NY
- Population (ZIP)
- 68,610
- Household income
- $71,445
- Rent vs Own
- Severe rent burden
- 5169.0
Population outlook (Tompkins County) Hauer SSP2
- Today (2025)
- 113,958 people
- By 2030
- 118,774 · +4.2%
- By 2040
- 125,927 · +10.5%
- By 2050
- 133,599 · +17.2%
- By 2075
- 156,759 · +37.6%
- By 2100
- 169,896 · +49.1%
Race, ethnicity, and origin ACS 2023
- Neighborhood character
- Predominantly White (68%)
- Race & ethnicity
- White 68% Asian 13% Hispanic / Latino 8% Two or more races 8% Black 4%
- Hispanic origin (detail)
- Mexican 2% Puerto Rican 2%
- Common ancestry
- Romanian 3% Italian 3% Scotch-Irish 2%
- Foreign-born
- 18% · China, Canada, South Korea
- Languages at home
- 79% English-only · Chinese 5% Spanish 4% Other Indo-European 4%
Political lean MEDSL · Tompkins
- 2024 margin
- Solid D (+50.6) · D 75.3% · R 24.7%
- 2008→2024 swing
- +8.6pp toward D · 2008: 42.1pp · 2024: 50.6pp
- All cycles
- 2024: D+50.6 2020: D+49.2 2016: D+42.1 2012: D+39.8 2008: D+42.1
Not yet ingested
- Civics
- —
Market trends
- HPI YoY
- ▼ -276.59%
- Current HPI
- 389.7215
- Rent YoY
- ▲ 5.22%
- Metro
- Ithaca, NY
- State GDP YoY
- ▲ 2.60%
- F500 in state
- 92
Industry mix (Fortune 500 HQ in NY)
| Industry | F500 HQs | Revenue |
|---|---|---|
| Financial Services | 10 | $950B |
|
||
| Consumer Goods | 9 | $162B |
|
||
| Insurance | 4 | $225B |
|
||
| Telecommunications | 2 | $144B |
|
||
| Pharmaceuticals | 2 | $112B |
|
||
| Media / Entertainment | 2 | $69B |
|
||
Price history
+590.0% since first listed9 events — show timeline
- 2026-05-28 Price Changed $345,000 IBRMLS
- 2026-05-12 Listed $359,000 IBRMLS
- 2022-08-11 Sold (Public Records) $275,000 Public Records
- 2016-04-14 Sold (Public Records) $190,000 Public Records
- 2016-04-14 Sold (MLS) $190,000 IBRMLS
- 2016-02-03 Listed $190,000 IBRMLS
- 2010-08-06 Sold (Public Records) $175,000 Public Records
- 2003-08-04 Sold (Public Records) $76,000 Public Records
- 2000-09-18 Sold (Public Records) $50,000 Public Records
Property tax history
-0.6%/yrLatest (2025): $5,995 · +2.3% YoY. Source: county tax records.
Cash-flow waterfall
monthlySold comps — $/sqft
last 12 mo · ≤1 miLoading sold comps…