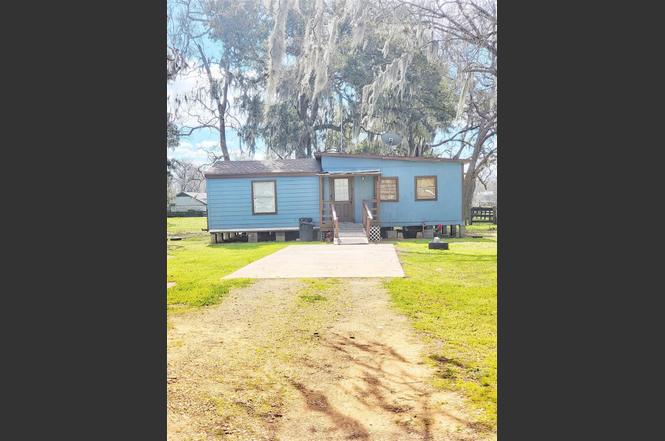
3588 County Road 344 · Wild Peach Village, TX
Flood risk 3/10 · Minor
- FEMA flood zone
- X (unshaded)
- Chance of flooding over 30 yrs
- 0.2%
- Est. flood insurance / yr
- $507 – $1,088
Fire risk 7/10 · Major
- Est. fire insurance / yr
- $1,222 – $2,270
Heat risk 10/10 · Severe
- Hot days now (above 110°F)
- 7 days/yr
- Hot days in 30 yrs
- 25 days/yr
Wind risk 9/10 · Severe
- Chance of severe wind over 30 yrs
- 99.0%
Air-quality risk 2/10 · Minimal
- Unhealthy air days now
- 2 days/yr
- Unhealthy air days in 30 yrs
- 2 days/yr
Risk factors via First Street. Map © Google.
Why this score? — see what drove the D+ grade
The composite is a weighted blend of 9 inputs, each scored 0–100. Each bar is that input's sub-score; the figure is the points it added to the 100-point composite (weight × sub-score).
- Cash flow +11.5/30.0
- Appreciation +10.0/10.0
- ARV discount +7.5/15.0
- DSCR +3.4/10.0
- Schools +3.0/10.0
- 1% rule +2.9/10.0
- Livability +2.9/5.0
- Rent growth +2.5/5.0
- Condition / age +2.5/5.0
$187,000
🖨 Deal sheet (PDF) 📄 Offer letter ✓ Due diligence
Listing remarks MLS
Calling all investors !!!! Almost 2 acres with two houses, Are you looking to extend your rental portfolio? Do you want to live in one home and rent out the other one? you can't miss this remarkable opportunity.
Key facts
- 1.77 acre lot
- Built 2011
- Listed 6 days
Property features AI
Finance
- Financial info: Lease not considered
Exterior
- Parking: Paved driveway
- Security: Fully fenced yard
- Utilities: Well water; Aerobic septic system
- Home design: Residential property; Single-story (all main rooms on first floor); Entry level on first floor
- Construction: Built in 2011; Cement and wood siding; Composition roof; Block foundation
- Exterior features: Covered patio; Patio and deck; Private yard; Fully fenced backyard; Back yard fencing; Paved driveway; Storage shed(s); Handicap accessible
Interior
- Kitchen: Electric cooktop; Electric oven; Electric range
- Bedrooms: Four bedrooms on the first floor (approx. 9x11, 10x15, 11x15, 11x15)
- Flooring: Laminate
- Bathrooms: One full bathroom; One half bathroom
- Heating & cooling: Window unit heating; Window unit cooling
- Interior features: Breakfast bar; Primary bathroom; Wheelchair access
- Laundry & utility: Washer hookup; Electric dryer hookup
Neighborhood map
What this means for you Summary
Snapshot
- This is a 3-bed/1.5-bath manufactured listed at $187k.
Deal economics
- At list price, monthly cash flow is $-61 ($-738/yr) — negative.
- To cash-flow at today's rent, offer at most $176k (5.8% below list).
- To meet the 1% rule (rent ≥ 1% of price), the offer needs to be $147k (21.2% below list).
- Recommended offer: $147k (21.2% below list) — sets the bar for 1% rule.
- Cap rate 5.9% vs local median 1.7% in Wild Peach Village — top-decile yield for the area; either an underpriced asset or a hidden risk that comps aren't pricing in. Stress-test before assuming the spread holds.
Location & tenants
- Location reads 58/100 on livability (#1,217 in TX) — a working-class tenant base; expect higher turnover. Strengths: crime A+, cost of living A+, housing A+; Watch: amenities F, commute F, employment D-.
- Columbia-Brazoria ISD (town): math 35% / reading 33% proficiency, ranked #513 of 826 in TX (top 62%) — families likely to look elsewhere, expect single-tenant / working-renter base with shorter leases.
- Zoned schools: West Columbia El (math 47% / reading 39%, grade F, #1,283 of 4,322 statewide, top 30%, 709 students, 60% FRL); West Brazos J H (math 34% / reading 32%, grade F, #930 of 1,662 statewide, top 57%, 676 students, 65% FRL); Columbia H S (math 13% / reading 28%, grade F, #1,389 of 1,632 statewide, top 86%, 889 students, 60% FRL).
- Market conditions: 212 active listings in the ZIP; 3,960 units permitted in Brazoria County in 2024 (593 in 5+ unit buildings).
Forward outlook
- In year one you build about $20k of equity ($1k loan paydown + $19k appreciation (10.0% local appreciation)).
- Brazoria County population projected at +44% by 2050 — long-run rental-demand tailwind backs the buy-and-hold thesis.
- At projected returns (10.0% appreciation + 3.0% rent growth), your $52k cash investment doubles in ~3 years — after that, you're playing with house money.
- By year 2, paydown + projected appreciation supports a ~$32k cash-out refi (75% LTV) — recoverable capital for the next deal without selling this one.
Negotiation context
- Only 6 days on market — expect competitive offers; lowballing is unlikely to land.
- 5 sale attempts since 3y ago with the ask held roughly flat each time — persistent listings suggest the price (not the market) is what's stuck; bring a comps-based counter.
Risks & watch-outs
- Climate carrying-cost: severe wind risk, 99% chance of damaging wind over 30y; major wildfire risk; extreme-heat days projected 7→25/yr by 2055 (HVAC capex compounding) — expect insurance premiums to compound above CPI over the hold.
Questions for the listing agent
- What do current leases actually rent for vs. the listed asking? Can we see a recent rent roll and the last 12 months of T-12 income?
- Is there a deadline driving the sale (1031 exchange, divorce, estate, relocation)? That informs how much negotiation room exists.
- Schools are F-rated, which usually means shorter tenancies and higher turnover. Who's the typical renter profile here, and what's been the actual vacancy rate?
- The area grade is low — what's the realistic commute time and amenity access for the typical tenant pool here? Any planned neighborhood developments (good or bad) we should know about?
- What's the average days-on-market for RENTAL listings here right now (not sales)? A rising rental-DOM trend means longer vacancies and softer asking-rent achievability than the comps imply.
- What's the recent tenant-quality profile in this submarket — average credit score on applications, eviction rate, late-payment / NSF rate, and stable-employment percentage? A property-management company in the area should have these aggregated.
- How much new for-sale + rental construction is in the pipeline within 1–3 miles? Heavy new supply typically softens prices + rents 12–24 months out; constrained supply supports both.
Investment metrics
- 1% rule
- 0.79% ✗
- Cap rate
- 5.90%
- Cash-on-cash
- -1.41%
- DSCR
- 0.94
- GRM
- 10.6
CMA / ARV
No comps found within radius.
Projected returns pro-forma
10.0% appreciation · 3.0% rent growth · sell at horizon
- IRR
- 23.3%
- Equity multiple
- 2.87×
- Total profit
- $97,911
- Equity at exit
- $168,464
- IRR
- 20.7%
- Equity multiple
- 6.56×
- Total profit
- $291,372
- Equity at exit
- $363,300
Cash invested: $52,360 (down + closing). Projections, not guarantees.
Landlord ↔ Tenant lean methodology
- Overall (STATE)
- 87 Strongly Landlord-Friendly
- State Texas
- 87 Strongly Landlord-Friendly · R+5
- County
- — inherits STATE
- City
- — inherits STATE
ZIP-level market 77422
- Home prices YoY
- 5.1%
- Active inventory
- 212
- Price-to-rent
- 10.6×
Monthly cashflow live
- Estimated rent
- $1,473 medium interval (Pro) →
- Mortgage (P&I)
- −$981
- Tax from tax record
- −$167 /mo · $2,000/yr
- Insurance
- −$78
- HOA
- −$0
- Vacancy / Maint / Mgmt
- −$309
- Net cashflow
- $-61
Break-even live
Sensitivity live
| Price | -10% $44 | -5% $-9 | +0% $-61 | +5% $-114 | +10% $-167 |
|---|---|---|---|---|---|
| Rent | -10% $-178 | -5% $-120 | +0% $-61 | +5% $-3 | +10% $55 |
| Rate | -1.0pp $33 | -0.5pp $-14 | base $-61 | +0.5pp $-110 | +1.0pp $-159 |
UW: 25.0% down · 7.5% · 30yr · 1.5% tax · 5.0% vac · 8.0% maint · 8.0% mgmt
Financing live
Cash to close
- Down payment
- $46,750
- Closing costs
- $5,610
- Reserves months
- —
- Total cash needed
- —
Loan-product check · same deal, 3 products live
Conventional
25% down · 7.5% · 30yr
- Down + closing
- —
- Monthly P&I
- —
- Monthly cashflow
- —
- DSCR
- —
- Eligible?
- —
Personal DTI + credit; lowest rate.
DSCR
20% down · 8.5% · 30yr
- Down + closing
- —
- Monthly P&I
- —
- Monthly cashflow
- —
- DSCR
- —
- Eligible?
- —
No personal income docs; deal must DSCR.
Hard money
10% down · 12.0% · 12mo
- Down + closing
- —
- Monthly P&I
- —
- Monthly cashflow
- —
- DSCR
- —
- Eligible?
- —
Short-term bridge; refi at stabilization.
Listing history 5 events
-
2026-06-21days on market $187,000 Active 6 DOM
-
2026-06-18days on market $187,000 Active 3 DOM
-
2026-06-17days on market $187,000 Active 2 DOM
-
2026-06-16remarks 214-char remark
-
2026-06-16$187,000 Active 1 DOM
ⓘ Source: listings_history table (triggers on properties + properties_extension) + one-shot
backfill from property_details.listing_events for pre-trigger history.
Tax reassessment forecast TX · Resets to sale price
- Current annual tax
- $2,000 · $167/mo
- Projected year-2 tax
- $3,422 · $285/mo
- Expected delta
- +$1,422/yr (+$118/mo · 71.1%)
ⓘ Screening estimate from a state-policy table — verify with the county assessor before closing.
Climate risk First Street
- Flood 3/10 Moderate FEMA zone X (unshaded) · 20% chance over 30 yrs
- Wildfire 7/10 Severe
- Heat 10/10 Extreme 7 d/yr ≥110°F today · 25 d/yr by 30 yrs out
- Wind 9/10 Extreme 99% chance of damaging wind over 30 yrs
- Air quality 2/10 Low 2 unhealthy d/yr today · 2 by 30 yrs out
Nearby sold comps map
Loading sold comps map…
Walkable amenities ~0.75 mi
Loading nearby amenities…
Taxation est. · year 1
- Rental income
- $17,677
- − Mortgage interest
- −$10,475
- − Property taxes
- −$2,000
- − Insurance
- −$935
- − Repairs & maintenance
- −$1,414
- − Management
- −$1,414
- − Depreciation
- −$5,440
- Taxable loss
- −$4,001
- Est. tax savings @ 24.0%
- +$960
- After-tax cash flow
- $223/yr
For passive investors: Depreciation is non-cash, so a rental often shows a tax loss while cash-flowing — sheltering income. Rental losses are passive: they offset passive income freely, and up to $25,000/yr can offset ordinary (W-2) income if you actively participate and your MAGI is under $100k (phasing out to $0 by $150k); unused losses carry forward. On sale, claimed depreciation is recaptured at up to 25%, and gains may owe capital-gains tax (a 1031 exchange can defer both). Figures are a year-1 estimate at your 24.0% rate — not tax advice; consult a CPA.
Schools (NCES district)
- District
- Columbia-Brazoria ISD
- NCES district ID
- 4814670
- Math proficiency
- 35% ▼ -4.00%
- Reading proficiency
- 33% ▼ -1.00%
- Median HH income
- $57,256
- Composite
- 30.23/100
- National rank
- #6297
- State rank
- #513 of 826 in TX
Livability — Wild Peach Village
- Score
- 58/100
- State rank
- #1217
- US rank
- #21264
Category grades
Schools grade is shown separately in the Schools card above.
Census & demographics
- Census place
- Wild Peach Village, TX
- Population (ZIP)
- 14,548
Population outlook (Brazoria County) Hauer SSP2
- Today (2025)
- 420,414 people
- By 2030
- 457,585 · +8.8%
- By 2040
- 532,232 · +26.6%
- By 2050
- 605,399 · +44.0%
- By 2075
- 779,358 · +85.4%
- By 2100
- 883,759 · +110.2%
Race, ethnicity, and origin ACS 2023
- Neighborhood character
- Majority White (64%)
- Race & ethnicity
- White 64% Hispanic / Latino 21% Two or more races 15% Black 10%
- Hispanic origin (detail)
- Mexican 18%
- Common ancestry
- Lithuanian 3% Slovak 2% Italian 2%
- Foreign-born
- 7% · Canada
- Languages at home
- 86% English-only · Spanish 13%
Political lean MEDSL · Brazoria
- 2024 margin
- R (+19.7) · D 39.5% · R 59.2% · Other 1.3%
- 2008→2024 swing
- +9.9pp toward D · 2008: -29.6pp · 2024: -19.7pp
- All cycles
- 2024: R+19.7 2020: R+18.2 2016: R+24.6 2012: R+34.2 2008: R+29.6
Not yet ingested
- Civics
- —
Market trends
- HPI YoY
- ▲ 14.41%
- Current HPI
- 296.0632
- Rent YoY
- —
- Metro
- —
- State GDP YoY
- ▲ 3.95%
- F500 in state
- 110
Industry mix (Fortune 500 HQ in TX)
| Industry | F500 HQs | Revenue |
|---|---|---|
| Energy | 16 | $1,198B |
|
||
| Technology | 5 | $198B |
|
||
| Engineering / Construction | 4 | $72B |
|
||
| Energy Services | 3 | $60B |
|
||
| Utilities | 3 | $41B |
|
||
| Healthcare | 2 | $330B |
|
||
Price history
+13.3% since first listed20 events — show timeline
- 2026-06-15 Listed $187,000 HARMLS
- 2024-10-28 Sold (Public Records) — Public Records
- 2024-10-25 Sold (MLS) — HARMLS
- 2024-10-24 Pending — HARMLS
- 2024-10-21 Pending — HARMLS
- 2024-09-13 Price Changed $165,000 HARMLS
- 2024-09-03 Relisted — HARMLS
- 2024-08-31 Listing Removed — HARMLS
- 2024-06-01 Relisted — HARMLS
- 2024-05-17 Pending — HARMLS
- 2024-03-20 Pending — HARMLS
- 2024-03-12 Pending — HARMLS
- 2024-02-22 Listed $185,000 HARMLS
- 2023-12-30 Listing Removed — HARMLS
- 2023-08-21 Listed $165,000 HARMLS
- 2015-04-08 Sold (Public Records) — Public Records
- 2015-04-01 Sold (Public Records) — Public Records
- 2009-06-04 Sold (Public Records) — Public Records
- 2009-05-26 Sold (Public Records) — Public Records
- 2004-10-27 Sold (Public Records) — Public Records
Property tax history
+10.7%/yrLatest (2025): $2,000 · -0.6% YoY. Source: county tax records.
Cash-flow waterfall
monthlySold comps — $/sqft
last 12 mo · ≤1 miLoading sold comps…