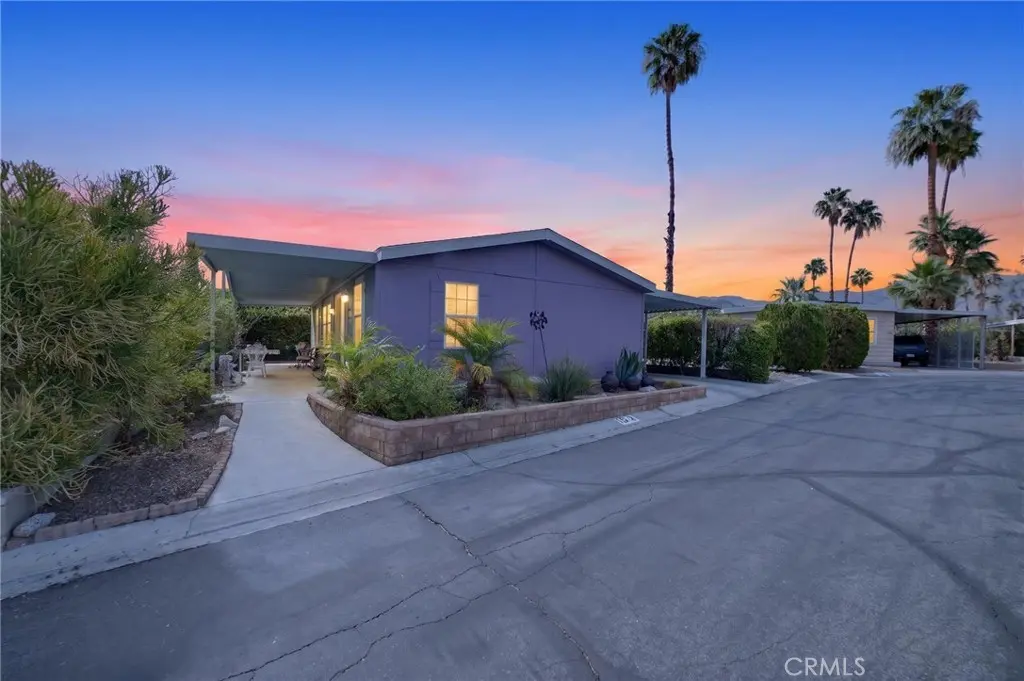
49305 Hwy 74 #153 · Palm Desert, CA
Flood risk 4/10 · Minor
- FEMA flood zone
- X
- Chance of flooding over 30 yrs
- 0.22%
- Est. flood insurance / yr
- $507 – $1,088
Fire risk 4/10 · Minor
- Est. fire insurance / yr
- $659 – $1,223
Heat risk 8/10 · Major
- Hot days now (above 107°F)
- 9 days/yr
- Hot days in 30 yrs
- 25 days/yr
Wind risk 1/10 · Minimal
- Chance of severe wind over 30 yrs
- —
Air-quality risk 4/10 · Minor
- Unhealthy air days now
- 5 days/yr
- Unhealthy air days in 30 yrs
- 6 days/yr
Risk factors via First Street. Map © Google.
Why this score? — see what drove the C+ grade
The composite is a weighted blend of 9 inputs, each scored 0–100. Each bar is that input's sub-score; the figure is the points it added to the 100-point composite (weight × sub-score).
- Cash flow +26.1/30.0
- DSCR +8.8/10.0
- ARV discount +7.5/15.0
- 1% rule +6.9/10.0
- Condition / age +4.0/5.0
- Schools +3.8/10.0
- Rent growth +2.9/5.0
- Livability +2.6/5.0
- Appreciation +0.0/10.0
$250,000
🖨 Deal sheet 📄 Offer letter ✓ Due diligence
Listing remarks
Welcome to one of the newer homes in the park , built in 2012, located in the desirable Indian Springs 55+ community just minutes from iconic El Paseo. This beautiful turnkey home features an open floor plan designed for comfortable living and effortless entertaining, along with stunning San Jacinto Mountains views from the private lanai. The thoughtfully designed layout offers two spacious bedrooms with en suite baths positioned on opposite sides of the home for added privacy. Built after 1972, the home may offer easier financing opportunities. Ideally situated across from the greenbelt, where the heated community pool, spa, and clubhouse are a short walk. Indian Springs is just a short
Key facts
- Clubhouse
- Spa
- Private lanai
Tags
Property features AI
Finance
- Other: Rent includes pool, water and sewer; Park name: Indian Springs Mobile Home Park
- Financial info: Land lease (current) paid monthly
- HOA & community: Senior community; Community features include pool, street lighting and suburban setting; Community pool (in-ground, filtered, heated)
Exterior
- Parking: Covered parking; Attached carport; Parking provided; Located on a private paved road within the park
- Security: Manager approval required for park residency
- Utilities: District/public water connected; Public sewer connected; Natural gas connected/available; Electricity connected/standard; Telephone service available/on property
- Home design: Mobile home (Golden Exclusive model) remains on site; Double body type; One total story; Faces west; Has a view
- Construction: Mobile home approximately 24 by 44 (model: Golden Exclusive)
- Exterior features: Cabana; Open patio (slab); Patio present; Shed; Landscaped yard with front yard and gentle slope; Sprinkler system with coverage front, side and rear
Interior
- Kitchen: 6-burner stove; Convection oven; Microwave; Dishwasher; Water line to refrigerator; Water purifier; Water heater unit (gas)
- Bedrooms: Primary bedroom; All bedrooms on main level; Main floor bedroom
- Flooring: Wood
- Bathrooms: Two full bathrooms; Bathtub; Shower in tub; Exhaust fan(s)
- Heating & cooling: Central heating (natural gas furnace); Central electric cooling
- Interior features: Chair railings; Laminate counters; High (9+ ft) ceilings; No interior steps; Two or more access exits; Turnkey condition; One-story, entry at street level; In-ground, heated community spa
- Laundry & utility: Washer and dryer included; Laundry inside; Gas and electric dryer hookups
Neighborhood map
What this means for you Summary
Snapshot
- This is a 2-bed/2.0-bath manufactured listed at $250k. Condition is rated good.
Deal economics
- At list price, monthly cash flow is $629 ($8k/yr) — positive.
- The deal already cash-flows at list — no discount required.
- Meets the 1% rule at list price ($3k rent vs $250k).
- Recommended offer: $246k (1.5% below list) — sets the bar for market timing.
- Cap rate 9.3% vs local median 3.5% in Palm Desert — top-decile yield for the area; either an underpriced asset or a hidden risk that comps aren't pricing in. Stress-test before assuming the spread holds.
Location & tenants
- Location reads 51/100 on livability (#1,050 in CA) — a working-class tenant base; expect higher turnover. Strengths: schools A-, employment B+, housing B; Watch: crime D, amenities F, commute F.
- Desert Sands Unified (suburban): math 31% / reading 56% proficiency, ranked #199 of 517 in CA (top 38%) — families likely to look elsewhere, expect single-tenant / working-renter base with shorter leases.
- Market conditions: Rents rising (+1.6%/yr); 545 active listings in the ZIP; 23 comparable units currently listed for rent nearby; rentals lingering (median 44d on market — plan ~5-8 weeks vacancy on turnover, expect pricing pressure); 61% of comp listings sitting > 30 days — soft ceiling on asking rent; 9,195 units permitted in Riverside County in 2024 (1,512 in 5+ unit buildings).
- At $2,984/mo this rent would consume 51% of the median local household income ($70k/yr) (locally 1734% of renters already pay >50% of income on rent) — very limited rent-growth headroom before tenants either downsize or default.
Forward outlook
- Local home prices are declining (-3.0%/yr); year-one equity from $2k of loan paydown is wiped out by about $8k of value loss. Plan a longer hold.
- Riverside County population projected at +22% by 2050 — long-run rental-demand tailwind backs the buy-and-hold thesis.
Negotiation context
- It's been on market 28 days — a 2% lower offer ($246k) is reasonable based on typical stale-listing flexibility.
- 5 sale attempts since 17y ago with the ask held roughly flat each time — persistent listings suggest the price (not the market) is what's stuck; bring a comps-based counter.
Risks & watch-outs
- Climate carrying-cost: extreme-heat days projected 9→25/yr by 2055 (HVAC capex compounding) — expect insurance premiums to compound above CPI over the hold.
Questions for the listing agent
- Is there a deadline driving the sale (1031 exchange, divorce, estate, relocation)? That informs how much negotiation room exists.
- Schools are A-rated — typically a magnet for longer-tenancy family renters. What's the average tenant stay here, and is there a school-zone premium baked into asking?
- Crime grade is D in this area — have there been break-ins, vandalism, or insurance claims at this property in the last 3 years? What carrier currently insures it and at what premium?
- What's the average days-on-market for RENTAL listings here right now (not sales)? A rising rental-DOM trend means longer vacancies and softer asking-rent achievability than the comps imply.
- What's the recent tenant-quality profile in this submarket — average credit score on applications, eviction rate, late-payment / NSF rate, and stable-employment percentage? A property-management company in the area should have these aggregated.
- How much new for-sale + rental construction is in the pipeline within 1–3 miles? Heavy new supply typically softens prices + rents 12–24 months out; constrained supply supports both.
Investment metrics
- 1% rule
- 1.19% ✓
- Cap rate
- 9.31%
- Cash-on-cash
- 10.79%
- DSCR
- 1.48
- GRM
- 7.0
CMA / ARV
- ARV (on-the-fly)
- $152,064
- Comps found
- 10
Show comp detail 10 sales within ~0.75 mi
| Address | Dist | Beds/Ba | Sqft | Sold | Price | $/sf | Match |
|---|---|---|---|---|---|---|---|
| 10 Box C Dr | 0.25mi | 2/2.0 | 1,080 (+2%) | 2mo | $105,000 | $97 | 84 |
| 25 Diamond E #25 | 0.16mi | 2/2.0 | 1,000 (-5%) | 2mo | $131,000 | $131 | 82 |
| 30 Lazy B Dr | 0.23mi | 2/2.0 | 980 (-7%) | 12mo | $73,000 | $74 | 67 |
| 4 Yucca Ln | 0.27mi | 2/2.0 | 1,040 (-2%) | 22mo | $149,800 | $144 | 66 |
| 100 Country Club Dr | 0.15mi | 2/2.0 | 1,152 (+9%) | 22mo | $190,000 | $165 | 60 |
| 14 Bar D Dr | 0.25mi | 3/2.0 (+1) | 1,140 (+8%) | 13mo | $215,000 | $189 | 59 |
| 49305 Highway 74 #132 | 0.20mi | 3/3.0 (+1) | 1,152 (+9%) | 11mo | $228,400 | $198 | 58 |
| 49305 Highway 74, #161 | 0.20mi | 2/2.0 | 1,152 (+9%) | 22mo | $128,750 | $112 | 57 |
| 49305 Highway 74 #115 | 0.24mi | 2/2.0 | 1,160 (+10%) | 23mo | $256,000 | $221 | 54 |
| 15 Ocotillo Ln | 0.26mi | 2/2.0 | 1,200 (+14%) | 19mo | $123,500 | $103 | 50 |
Match score weights: distance 35% · size 25% · config 20% · recency 20%. Top-matched comps best support the ARV.
Projected returns pro-forma
-3.0% appreciation · 1.6% rent growth · sell at horizon
- IRR
- -1.7%
- Equity multiple
- 0.94×
- Total profit
- $-4,522
- Equity at exit
- $37,276
- IRR
- 6.4%
- Equity multiple
- 1.45×
- Total profit
- $31,329
- Equity at exit
- $21,615
Cash invested: $70,000 (down + closing). Projections, not guarantees.
Landlord ↔ Tenant lean methodology
- Overall (STATE)
- 18 Strongly Tenant-Friendly
- State California
- 18 Strongly Tenant-Friendly · D+13
- County
- — inherits STATE
- City
- — inherits STATE
ZIP-level market 92260
- Rents YoY
- 1.6%
- Active inventory
- 545
- Price-to-rent
- 7.0×
Monthly cashflow live
- Estimated rent
- $2,984 high interval (Pro) →
- Mortgage (P&I)
- −$1,311
- Tax est. 1.5%
- −$312 /mo · $3,750/yr
- Insurance
- −$104
- HOA
- −$0
- Vacancy / Maint / Mgmt
- −$627
- Net cashflow
- $629
Break-even live
UW: 25.0% down · 7.5% · 30yr · 1.5% tax · 5.0% vac · 8.0% maint · 8.0% mgmt
Financing live
Cash to close
- Down payment
- $62,500
- Closing costs
- $7,500
- Reserves months
- —
- Total cash needed
- —
Loan-product check · same deal, 3 products live
Conventional
25% down · 7.5% · 30yr
- Down + closing
- —
- Monthly P&I
- —
- Monthly cashflow
- —
- DSCR
- —
- Eligible?
- —
Personal DTI + credit; lowest rate.
DSCR
20% down · 8.5% · 30yr
- Down + closing
- —
- Monthly P&I
- —
- Monthly cashflow
- —
- DSCR
- —
- Eligible?
- —
No personal income docs; deal must DSCR.
Hard money
10% down · 12.0% · 12mo
- Down + closing
- —
- Monthly P&I
- —
- Monthly cashflow
- —
- DSCR
- —
- Eligible?
- —
Short-term bridge; refi at stabilization.
Rent comps 23 comps
| Address | Beds | Baths | Sqft | Rent | $/sqft | DOM | Units | Dist |
|---|---|---|---|---|---|---|---|---|
| 73280 Avenida Descanso Palm Desert, CA | 3.0 | 2.0 | 1290 | $4,250 | $3.29 | 2d | 1 | 0.19mi |
| 48950 Desert Flower Dr Palm Desert, CA | 3.0 | 2.5 | 1348 | $5,000 | $3.71 | 1d | 1 | 0.43mi |
| 48828 Desert Flower Dr Palm Desert, CA | 2.0 | 1.0 | 1118 | $2,450 | $2.19 | 43d | 1 | 0.45mi |
| 48790 Desert Flower Dr Palm Desert, CA | 3.0 | 2.5 | 1348 | $2,500 | $1.85 | 1d | 1 | 0.49mi |
| 48790 Desert Flower Dr Palm Desert, CA | 3.0 | 2.5 | 1348 | $2,500 | $1.85 | 23d | 1 | 0.49mi |
| 48728 Desert Flower Dr Palm Desert, CA | 3.0 | 2.0 | 1348 | $2,400 | $1.78 | 24d | 1 | 0.50mi |
| 48980 Wildwood Ln Palm Desert, CA | 2.0 | 2.0 | 1184 | $2,795 | $2.36 | 43d | 1 | 0.56mi |
| 72346 Sommerset Dr Palm Desert, CA | 2.0 | 2.0 | 1440 | $3,950 | $2.74 | 43d | 1 | 0.56mi |
| 48624 Moon Terrace Ln Palm Desert, CA | 2.0 | 2.0 | 1184 | $2,600 | $2.20 | 14d | 1 | 0.63mi |
| 72619 Thrush Rd #2 Palm Desert, CA | 2.0 | 1.0 | 840 | $2,250 | $2.68 | 24d | 1 | 1.31mi |
| 73407 Foxtail Ln Palm Desert, CA | 2.0 | 2.0 | 1426 | $2,600 | $1.82 | 43d | 1 | 1.35mi |
| 72682 Thrush Rd Palm Desert, CA | 2.0 | 1.0 | 810 | $3,000 | $3.70 | 43d | 1 | 1.35mi |
| 72532 Edgehill Dr Palm Desert, CA | 2.0 | 1.0 | 840 | $2,000 | $2.38 | 43d | 1 | 1.37mi |
| 72632 Raven Rd #2 Palm Desert, CA | 2.0 | 1.0 | 840 | $1,850 | $2.20 | 43d | 1 | 1.40mi |
| 72546 Edgehill Dr #4 Palm Desert, CA | 2.0 | 1.0 | 924 | $2,330 | $2.52 | 24d | 1 | 1.40mi |
| 73441 Foxtail Ln Palm Desert, CA | 2.0 | 2.0 | 1426 | $3,495 | $2.45 | 43d | 1 | 1.40mi |
| 73446 Dalea Ln Palm Desert, CA | 2.0 | 2.0 | 1202 | $6,500 | $5.41 | 17d | 1 | 1.43mi |
| 72664 Eagle Rd #3 Palm Desert, CA | 2.0 | 1.0 | 840 | $2,200 | $2.62 | 43d | 1 | 1.45mi |
| 72694 Eagle Rd #1 Palm Desert, CA | 2.0 | 1.0 | 810 | $2,500 | $3.09 | 43d | 1 | 1.47mi |
| 46869 Highway 74 #1 Palm Desert, CA | 2.0 | 1.0 | 810 | $1,850 | $2.28 | 43d | 1 | 1.47mi |
| 73476 Dalea Ln Palm Desert, CA | 2.0 | 2.0 | 1271 | $5,000 | $3.93 | 43d | 1 | 1.48mi |
| 72724 Eagle Rd #1 Palm Desert, CA | 2.0 | 1.0 | 820 | $3,500 | $4.27 | 43d | 1 | 1.49mi |
| 72629 Edgehill Dr #4 Palm Desert, CA | 2.0 | 1.0 | 924 | $2,500 | $2.71 | 43d | 1 | 1.50mi |
Listing history 24 events
-
2026-06-18days on market $250,000 Active 28 DOM
-
2026-06-17days on market $250,000 Active 27 DOM
-
2026-06-16days on market $250,000 Active 26 DOM
-
2026-06-15days on market $250,000 Active 25 DOM
-
2026-06-13days on market $250,000 Active 23 DOM
-
2026-06-09days on market $250,000 Active 19 DOM
-
2026-06-08days on market $250,000 Active 18 DOM
-
2026-06-07days on market $250,000 Active 17 DOM
-
2026-06-04days on market $250,000 Active 14 DOM
-
2026-06-03days on market $250,000 Active 13 DOM
-
2026-06-02days on market $250,000 Active 12 DOM
-
2026-06-01days on market $250,000 Active 11 DOM
-
2026-05-31days on market $250,000 Active 10 DOM
-
2026-05-21$250,000 Active
-
2022-12-31historical
-
2022-07-05price $219,999
-
2022-06-13$249,000 Active
-
2022-06-11historical
-
2018-10-29historical
-
2018-06-30$129,900 Active
-
2010-05-09historical
-
2010-03-29$58,000 Active
-
2010-03-02historical
-
2009-09-09$58,000 Active
ⓘ Source: listings_history table (triggers on properties + properties_extension) + one-shot
backfill from property_details.listing_events for pre-trigger history.
Climate risk First Street
- Flood 4/10 Moderate FEMA zone X · 22% chance over 30 yrs
- Wildfire 4/10 Moderate
- Heat 8/10 Severe 9 d/yr ≥107°F today · 25 d/yr by 30 yrs out
- Wind 1/10 Low
- Air quality 4/10 Moderate 5 unhealthy d/yr today · 6 by 30 yrs out
Nearby sold comps map
Loading sold comps map…
Walkable amenities ~0.75 mi
Loading nearby amenities…
Taxation est. · year 1
- Rental income
- $35,805
- − Mortgage interest
- −$14,004
- − Property taxes
- −$3,750
- − Insurance
- −$1,250
- − Repairs & maintenance
- −$2,864
- − Management
- −$2,864
- − Depreciation
- −$7,273
- Taxable income
- $3,799
- Est. tax owed @ 24.0%
- −$912
- After-tax cash flow
- $6,641/yr
For passive investors: Depreciation is non-cash, so a rental often shows a tax loss while cash-flowing — sheltering income. Rental losses are passive: they offset passive income freely, and up to $25,000/yr can offset ordinary (W-2) income if you actively participate and your MAGI is under $100k (phasing out to $0 by $150k); unused losses carry forward. On sale, claimed depreciation is recaptured at up to 25%, and gains may owe capital-gains tax (a 1031 exchange can defer both). Figures are a year-1 estimate at your 24.0% rate — not tax advice; consult a CPA.
Condition & rehab AI · 12 photos
This turnkey home in Indian Springs offers a good condition with a good condition score of 80. It requires minor repairs to the kitchen cabinets and bathroom fixtures, and a fresh coat of paint to enhance its curb appeal and interior aesthetics.
Repairs flagged
- Minor Kitchen cabinets — Worn appearance
- Minor Bathroom fixtures — Need updating
Value-add opportunities
- Both Paint interior walls — Fresh paint enhances curb appeal and interior aesthetics
- Both Update kitchen cabinets — Fresh cabinets improve functionality and aesthetics
- Both Update bathroom fixtures — Modern fixtures enhance functionality and aesthetics
Renovation cost estimate screening
| Repair item | Severity | Est. cost |
|---|---|---|
| Kitchen cabinets · Worn appearance | Minor | $500–3,000 |
| Bathroom fixtures · Need updating | Minor | $500–3,000 |
| Total estimated repair cost · 2 items | $1,000–6,000 |
Value-add ROI direction
- Both Paint interior walls — Fresh paint enhances curb appeal and interior aesthetics ↑
- Both Update kitchen cabinets — Fresh cabinets improve functionality and aesthetics ↑
- Both Update bathroom fixtures — Modern fixtures enhance functionality and aesthetics ↑
ⓘ Cost ranges are severity-bucket heuristics (US national rule-of-thumb). Get contractor quotes + a written scope before underwriting a rehab budget.
Schools (NCES district)
- District
- Desert Sands Unified
- NCES district ID
- 0611110
- Math proficiency
- 31% ▼ -4.00%
- Reading proficiency
- 56% ▲ 7.00%
- Median HH income
- $54,957
- Composite
- 37.77/100
- National rank
- #4346
- State rank
- #199 of 517 in CA
Livability — Palm Desert
- Score
- 51/100
- State rank
- #1050
- US rank
- #25164
Category grades
Schools grade is shown separately in the Schools card above.
Census & demographics
- Census place
- Palm Desert, CA
- County
- Riverside County · 2,287,001 people
- City population
- 58,615
- Metro
- Riverside-San Bernardino-Ontario, CA
- Population (ZIP)
- 30,523
- Household income
- $70,091
- Rent vs Own
- Severe rent burden
- 1734.0
Population outlook (Riverside County) Hauer SSP2
- Today (2025)
- 2,664,475 people
- By 2030
- 2,802,692 · +5.2%
- By 2040
- 3,050,904 · +14.5%
- By 2050
- 3,256,783 · +22.2%
- By 2075
- 3,655,058 · +37.2%
- By 2100
- 3,766,594 · +41.4%
Race, ethnicity, and origin ACS 2023
- Neighborhood character
- Majority White (61%)
- Race & ethnicity
- White 61% Hispanic / Latino 31% Two or more races 20% Asian 4% Black 2%
- Hispanic origin (detail)
- Mexican 25%
- Common ancestry
- Italian 4% Lithuanian 3% Slovak 2%
- Foreign-born
- 18% · Canada, South Korea, Vietnam
- Languages at home
- 73% English-only · Spanish 22% French/Haitian/Cajun 1% Other Indo-European 1%
Political lean MEDSL · Riverside
- 2024 margin
- Toss-up / Even · D 48.0% · R 49.3% · Other 2.6%
- 2008→2024 swing
- -3.6pp toward R · 2008: 2.3pp · 2024: -1.3pp
- All cycles
- 2024: R+1.3 2020: D+8.0 2016: D+4.3 2012: R+0.4 2008: D+2.3
Not yet ingested
- Civics
- —
Market trends
- HPI YoY
- ▼ -364.94%
- Current HPI
- 294.9425
- Rent YoY
- ▲ 1.60%
- Metro
- Riverside-San Bernardino-Ontario, CA
- State GDP YoY
- ▲ 3.21%
- F500 in state
- 116
Industry mix (Fortune 500 HQ in CA)
| Industry | F500 HQs | Revenue |
|---|---|---|
| Technology | 27 | $1,492B |
|
||
| Financial Services | 3 | $174B |
|
||
| Retail | 3 | $44B |
|
||
| Insurance | 3 | $26B |
|
||
| Media / Entertainment | 2 | $115B |
|
||
| Pharmaceuticals / Biotech | 2 | $62B |
|
||
Price history
+331.0% since first listed11 events — show timeline
- 2026-05-21 Listed $250,000 CRMLS
- 2022-12-31 Listing Removed — GPSMLS
- 2022-07-05 Price Changed $219,999 GPSMLS
- 2022-06-13 Listed $249,000 GPSMLS
- 2022-06-11 Coming Soon — GPSMLS
- 2018-10-29 Listing Removed — GPSMLS
- 2018-06-30 Listed $129,900 GPSMLS
- 2010-05-09 Listing Removed — GPSMLS
- 2010-03-29 Listed $58,000 GPSMLS
- 2010-03-02 Listing Removed — GPSMLS
- 2009-09-09 Listed $58,000 GPSMLS
Cash-flow waterfall
monthlySold comps — $/sqft
last 12 mo · ≤1 miLoading sold comps…