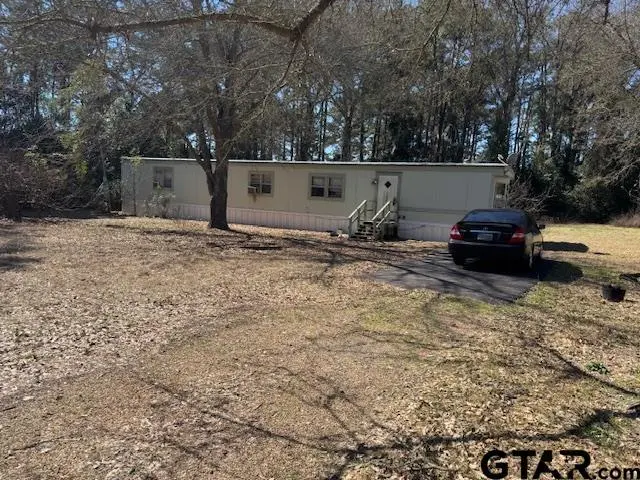
2804 Oak Trail Shores Dr · Sunrise Shores, TX
Flood risk 1/10 · Minimal
- FEMA flood zone
- X (unshaded)
- Chance of flooding over 30 yrs
- 0.0%
- Est. flood insurance / yr
- $507 – $1,088
Fire risk 2/10 · Minimal
- Est. fire insurance / yr
- $1,222 – $2,270
Heat risk 7/10 · Major
- Hot days now (above 109°F)
- 7 days/yr
- Hot days in 30 yrs
- 26 days/yr
Wind risk 6/10 · Moderate
- Chance of severe wind over 30 yrs
- 66.0%
Air-quality risk 1/10 · Minimal
- Unhealthy air days now
- 0 days/yr
- Unhealthy air days in 30 yrs
- 0 days/yr
Risk factors via First Street. Map © Google.
Why this score? — see what drove the B- grade
The composite is a weighted blend of 9 inputs, each scored 0–100. Each bar is that input's sub-score; the figure is the points it added to the 100-point composite (weight × sub-score).
- Cash flow +30.0/30.0
- 1% rule +10.0/10.0
- DSCR +10.0/10.0
- ARV discount +7.5/15.0
- Schools +3.7/10.0
- Rent growth +2.5/5.0
- Livability +2.5/5.0
- Condition / age +2.5/5.0
- Appreciation +0.0/10.0
$44,500
🖨 Deal sheet 📄 Offer letter ✓ Due diligence
Listing remarks MLS
Beautiful lot on Lake Palestine within walking distance to lake and boat ramp. Older mobile home needs work and is being sold in as is condition. Previous water damage to subflooring, subfloor needs replacement or haul away the mobile home and replace with your new home! Call to view property today!
Key facts
- Boat ramp
- Built 2005
- Listed 84 days
Tags
Neighborhood map
What this means for you Summary
Snapshot
- This is a 2-bed/1.5-bath manufactured listed at $44k.
Deal economics
- At list price, monthly cash flow is $720 ($9k/yr) — positive.
- The deal already cash-flows at list — no discount required.
- Meets the 1% rule at list price ($1k rent vs $44k).
- Recommended offer: $42k (6.0% below list) — sets the bar for market timing.
- Cap rate 25.7% vs local median 4.1% in Sunrise Shores — top-decile yield for the area; either an underpriced asset or a hidden risk that comps aren't pricing in. Stress-test before assuming the spread holds.
Location & tenants
- Location reads: area grade B — affects rentability + tenant quality, not the cash-flow math above.
- Brownsboro ISD (rural): math 42% / reading 46% proficiency, ranked #290 of 826 in TX (top 35%) — families likely to look elsewhere, expect single-tenant / working-renter base with shorter leases.
- Market conditions: 225 active listings in the ZIP; 263 units permitted in Henderson County in 2024 (0 in 5+ unit buildings).
Forward outlook
- Local home prices are declining (-3.0%/yr); year-one equity from $308 of loan paydown is wiped out by about $1k of value loss. Plan a longer hold.
- At projected returns (-3.0% appreciation + 3.0% rent growth), your $12k cash investment doubles in ~2 years — after that, you're playing with house money.
Negotiation context
- It's been on market 84 days — a 6% lower offer ($42k) is reasonable based on typical stale-listing flexibility.
Risks & watch-outs
- Climate carrying-cost: major wind risk, 66% chance of damaging wind over 30y; extreme-heat days projected 7→26/yr by 2055 (HVAC capex compounding) — expect insurance premiums to compound above CPI over the hold.
Questions for the listing agent
- It's been on market 84 days. Have you received any prior offers? Is the seller open to a 6% concession, seller financing, or rate buy-down credit?
- What does the HOA fee cover, when was the last increase, and are there any pending special assessments or reserve-fund shortfalls?
- Why hasn't it sold? Are there any deal-killer items the seller is aware of (foundation, flood, title, zoning, code violations)?
- Is there a deadline driving the sale (1031 exchange, divorce, estate, relocation)? That informs how much negotiation room exists.
- What's the average days-on-market for RENTAL listings here right now (not sales)? A rising rental-DOM trend means longer vacancies and softer asking-rent achievability than the comps imply.
- What's the recent tenant-quality profile in this submarket — average credit score on applications, eviction rate, late-payment / NSF rate, and stable-employment percentage? A property-management company in the area should have these aggregated.
- How much new for-sale + rental construction is in the pipeline within 1–3 miles? Heavy new supply typically softens prices + rents 12–24 months out; constrained supply supports both.
Investment metrics
- 1% rule
- 2.82% ✓
- Cap rate
- 25.72%
- Cash-on-cash
- 69.39%
- DSCR
- 4.09
- GRM
- 3.0
CMA / ARV
- ARV (median comp)
- $121,793
- List price
- $44,500
- Delta
- -63.46%
- Verdict
- UNDERPRICED
- Comps
- 2 within 1.0 mi
Projected returns pro-forma
-3.0% appreciation · 3.0% rent growth · sell at horizon
- IRR
- 68.9%
- Equity multiple
- 4.10×
- Total profit
- $38,673
- Equity at exit
- $6,635
- IRR
- 73.0%
- Equity multiple
- 8.44×
- Total profit
- $92,752
- Equity at exit
- $3,848
Cash invested: $12,460 (down + closing). Projections, not guarantees.
Landlord ↔ Tenant lean methodology
- Overall (STATE)
- 87 Strongly Landlord-Friendly
- State Texas
- 87 Strongly Landlord-Friendly · R+5
- County
- — inherits STATE
- City
- — inherits STATE
ZIP-level market 75758
- Home prices YoY
- -27.6%
- Active inventory
- 225
- Price-to-rent
- 3.0×
Monthly cashflow live
- Estimated rent
- $1,257 medium interval (Pro) →
- Mortgage (P&I)
- −$233
- Tax from tax record
- −$11 /mo · $126/yr
- Insurance
- −$19
- HOA
- −$10
- Vacancy / Maint / Mgmt
- −$264
- Net cashflow
- $720
Break-even live
UW: 25.0% down · 7.5% · 30yr · 1.5% tax · 5.0% vac · 8.0% maint · 8.0% mgmt
Financing live
Cash to close
- Down payment
- $11,125
- Closing costs
- $1,335
- Reserves months
- —
- Total cash needed
- —
Loan-product check · same deal, 3 products live
Conventional
25% down · 7.5% · 30yr
- Down + closing
- —
- Monthly P&I
- —
- Monthly cashflow
- —
- DSCR
- —
- Eligible?
- —
Personal DTI + credit; lowest rate.
DSCR
20% down · 8.5% · 30yr
- Down + closing
- —
- Monthly P&I
- —
- Monthly cashflow
- —
- DSCR
- —
- Eligible?
- —
No personal income docs; deal must DSCR.
Hard money
10% down · 12.0% · 12mo
- Down + closing
- —
- Monthly P&I
- —
- Monthly cashflow
- —
- DSCR
- —
- Eligible?
- —
Short-term bridge; refi at stabilization.
HOA detail
- Monthly dues
- $10 · $120/yr
- Likely covers
- water
Listing history 5 events
-
2026-05-12status Pending 300-char remark
Show marketing remark (300 chars)
Beautiful lot on Lake Palestine within walking distance to lake and boat ramp. Older mobile home needs work and is being sold in as is condition. Previous water damage to subflooring, subfloor needs replacement or haul away the mobile home and replace with your new home! Call to view property today!
-
2026-04-08price $44,500 300-char remark
Show marketing remark (300 chars)
Beautiful lot on Lake Palestine within walking distance to lake and boat ramp. Older mobile home needs work and is being sold in as is condition. Previous water damage to subflooring, subfloor needs replacement or haul away the mobile home and replace with your new home! Call to view property today!
-
2026-02-17$49,500 Active 300-char remark
Show marketing remark (300 chars)
Beautiful lot on Lake Palestine within walking distance to lake and boat ramp. Older mobile home needs work and is being sold in as is condition. Previous water damage to subflooring, subfloor needs replacement or haul away the mobile home and replace with your new home! Call to view property today!
-
2002-01-14soldstatus
-
2001-12-04soldstatus
ⓘ Source: listings_history table (triggers on properties + properties_extension) + one-shot
backfill from property_details.listing_events for pre-trigger history.
Tax reassessment forecast TX · Resets to sale price
- Current annual tax
- $126 · $11/mo
- Projected year-2 tax
- $814 · $68/mo
- Expected delta
- +$688/yr (+$57/mo · 544.8%)
ⓘ Screening estimate from a state-policy table — verify with the county assessor before closing.
Climate risk First Street
- Flood 1/10 Low FEMA zone X (unshaded) · 0% chance over 30 yrs
- Wildfire 2/10 Low
- Heat 7/10 Severe 7 d/yr ≥109°F today · 26 d/yr by 30 yrs out
- Wind 6/10 Major 66% chance of damaging wind over 30 yrs
- Air quality 1/10 Low 0 unhealthy d/yr today · 0 by 30 yrs out
Nearby sold comps map
Loading sold comps map…
Walkable amenities ~0.75 mi
Loading nearby amenities…
Taxation est. · year 1
- Rental income
- $15,082
- − Mortgage interest
- −$2,493
- − Property taxes
- −$126
- − Insurance
- −$222
- − Repairs & maintenance
- −$1,207
- − Management
- −$1,207
- − HOA
- −$120
- − Depreciation
- −$1,295
- Taxable income
- $8,413
- Est. tax owed @ 24.0%
- −$2,019
- After-tax cash flow
- $6,627/yr
For passive investors: Depreciation is non-cash, so a rental often shows a tax loss while cash-flowing — sheltering income. Rental losses are passive: they offset passive income freely, and up to $25,000/yr can offset ordinary (W-2) income if you actively participate and your MAGI is under $100k (phasing out to $0 by $150k); unused losses carry forward. On sale, claimed depreciation is recaptured at up to 25%, and gains may owe capital-gains tax (a 1031 exchange can defer both). Figures are a year-1 estimate at your 24.0% rate — not tax advice; consult a CPA.
Schools (NCES district)
- District
- Brownsboro ISD
- NCES district ID
- 4811640
- Math proficiency
- 42% ▼ -5.00%
- Reading proficiency
- 46% ▬ 0.00%
- Median HH income
- $45,624
- Composite
- 37.38/100
- National rank
- #4429
- State rank
- #290 of 826 in TX
Livability — Sunrise Shores
No livability data for this city. (Only ~50 U.S. cities are tracked.)
Census & demographics
- Population (ZIP)
- 10,357
Population outlook (Henderson County) Hauer SSP2
- Today (2025)
- 80,471 people
- By 2030
- 80,608 · +0.2%
- By 2040
- 80,087 · -0.5%
- By 2050
- 78,208 · -2.8%
- By 2075
- 72,423 · -10.0%
- By 2100
- 61,012 · -24.2%
Race, ethnicity, and origin ACS 2023
- Neighborhood character
- Predominantly White (79%)
- Race & ethnicity
- White 79% Hispanic / Latino 16% Two or more races 9% Black 2%
- Hispanic origin (detail)
- Mexican 14%
- Common ancestry
- Slovak 3% Serbian 2% Romanian 1%
- Foreign-born
- 5% · Canada, Vietnam
- Languages at home
- 91% English-only · Spanish 8% Other Indo-European 1%
Political lean MEDSL · Henderson
- 2024 margin
- Solid R (+63.5) · D 18.0% · R 81.4%
- 2008→2024 swing
- -18.8pp toward R · 2008: -44.6pp · 2024: -63.5pp
- All cycles
- 2024: R+63.5 2020: R+60.2 2016: R+60.0 2012: R+54.8 2008: R+44.6
Not yet ingested
- Civics
- —
Market trends
- HPI YoY
- ▼ -73.16%
- Current HPI
- 192.0837
- Rent YoY
- —
- Metro
- —
- State GDP YoY
- ▲ 3.95%
- F500 in state
- 110
Industry mix (Fortune 500 HQ in TX)
| Industry | F500 HQs | Revenue |
|---|---|---|
| Energy | 16 | $1,198B |
|
||
| Technology | 5 | $198B |
|
||
| Engineering / Construction | 4 | $72B |
|
||
| Energy Services | 3 | $60B |
|
||
| Utilities | 3 | $41B |
|
||
| Healthcare | 2 | $330B |
|
||
Price history
-10.1% since first listed5 events — show timeline
- 2026-05-12 Pending — GTAR
- 2026-04-08 Price Changed $44,500 GTAR
- 2026-02-17 Listed $49,500 GTAR
- 2002-01-14 Sold (Public Records) — Public Records
- 2001-12-04 Sold (Public Records) — Public Records
Property tax history
-1.9%/yrLatest (2025): $126 · -1.7% YoY. Source: county tax records.
Cash-flow waterfall
monthlySold comps — $/sqft
last 12 mo · ≤1 miLoading sold comps…