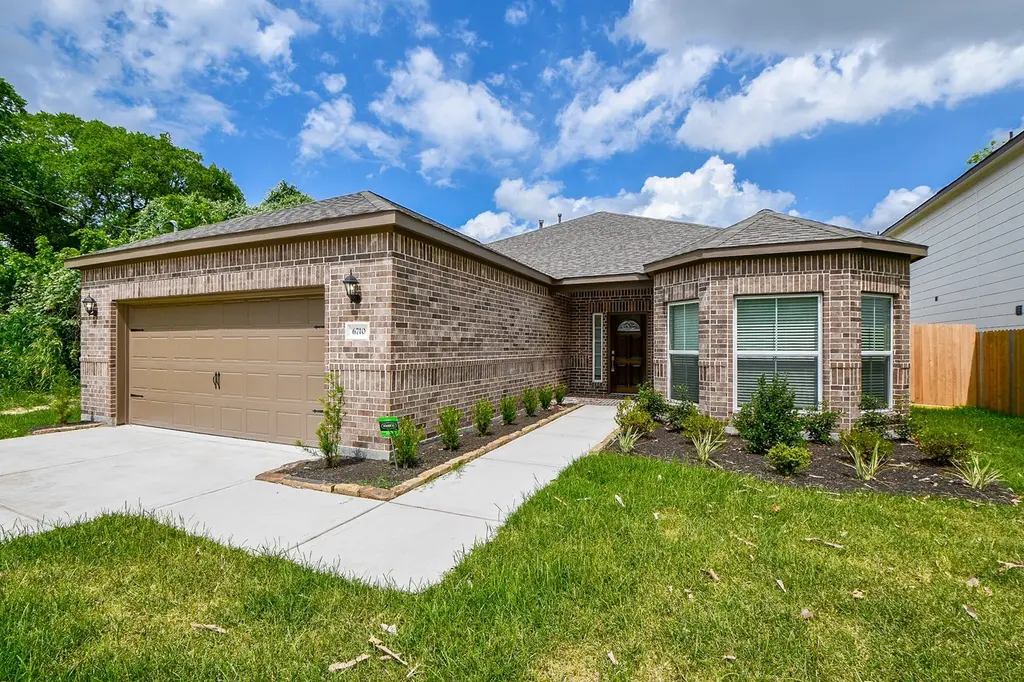
6710 Utah St · Houston, TX
Flood risk 1/10 · Minimal
- FEMA flood zone
- X (unshaded)
- Chance of flooding over 30 yrs
- 0.0%
- Est. flood insurance / yr
- $507 – $1,088
Fire risk 1/10 · Minimal
- Est. fire insurance / yr
- $1,222 – $2,270
Heat risk 9/10 · Severe
- Hot days now (above 109°F)
- 7 days/yr
- Hot days in 30 yrs
- 22 days/yr
Wind risk 9/10 · Severe
- Chance of severe wind over 30 yrs
- 99.0%
Air-quality risk 3/10 · Minor
- Unhealthy air days now
- 3 days/yr
- Unhealthy air days in 30 yrs
- 4 days/yr
Risk factors via First Street. Map © Google.
Why this score? — see what drove the D+ grade
The composite is a weighted blend of 9 inputs, each scored 0–100. Each bar is that input's sub-score; the figure is the points it added to the 100-point composite (weight × sub-score).
- Cash flow +14.4/30.0
- ARV discount +14.1/15.0
- DSCR +4.4/10.0
- 1% rule +4.0/10.0
- Livability +3.7/5.0
- Rent growth +3.0/5.0
- Schools +2.7/10.0
- Condition / age +2.5/5.0
- Appreciation +0.0/10.0
$228,000
🖨 Deal sheet (PDF) 📄 Offer letter ✓ Due diligence
Listing remarks MLS
BACK ON THE MARKET - BUYER DID NOT QUALIFY FOR FUNDING. Discover your new home at 6710 Utah St, where comfort meets affordability in a vibrant Houston neighborhood. This charming property is perfect for buyers who are eager to make a move and meet the income qualifications set by the City of Houston. • Affordable Living • Spacious Design • Modern Amenities • Prime Location • Income Approval Support
Key facts
- 5,998 sq ft lot
- 2 garage spots
- Built 2025
Neighborhood map
What this means for you Summary
Snapshot
- This is a 3-bed/2.5-bath single-family listed at $228k.
Deal economics
- At list price, monthly cash flow is $44 ($534/yr) — positive.
- The deal already cash-flows at list — no discount required.
- To meet the 1% rule (rent ≥ 1% of price), the offer needs to be $205k (10.1% below list).
- Recommended offer: $201k (12.0% below list) — sets the bar for market timing.
- Cap rate 6.5% vs local median 3.2% in Houston — top-decile yield for the area; either an underpriced asset or a hidden risk that comps aren't pricing in. Stress-test before assuming the spread holds.
Location & tenants
- Location reads 74/100 on livability (#184 in TX, #4,771 nationally) — a middle-class / working-renter tenant base. Strengths: amenities A+, cost of living A+, housing A+; Watch: crime F.
- Houston ISD (urban): math 27% / reading 35% proficiency, ranked #593 of 826 in TX (top 72%) — families likely to look elsewhere, expect single-tenant / working-renter base with shorter leases; 71% free/reduced lunch — lower-income household profile, screen leases tightly.
- Zoned schools: Wesley El (math 22% / reading 22%, grade F, #3,333 of 4,322 statewide, top 80%, 270 students, 98% FRL); Williams Middle (math 9% / reading 15%, grade F, #1,623 of 1,662 statewide, top 98%, 411 students, 98% FRL); Washington B T H S (math 27% / reading 25%, grade F, #1,234 of 1,632 statewide, top 76%, 878 students, 96% FRL) — zoned schools average 97% FRL vs 71% district-wide (26 pts higher); higher-poverty schools than district average — tighter screening recommended.
- Market conditions: Rents rising (+2.1%/yr); 680 active listings in the ZIP; 40 comparable units currently listed for rent nearby; rentals lingering (median 45d on market — plan ~5-8 weeks vacancy on turnover, expect pricing pressure); 50% of comp listings sitting > 30 days — soft ceiling on asking rent; lower-income renter base — watch delinquency; 29,883 units permitted in Harris County in 2024 (8,621 in 5+ unit buildings).
- At $2,051/mo this rent would consume 69% of the median local household income ($35k/yr) (locally 3210% of renters already pay >50% of income on rent) — very limited rent-growth headroom before tenants either downsize or default.
Forward outlook
- Local home prices are declining (-3.0%/yr); year-one equity from $2k of loan paydown is wiped out by about $7k of value loss. Plan a longer hold.
- Harris County population projected at +47% by 2050 — long-run rental-demand tailwind backs the buy-and-hold thesis.
Negotiation context
- It's been on market 360 days — a 12% lower offer ($201k) is reasonable based on typical stale-listing flexibility.
- 2 sale attempts with the ask held roughly flat each time — persistent listings suggest the price (not the market) is what's stuck; bring a comps-based counter.
Risks & watch-outs
- Climate carrying-cost: severe wind risk, 99% chance of damaging wind over 30y; extreme-heat days projected 7→22/yr by 2055 (HVAC capex compounding) — expect insurance premiums to compound above CPI over the hold.
Questions for the listing agent
- It's been on market 360 days. Have you received any prior offers? Is the seller open to a 12% concession, seller financing, or rate buy-down credit?
- Why hasn't it sold? Are there any deal-killer items the seller is aware of (foundation, flood, title, zoning, code violations)?
- Is there a deadline driving the sale (1031 exchange, divorce, estate, relocation)? That informs how much negotiation room exists.
- Schools are D-rated, which usually means shorter tenancies and higher turnover. Who's the typical renter profile here, and what's been the actual vacancy rate?
- Crime grade is F in this area — have there been break-ins, vandalism, or insurance claims at this property in the last 3 years? What carrier currently insures it and at what premium?
- The area grade is low — what's the realistic commute time and amenity access for the typical tenant pool here? Any planned neighborhood developments (good or bad) we should know about?
- What's the average days-on-market for RENTAL listings here right now (not sales)? A rising rental-DOM trend means longer vacancies and softer asking-rent achievability than the comps imply.
- What's the recent tenant-quality profile in this submarket — average credit score on applications, eviction rate, late-payment / NSF rate, and stable-employment percentage? A property-management company in the area should have these aggregated.
- How much new for-sale + rental construction is in the pipeline within 1–3 miles? Heavy new supply typically softens prices + rents 12–24 months out; constrained supply supports both.
Investment metrics
- 1% rule
- 0.90% ✗
- Cap rate
- 6.53%
- Cash-on-cash
- 0.84%
- DSCR
- 1.04
- GRM
- 9.3
CMA / ARV
- ARV (median comp)
- $267,000
- List price
- $228,000
- Delta
- -14.61%
- Verdict
- UNDERPRICED
- Comps
- 20 within 1.0 mi
Show comp detail 12 sales within ~0.75 mi
| Address | Dist | Beds/Ba | Sqft | Sold | Price | $/sf | Match |
|---|---|---|---|---|---|---|---|
| 1070 Wheatley Oak Ln | 0.43mi | 3/2.5 | 1,686 (-3%) | 2mo | $328,990 | $195 | 74 |
| 1061 Wheatley Oak Ln | 0.43mi | 3/2.5 | 1,686 (-3%) | 2mo | $317,990 | $189 | 73 |
| 6135 Pacific Forest Dr | 0.58mi | 3/2.5 | 1,731 (-0%) | 2mo | $330,000 | $191 | 71 |
| 872 Granville Dr | 0.27mi | 3/2.0 | 1,889 (+9%) | 1mo | $177,000 | $94 | 70 |
| 6639 Katarani Dr | 0.47mi | 3/3.5 | 1,804 (+4%) | 1mo | $334,990 | $186 | 66 |
| 5929 Wheatley St | 0.64mi | 3/2.5 | 1,776 (+2%) | 1mo | $354,900 | $200 | 66 |
| 1218 Highland Row Ln | 0.69mi | 3/2.5 | 1,706 (-2%) | 1mo | $372,090 | $218 | 64 |
| 1102 Mansfield St Unit C | 0.69mi | 3/3.5 | 1,741 (+0%) | 0mo | $334,900 | $192 | 63 |
| 1202 Highland Row Ln | 0.66mi | 3/2.5 | 1,808 (+4%) | 1mo | $389,990 | $216 | 62 |
| 1062 Wheatley Oak Ln | 0.43mi | 3/2.5 | 1,494 (-14%) | 2mo | $322,990 | $216 | 55 |
| 1059 Wheatley Oak Ln | 0.43mi | 3/2.5 | 1,494 (-14%) | 2mo | $289,990 | $194 | 55 |
| 961 Mansfield St | 0.65mi | 3/2.5 | 1,586 (-9%) | 2mo | $314,990 | $199 | 54 |
Match score weights: distance 35% · size 25% · config 20% · recency 20%. Top-matched comps best support the ARV.
Projected returns pro-forma
-3.0% appreciation · 2.1% rent growth · sell at horizon
- IRR
- -16.0%
- Equity multiple
- 0.44×
- Total profit
- $-35,922
- Equity at exit
- $33,996
- IRR
- -9.2%
- Equity multiple
- 0.45×
- Total profit
- $-34,924
- Equity at exit
- $19,713
Cash invested: $63,840 (down + closing). Projections, not guarantees.
Landlord ↔ Tenant lean methodology
- Overall (STATE)
- 87 Strongly Landlord-Friendly
- State Texas
- 87 Strongly Landlord-Friendly · R+5
- County
- — inherits STATE
- City
- — inherits STATE
ZIP-level market 77091
- Home prices YoY
- -24.9%
- Rents YoY
- 2.1%
- Active inventory
- 680
- Price-to-rent
- 9.3×
Monthly cashflow live
- Estimated rent
- $2,051 high interval (Pro) →
- Mortgage (P&I)
- −$1,196
- Tax est. 1.5%
- −$285 /mo · $3,420/yr
- Insurance
- −$95
- HOA
- −$0
- Vacancy / Maint / Mgmt
- −$431
- Net cashflow
- $44
Break-even live
Sensitivity live
| Price | -10% $202 | -5% $123 | +0% $44 | +5% $-34 | +10% $-113 |
|---|---|---|---|---|---|
| Rent | -10% $-118 | -5% $-37 | +0% $44 | +5% $125 | +10% $206 |
| Rate | -1.0pp $159 | -0.5pp $102 | base $44 | +0.5pp $-15 | +1.0pp $-75 |
UW: 25.0% down · 7.5% · 30yr · 1.5% tax · 5.0% vac · 8.0% maint · 8.0% mgmt
Financing live
Cash to close
- Down payment
- $57,000
- Closing costs
- $6,840
- Reserves months
- —
- Total cash needed
- —
Loan-product check · same deal, 3 products live
Conventional
25% down · 7.5% · 30yr
- Down + closing
- —
- Monthly P&I
- —
- Monthly cashflow
- —
- DSCR
- —
- Eligible?
- —
Personal DTI + credit; lowest rate.
DSCR
20% down · 8.5% · 30yr
- Down + closing
- —
- Monthly P&I
- —
- Monthly cashflow
- —
- DSCR
- —
- Eligible?
- —
No personal income docs; deal must DSCR.
Hard money
10% down · 12.0% · 12mo
- Down + closing
- —
- Monthly P&I
- —
- Monthly cashflow
- —
- DSCR
- —
- Eligible?
- —
Short-term bridge; refi at stabilization.
Rent comps 40 comps
| Address | Beds | Baths | Sqft | Rent | $/sqft | DOM | Units | Dist |
|---|---|---|---|---|---|---|---|---|
| 6513 Knox St Houston, TX | 4.0 | 3.0 | 1773 | $2,100 | $1.18 | 45d | 1 | 0.19mi |
| 1032 Glen Ln Houston, TX | 3.0 | 3.0 | 1667 | $2,400 | $1.44 | 45d | 1 | 0.45mi |
| 774 Dillard St Houston, TX | 4.0 | 2.5 | 1899 | $2,405 | $1.27 | 22d | 1 | 0.48mi |
| 6127 W Montgomery Rd Houston, TX | 3.0 | 3.0 | 1786 | $2,000 | $1.12 | 26d | 1 | 0.68mi |
| 6555 Sealey St Houston, TX | 3.0 | 2.5 | 1800 | $2,700 | $1.50 | 26d | 1 | 0.77mi |
| 833 Paul Quinn St Unit A Houston, TX | 3.0 | 2.5 | 1226 | $1,800 | $1.47 | 45d | 1 | 0.83mi |
| 831 Paul Quinn St Unit B Houston, TX | 3.0 | 2.5 | 1226 | $1,800 | $1.47 | 26d | 1 | 0.83mi |
| 774 Paul Quinn St Houston, TX | 3.0 | 3.0 | 1651 | $2,350 | $1.42 | 45d | 1 | 0.84mi |
| 5722 # E Unit Beall St unit Houston, TX | 3.0 | 2.5 | 1474 | $2,011 | $1.36 | 45d | 1 | 0.86mi |
| 5720 Beall St Unit C Houston, TX | 3.0 | 2.5 | 1474 | $2,006 | $1.36 | 45d | 1 | 0.87mi |
| 7514 Sandle St Houston, TX | 3.0 | 2.5 | 1523 | $1,999 | $1.31 | 45d | 1 | 0.89mi |
| 7486 N Shepherd Dr Houston, TX | 3.0 | 2.0 | 1177 | $1,290 | $1.10 | 45d | 1 | 0.90mi |
| 855 S Victory Dr Unit C Houston, TX | 3.0 | 2.5 | 1546 | $2,300 | $1.49 | 45d | 1 | 0.92mi |
| 783 Fortune St Unit A Houston, TX | 3.0 | 2.5 | 1328 | $1,795 | $1.35 | 18d | 1 | 0.96mi |
| 1200 W Tidwell Rd Houston, TX | 2.0–3.0 | 1.0–2.0 | 938 | $1,295 | $1.38 | 1d | 11 | 1.01mi |
| 8108 De Priest St Unit B Houston, TX | 3.0 | 2.5 | 1500 | $1,900 | $1.27 | 45d | 1 | 1.03mi |
| 8110 De Priest St Unit A Houston, TX | 3.0 | 2.5 | 1500 | $1,900 | $1.27 | 45d | 1 | 1.04mi |
| 8112 De Priest St Unit B Houston, TX | 3.0 | 2.5 | 1500 | $1,750 | $1.17 | 1d | 1 | 1.04mi |
| 929 Marjorie St Unit 1060806P Houston, TX | 3.0 | 2.0 | 1076 | $3,091 | $2.87 | 9d | 1 | 1.06mi |
| 8120 De Priest St Unit A Houston, TX | 3.0 | 2.5 | 1500 | $1,750 | $1.17 | 45d | 1 | 1.07mi |
| 8120 De Priest St Unit B Houston, TX | 3.0 | 2.5 | 1500 | $1,900 | $1.27 | 45d | 1 | 1.07mi |
| 8118 De Priest St Unit B Houston, TX | 3.0 | 2.5 | 1500 | $1,900 | $1.27 | 45d | 1 | 1.07mi |
| 8122 De Priest St Unit A Houston, TX | 3.0 | 3.5 | 1500 | $1,900 | $1.27 | 45d | 1 | 1.08mi |
| 5508 Oakmont Villas Dr Houston, TX | 3.0 | 2.0 | 2199 | $2,599 | $1.18 | 45d | 1 | 1.09mi |
| 8304 De Priest St Unit B Houston, TX | 3.0 | 2.5 | 1600 | $1,900 | $1.19 | 23d | 1 | 1.10mi |
| 8306 De Priest St Unit A Houston, TX | 3.0 | 2.5 | 1500 | $1,900 | $1.27 | 22d | 1 | 1.10mi |
| 8310 De Priest St Unit B Houston, TX | 3.0 | 2.5 | 1500 | $1,900 | $1.27 | 22d | 1 | 1.11mi |
| 8312 De Priest St Unit B Houston, TX | 3.0 | 3.5 | 1500 | $1,900 | $1.27 | 22d | 1 | 1.12mi |
| 8312 De Priest St Unit A Houston, TX | 3.0 | 2.5 | 1500 | $1,900 | $1.27 | 22d | 1 | 1.12mi |
| 8404 De Priest St Unit A Houston, TX | 3.0 | 2.5 | 1600 | $1,900 | $1.19 | 45d | 1 | 1.15mi |
| 714 W Tidwell Rd Houston, TX | 2.0 | 1.0 | 1296 | $1,094 | $0.84 | 45d | 1 | 1.15mi |
| 8406 De Priest St Unit A Houston, TX | 3.0 | 2.5 | 1600 | $1,695 | $1.06 | 45d | 1 | 1.15mi |
| 7008 Emma Lou St Houston, TX | 3.0 | 2.5 | 1610 | $3,000 | $1.86 | 20d | 1 | 1.19mi |
| 301 W Little York Rd Unit 1722 Houston, TX | 2.0 | 2.0 | 1322 | $1,230 | $0.93 | 22d | 1 | 1.28mi |
| 1001 Pinemont Dr Unit 2112 Houston, TX | 2.0 | 2.0 | 1155 | $1,373 | $1.19 | 0d | 1 | 1.43mi |
| 1001 Pinemont Dr Unit 2165 Houston, TX | 2.0 | 2.0 | 1155 | $1,414 | $1.22 | 0d | 1 | 1.43mi |
| 1001 Pinemont Dr Unit 1058 Houston, TX | 2.0 | 2.0 | 1155 | $1,414 | $1.22 | 45d | 1 | 1.43mi |
| 1001 Pinemont Dr Unit 1038 Houston, TX | 2.0 | 2.0 | 1155 | $1,413 | $1.22 | 12d | 1 | 1.43mi |
| 1001 Pinemont Dr Unit 422 Houston, TX | 2.0 | 2.0 | 1155 | $1,389 | $1.20 | 9d | 1 | 1.43mi |
| 7504 Carver Rd Houston, TX | 3.0 | 2.5 | 1694 | $2,500 | $1.48 | 7d | 1 | 1.43mi |
Listing history 17 events
-
2026-06-21days on market $228,000 Active 360 DOM
-
2026-06-18days on market $228,000 Active 357 DOM
-
2026-06-17days on market $228,000 Active 356 DOM
-
2026-06-16days on market $228,000 Active 355 DOM
-
2026-06-15days on market $228,000 Active 354 DOM
-
2026-06-13days on market $228,000 Active 352 DOM
-
2026-06-10days on market $228,000 Active 348 DOM
-
2026-06-08days on market $228,000 Active 347 DOM
-
2026-06-07days on market $228,000 Active 346 DOM
-
2026-06-04days on market $228,000 Active 343 DOM
-
2026-06-01days on market $228,000 Active 340 DOM
-
2026-05-31days on market $228,000 Active 339 DOM
-
2026-05-11status Active 435-char remark
Show marketing remark (435 chars)
BACK ON THE MARKET - BUYER DID NOT QUALIFY FOR FUNDING. Discover your new home at 6710 Utah St, where comfort meets affordability in a vibrant Houston neighborhood. This charming property is perfect for buyers who are eager to make a move and meet the income qualifications set by the City of Houston. • Affordable Living • Spacious Design • Modern Amenities • Prime Location • Income Approval Support
-
2026-04-12status Pending 435-char remark
Show marketing remark (435 chars)
BACK ON THE MARKET - BUYER DID NOT QUALIFY FOR FUNDING. Discover your new home at 6710 Utah St, where comfort meets affordability in a vibrant Houston neighborhood. This charming property is perfect for buyers who are eager to make a move and meet the income qualifications set by the City of Houston. • Affordable Living • Spacious Design • Modern Amenities • Prime Location • Income Approval Support
-
2026-03-25status Pending 435-char remark
Show marketing remark (435 chars)
BACK ON THE MARKET - BUYER DID NOT QUALIFY FOR FUNDING. Discover your new home at 6710 Utah St, where comfort meets affordability in a vibrant Houston neighborhood. This charming property is perfect for buyers who are eager to make a move and meet the income qualifications set by the City of Houston. • Affordable Living • Spacious Design • Modern Amenities • Prime Location • Income Approval Support
-
2025-05-27$228,000 Active 435-char remark
Show marketing remark (435 chars)
BACK ON THE MARKET - BUYER DID NOT QUALIFY FOR FUNDING. Discover your new home at 6710 Utah St, where comfort meets affordability in a vibrant Houston neighborhood. This charming property is perfect for buyers who are eager to make a move and meet the income qualifications set by the City of Houston. • Affordable Living • Spacious Design • Modern Amenities • Prime Location • Income Approval Support
-
1988-01-02soldstatus
ⓘ Source: listings_history table (triggers on properties + properties_extension) + one-shot
backfill from property_details.listing_events for pre-trigger history.
Climate risk First Street
- Flood 1/10 Low FEMA zone X (unshaded) · 0% chance over 30 yrs
- Wildfire 1/10 Low
- Heat 9/10 Extreme 7 d/yr ≥109°F today · 22 d/yr by 30 yrs out
- Wind 9/10 Extreme 99% chance of damaging wind over 30 yrs
- Air quality 3/10 Moderate 3 unhealthy d/yr today · 4 by 30 yrs out
Nearby sold comps map
Loading sold comps map…
Walkable amenities ~0.75 mi
Loading nearby amenities…
Taxation est. · year 1
- Rental income
- $24,610
- − Mortgage interest
- −$12,772
- − Property taxes
- −$3,420
- − Insurance
- −$1,140
- − Repairs & maintenance
- −$1,969
- − Management
- −$1,969
- − Depreciation
- −$6,633
- Taxable loss
- −$3,292
- Est. tax savings @ 24.0%
- +$790
- After-tax cash flow
- $1,324/yr
For passive investors: Depreciation is non-cash, so a rental often shows a tax loss while cash-flowing — sheltering income. Rental losses are passive: they offset passive income freely, and up to $25,000/yr can offset ordinary (W-2) income if you actively participate and your MAGI is under $100k (phasing out to $0 by $150k); unused losses carry forward. On sale, claimed depreciation is recaptured at up to 25%, and gains may owe capital-gains tax (a 1031 exchange can defer both). Figures are a year-1 estimate at your 24.0% rate — not tax advice; consult a CPA.
Schools (NCES district)
- District
- Houston ISD
- NCES district ID
- 4823640
- Math proficiency
- 27% ▼ -18.00%
- Reading proficiency
- 35% ▼ -6.00%
- Median HH income
- $46,054
- Composite
- 26.63/100
- National rank
- #7173
- State rank
- #593 of 826 in TX
Livability — Houston
- Score
- 74/100
- State rank
- #184
- US rank
- #4771
Category grades
Schools grade is shown separately in the Schools card above.
Census & demographics
- Census place
- Houston, TX
- County
- Harris County · 4,702,590 people
- City population
- 3,226,434
- Metro
- Houston-The Woodlands-Sugar Land, TX
- Population (ZIP)
- 28,728
- Household income
- $35,432
- Rent vs Own
- Severe rent burden
- 3210.0
Population outlook (Harris County) Hauer SSP2
- Today (2025)
- 5,571,493 people
- By 2030
- 6,089,821 · +9.3%
- By 2040
- 7,142,806 · +28.2%
- By 2050
- 8,185,864 · +46.9%
- By 2075
- 10,574,329 · +89.8%
- By 2100
- 12,109,958 · +117.4%
Race, ethnicity, and origin ACS 2023
- Neighborhood character
- Diverse neighborhood (Simpson 0.58)
- Race & ethnicity
- Hispanic / Latino 46% Black 45% Two or more races 15% White 7%
- Hispanic origin (detail)
- Mexican 29%
- Common ancestry
- Italian 1%
- Foreign-born
- 24% · Canada, Jamaica
- Languages at home
- 55% English-only · Spanish 41% French/Haitian/Cajun 2%
Political lean MEDSL · Harris
- 2024 margin
- Lean D (+5.5) · D 52.0% · R 46.4% · Other 1.6%
- 2008→2024 swing
- +3.9pp toward D · 2008: 1.6pp · 2024: 5.5pp
- All cycles
- 2024: D+5.5 2020: D+13.3 2016: D+12.4 2012: D+0.1 2008: D+1.6
Not yet ingested
- Civics
- —
Market trends
- HPI YoY
- ▼ -94.19%
- Current HPI
- 283.7523
- Rent YoY
- ▲ 2.10%
- Metro
- Houston-The Woodlands-Sugar Land, TX
- State GDP YoY
- ▲ 3.95%
- F500 in state
- 110
Industry mix (Fortune 500 HQ in TX)
| Industry | F500 HQs | Revenue |
|---|---|---|
| Energy | 16 | $1,198B |
|
||
| Technology | 5 | $198B |
|
||
| Engineering / Construction | 4 | $72B |
|
||
| Energy Services | 3 | $60B |
|
||
| Utilities | 3 | $41B |
|
||
| Healthcare | 2 | $330B |
|
||
Price history
5 events — show timeline
- 2026-05-11 Relisted — HARMLS
- 2026-04-12 Pending — HARMLS
- 2026-03-25 Pending — HARMLS
- 2025-05-27 Listed $228,000 HARMLS
- 1988-01-02 Sold (Public Records) — Public Records
Property tax history
+56.6%/yrLatest (2011): $228 · +56.6% YoY. Source: county tax records.
Cash-flow waterfall
monthlySold comps — $/sqft
last 12 mo · ≤1 miLoading sold comps…