433 S 7th St #1603 · Minneapolis, MN
Flood risk 1/10 · Minimal
- FEMA flood zone
- X (unshaded)
- Chance of flooding over 30 yrs
- 0.0%
- Est. flood insurance / yr
- $507 – $1,088
Fire risk 1/10 · Minimal
- Est. fire insurance / yr
- $888 – $1,650
Heat risk 2/10 · Minimal
- Hot days now (above 99°F)
- 7 days/yr
- Hot days in 30 yrs
- 14 days/yr
Wind risk 2/10 · Minimal
- Chance of severe wind over 30 yrs
- —
Air-quality risk 2/10 · Minimal
- Unhealthy air days now
- 1 days/yr
- Unhealthy air days in 30 yrs
- 1 days/yr
Risk factors via First Street. Map © Google.
Why this score? — see what drove the B- grade
The composite is a weighted blend of 9 inputs, each scored 0–100. Each bar is that input's sub-score; the figure is the points it added to the 100-point composite (weight × sub-score).
- Cash flow +19.9/30.0
- ARV discount +15.0/15.0
- 1% rule +10.0/10.0
- DSCR +6.3/10.0
- Livability +3.9/5.0
- Schools +3.5/10.0
- Rent growth +3.2/5.0
- Condition / age +2.5/5.0
- Appreciation +1.4/10.0
$96,000
🖨 Deal sheet 📄 Offer letter ✓ Due diligence
Listing remarks MLS
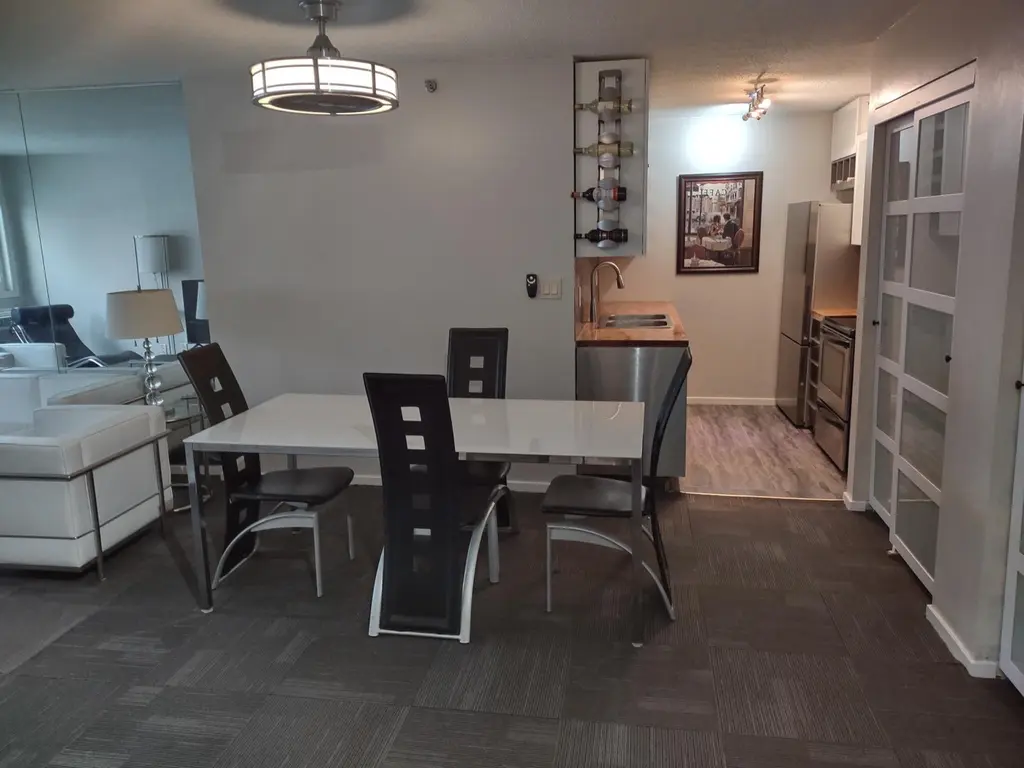
Updated 16th floor pool side condo with great views of the downtown skyline that is connected to the skyway system. The condo is freshly painted, has new windows and doors, along with an updated bath and a remodeled kitchen. The building has many amenities including an amazing rooftop pool, fitness area, sauna and spa. There are also two large decks, a business center, media/game room and event/party room. Must see!
Key facts
- Updated bath
- Rooftop pool
- Fitness area
Tags
Neighborhood map
What this means for you Summary
Snapshot
- This is a 1-bed/1.0-bath condo listed at $96k.
Deal economics
- At list price, monthly cash flow is $116 ($1k/yr) — positive.
- The deal already cash-flows at list — no discount required.
- Meets the 1% rule at list price ($2k rent vs $96k).
- Recommended offer: $90k (6.0% below list) — sets the bar for market timing.
- Cap rate 7.7% vs local median 3.1% in Minneapolis — top-decile yield for the area; either an underpriced asset or a hidden risk that comps aren't pricing in. Stress-test before assuming the spread holds.
Location & tenants
- Location reads 78/100 on livability (#110 in MN, #2,525 nationally) — a middle-class / working-renter tenant base. Strengths: amenities A+, commute A+, housing A+; Watch: cost of living C-, crime F.
- Minneapolis Public School District (urban): math 35% / reading 46% proficiency, ranked #217 of 301 in MN (top 72%) — families likely to look elsewhere, expect single-tenant / working-renter base with shorter leases.
- Market conditions: Rents rising (+2.6%/yr); 81 active listings in the ZIP; 40 comparable units currently listed for rent nearby; rentals leasing fast (median 3d on market — plan ~1-2 weeks tenant-placement turnaround); high-income renter base; 4,651 units permitted in Hennepin County in 2024 (2,443 in 5+ unit buildings).
- This rent is only 18% of the median local income ($125k/yr) — well below the 30% rent-burden line; pricing power to push rent on renewal without tenant pushback.
Forward outlook
- Local home prices are declining (-3.0%/yr); year-one equity from $664 of loan paydown is wiped out by about $3k of value loss. Plan a longer hold.
- Hennepin County population projected at +30% by 2050 — long-run rental-demand tailwind backs the buy-and-hold thesis.
Negotiation context
- It's been on market 68 days — a 6% lower offer ($90k) is reasonable based on typical stale-listing flexibility.
- 9 sale attempts since 33y ago; this cycle's ask has dropped $16k (15%) from the opening price — seller is motivated, your offer sets the floor, not the list.
- Current owner paid $36k; list at $96k implies a 167% gain — meaningful room to come down on a strong offer.
Risks & watch-outs
- Watch-outs: HOA is 35% of rent.
Questions for the listing agent
- It's been on market 68 days. Have you received any prior offers? Is the seller open to a 6% concession, seller financing, or rate buy-down credit?
- What does the HOA fee cover, when was the last increase, and are there any pending special assessments or reserve-fund shortfalls?
- Any open or pending special assessments — roof, HVAC, plumbing, elevator, façade? What's the per-unit balance and payoff schedule, and is the seller paying it off at close or rolling it to the buyer?
- Why hasn't it sold? Are there any deal-killer items the seller is aware of (foundation, flood, title, zoning, code violations)?
- Is there a deadline driving the sale (1031 exchange, divorce, estate, relocation)? That informs how much negotiation room exists.
- Crime grade is F in this area — have there been break-ins, vandalism, or insurance claims at this property in the last 3 years? What carrier currently insures it and at what premium?
- What's the average days-on-market for RENTAL listings here right now (not sales)? A rising rental-DOM trend means longer vacancies and softer asking-rent achievability than the comps imply.
- What's the recent tenant-quality profile in this submarket — average credit score on applications, eviction rate, late-payment / NSF rate, and stable-employment percentage? A property-management company in the area should have these aggregated.
- How much new apartment / multifamily construction is in the pipeline within 1–3 miles? Heavy new supply (>2% of stock underway) typically softens rents 12–24 months out; light construction supports rent growth.
Investment metrics
- 1% rule
- 1.92% ✓
- Cap rate
- 7.74%
- Cash-on-cash
- 5.18%
- DSCR
- 1.23
- GRM
- 4.3
CMA / ARV
- ARV (median comp)
- $155,532
- List price
- $96,000
- Delta
- -38.28%
- Verdict
- UNDERPRICED
- Comps
- 2 within 1.0 mi
Projected returns pro-forma
-3.0% appreciation · 2.65% rent growth · sell at horizon
- IRR
- -8.5%
- Equity multiple
- 0.69×
- Total profit
- $-8,371
- Equity at exit
- $14,314
- IRR
- 0.7%
- Equity multiple
- 1.05×
- Total profit
- $1,392
- Equity at exit
- $8,300
Cash invested: $26,880 (down + closing). Projections, not guarantees.
Landlord ↔ Tenant lean methodology
- Overall (CITY)
- 34 Tenant-Leaning
- State Minnesota
- 46 Balanced · D+2
- County
- — inherits STATE
- City Minneapolis
- 34 Tenant-Leaning · D+50
ZIP-level market 55415
- Home prices YoY
- -2.4%
- Rents YoY
- 2.6%
- Active inventory
- 81
- Price-to-rent
- 4.3×
Monthly cashflow live
- Estimated rent
- $1,844 high interval (Pro) →
- Mortgage (P&I)
- −$503
- Tax from tax record
- −$155 /mo · $1,859/yr
- Insurance
- −$40
- HOA
- −$642
- Vacancy / Maint / Mgmt
- −$387
- Net cashflow
- $116
Break-even live
UW: 25.0% down · 7.5% · 30yr · 1.5% tax · 5.0% vac · 8.0% maint · 8.0% mgmt
Financing live
Cash to close
- Down payment
- $24,000
- Closing costs
- $2,880
- Reserves months
- —
- Total cash needed
- —
Loan-product check · same deal, 3 products live
Conventional
25% down · 7.5% · 30yr
- Down + closing
- —
- Monthly P&I
- —
- Monthly cashflow
- —
- DSCR
- —
- Eligible?
- —
Personal DTI + credit; lowest rate.
DSCR
20% down · 8.5% · 30yr
- Down + closing
- —
- Monthly P&I
- —
- Monthly cashflow
- —
- DSCR
- —
- Eligible?
- —
No personal income docs; deal must DSCR.
Hard money
10% down · 12.0% · 12mo
- Down + closing
- —
- Monthly P&I
- —
- Monthly cashflow
- —
- DSCR
- —
- Eligible?
- —
Short-term bridge; refi at stabilization.
Rent comps 40 comps
| Address | Beds | Baths | Sqft | Rent | $/sqft | DOM | Units | Dist |
|---|---|---|---|---|---|---|---|---|
| 431 S 7th St #2610 Minneapolis, MN | 1.0 | 1.0 | 430 | $1,250 | $2.91 | 24d | 1 | 0.03mi |
| 431 S 7th St Minneapolis, MN | 1.0 | 1.0 | 430 | $1,250 | $2.91 | 44d | 2 | 0.03mi |
| 431 S 7th St Minneapolis, MN | 1.0 | 1.0 | 430 | $1,250 | $2.91 | 11d | 2 | 0.03mi |
| 650 Portland Ave Minneapolis, MN | 2.0 | 1.0–2.0 | 1104 | $2,825 | $2.56 | 3d | 18 | 0.07mi |
| 600 5th Ave S Minneapolis, MN | 1.0–2.0 | 1.0–2.0 | 915 | $1,440 | $1.57 | 2d | 9 | 0.08mi |
| 615 S 8th St Minneapolis, MN | 2.0 | 1.0–2.5 | 1248 | $3,672 | $2.94 | 2d | 52 | 0.13mi |
| 609 S 9th St #2 Minneapolis, MN | 1.0 | 1.0 | 600 | $1,095 | $1.82 | 44d | 1 | 0.20mi |
| 511 S 4th St Minneapolis, MN | 2.0 | 1.0–2.0 | 882 | $2,215 | $2.51 | 2d | 11 | 0.22mi |
| 910 Portland Ave Minneapolis, MN | 1.0 | 1.0 | 392 | $1,056 | $2.69 | 14d | 1 | 0.22mi |
| 608 2nd Ave S Minneapolis, MN | 2.0 | 1.0–2.0 | 999 | $1,823 | $1.82 | 2d | 34 | 0.23mi |
| 929 Portland Ave #1408 Minneapolis, MN | 1.0 | 1.0 | 680 | $1,485 | $2.18 | 44d | 1 | 0.24mi |
| 900 Centennial Pl Minneapolis, MN | — | 1.0 | 390 | $825 | $2.12 | 14d | 1 | 0.28mi |
| 101 S 5th St Minneapolis, MN | 3.0 | 1.0–2.0 | 1249 | $2,289 | $1.83 | 2d | 35 | 0.31mi |
| 515 E Grant St Minneapolis, MN | 1.0–2.0 | 1.0 | 820 | $1,220 | $1.49 | 2d | 10 | 0.31mi |
| 90 S 9th St Minneapolis, MN | 2.0 | 1.0 | 838 | $1,650 | $1.97 | 4d | 2 | 0.33mi |
| 1400 Park Ave Minneapolis, MN | 2.0 | 1.0–2.0 | 875 | $2,040 | $2.33 | 3d | 21 | 0.34mi |
| 1111 3rd Ave S Unit 1511914P Minneapolis, MN | 4.0 | 1.0–2.0 | 1081 | $5,100 | $4.72 | 3d | 2 | 0.36mi |
| 700 S 4th St Minneapolis, MN | 2.0 | 1.0–2.0 | 897 | $2,688 | $2.99 | 2d | 26 | 0.36mi |
| 465 Nicollet Mall Minneapolis, MN | 2.0 | 1.0–3.0 | 1153 | $3,030 | $2.63 | 2d | 14 | 0.37mi |
| 250 Portland Ave Minneapolis, MN | 1.0–2.0 | 1.0–2.0 | 902 | $1,950 | $2.16 | 3d | 11 | 0.38mi |
| 400 Marquette Ave Minneapolis, MN | 3.0 | 1.0–2.0 | 1103 | $2,905 | $2.63 | 2d | 14 | 0.38mi |
| 95 S 10th St Minneapolis, MN | 2.0 | 1.0–2.0 | 688 | $1,744 | $2.53 | 2d | 31 | 0.38mi |
| 501 E 14th St Minneapolis, MN | 1.0 | 1.0 | 510 | $1,055 | $2.07 | 44d | 1 | 0.39mi |
| 313 Washington Ave S Minneapolis, MN | 2.0 | 1.0–2.0 | 836 | $2,288 | $2.73 | 2d | 9 | 0.39mi |
| 365 Nicollet Mall Minneapolis, MN | 3.0 | 1.0–3.5 | 1656 | $4,363 | $2.63 | 3d | 33 | 0.40mi |
| 240 Park Ave Minneapolis, MN | 1.0–2.0 | 1.0–2.0 | 1047 | $2,075 | $1.98 | 3d | 2 | 0.41mi |
| 1117 Marquette Ave Minneapolis, MN | 1.0–2.0 | 1.0–2.0 | 953 | $1,373 | $1.44 | 2d | 15 | 0.44mi |
| 240 Chicago Ave Minneapolis, MN | 2.0 | 1.0–2.0 | 825 | $2,164 | $2.62 | 2d | 11 | 0.45mi |
| 225 Portland Ave Minneapolis, MN | 2.0 | 1.0–2.0 | 837 | $2,410 | $2.88 | 3d | 70 | 0.45mi |
| 1010 S 7th St Minneapolis, MN | 2.0 | 1.0–2.0 | 834 | $1,928 | $2.31 | 44d | 1 | 0.47mi |
| 728 E 16th St #34 Minneapolis, MN | 1.0 | 1.0 | 593 | $950 | $1.60 | 44d | 1 | 0.47mi |
| 736 E 16th St Minneapolis, MN | 1.0–2.0 | 1.0 | 650 | $917 | $1.41 | 24d | 2 | 0.48mi |
| 811 Washington Ave S Minneapolis, MN | 1.0–2.0 | 1.0–2.0 | 862 | $1,660 | $1.93 | 20d | 9 | 0.48mi |
| 205 Park Ave Minneapolis, MN | 1.0–2.0 | 1.0–2.0 | 859 | $1,809 | $2.11 | 8d | 5 | 0.49mi |
| 729 E 16th St Unit 4 Minneapolis, MN | 1.0 | 1.0 | 480 | $1,155 | $2.41 | 44d | 1 | 0.50mi |
| 270 Hennepin Ave Minneapolis, MN | 3.0 | 1.0–3.0 | 1505 | $4,088 | $2.72 | 2d | 54 | 0.56mi |
| 1423 11th Ave S Minneapolis, MN | 1.0–2.0 | 1.0 | 818 | $1,300 | $1.59 | 3d | 29 | 0.56mi |
| 115 2nd Ave S Minneapolis, MN | 1.0 | 1.0 | 508 | $1,371 | $2.70 | 2d | 15 | 0.57mi |
| 111 S Marquette Ave Minneapolis, MN | 1.0–2.0 | 1.0–2.0 | 970 | $1,516 | $1.56 | 3d | 12 | 0.60mi |
| 212 10th Ave S Minneapolis, MN | 3.0 | 1.0–2.5 | 1490 | $4,242 | $2.85 | 2d | 10 | 0.61mi |
HOA detail condo
- Monthly dues
- $642 · $7,704/yr
- Likely covers
- pool
- Assessments
- None detected in remarks — confirm with the listing agent.
Listing history 37 events
-
2026-06-18days on market $96,000 Active 68 DOM
-
2026-06-17days on market $96,000 Active 67 DOM
-
2026-06-16days on market $96,000 Active 66 DOM
-
2026-06-15days on market $96,000 Active 65 DOM
-
2026-06-13days on market $96,000 Active 63 DOM
-
2026-06-10price $96,000 Active 59 DOM
-
2026-06-09days on market $99,500 Active 59 DOM
-
2026-06-08days on market $99,500 Active 58 DOM
-
2026-06-07days on market $99,500 Active 57 DOM
-
2026-06-04days on market $99,500 Active 54 DOM
-
2026-06-03days on market $99,500 Active 53 DOM
-
2026-06-02days on market $99,500 Active 52 DOM
-
2026-06-01days on market $99,500 Active 51 DOM
-
2026-05-31days on market $99,500 Active 50 DOM
-
2026-05-02price $99,500 420-char remark
Show marketing remark (420 chars)
Updated 16th floor pool side condo with great views of the downtown skyline that is connected to the skyway system. The condo is freshly painted, has new windows and doors, along with an updated bath and a remodeled kitchen. The building has many amenities including an amazing rooftop pool, fitness area, sauna and spa. There are also two large decks, a business center, media/game room and event/party room. Must see!
-
2026-04-19price $102,500 420-char remark
Show marketing remark (420 chars)
Updated 16th floor pool side condo with great views of the downtown skyline that is connected to the skyway system. The condo is freshly painted, has new windows and doors, along with an updated bath and a remodeled kitchen. The building has many amenities including an amazing rooftop pool, fitness area, sauna and spa. There are also two large decks, a business center, media/game room and event/party room. Must see!
-
2026-04-11$112,500 Active 420-char remark
Show marketing remark (420 chars)
Updated 16th floor pool side condo with great views of the downtown skyline that is connected to the skyway system. The condo is freshly painted, has new windows and doors, along with an updated bath and a remodeled kitchen. The building has many amenities including an amazing rooftop pool, fitness area, sauna and spa. There are also two large decks, a business center, media/game room and event/party room. Must see!
-
2026-01-19historical
-
2026-01-03status Active
-
2025-11-19price $103,000
-
2025-10-10price $106,500
-
2025-09-10price $111,500
-
2025-08-20price $115,000
-
2025-08-11$119,000 Active
-
2025-07-25historical
-
2025-06-22status Active
-
2025-06-22price $109,000
-
2025-06-06$115,000 Active
-
1997-02-26historical
-
1997-02-10$54,900
-
1995-01-06soldstatus $36,001
-
1994-06-01historical
-
1994-01-04$54,900
-
1993-12-29historical
-
1993-11-05$54,900
-
1993-11-04historical
-
1993-09-09$54,900
ⓘ Source: listings_history table (triggers on properties + properties_extension) + one-shot
backfill from property_details.listing_events for pre-trigger history.
Tax reassessment forecast MN · Partial reset (capped growth)
- Current annual tax
- $1,859 · $155/mo
- Projected year-2 tax
- $1,859 · $155/mo
- Expected delta
- $0/yr ($0/mo · 0.0%)
ⓘ Screening estimate from a state-policy table — verify with the county assessor before closing.
Climate risk First Street
- Flood 1/10 Low FEMA zone X (unshaded) · 0% chance over 30 yrs
- Wildfire 1/10 Low
- Heat 2/10 Low 7 d/yr ≥99°F today · 14 d/yr by 30 yrs out
- Wind 2/10 Low
- Air quality 2/10 Low 1 unhealthy d/yr today · 1 by 30 yrs out
Nearby sold comps map
Loading sold comps map…
Walkable amenities ~0.75 mi
Loading nearby amenities…
Taxation est. · year 1
- Rental income
- $22,122
- − Mortgage interest
- −$5,377
- − Property taxes
- −$1,859
- − Insurance
- −$480
- − Repairs & maintenance
- −$1,770
- − Management
- −$1,770
- − HOA
- −$7,704
- − Depreciation
- −$2,793
- Taxable income
- $369
- Est. tax owed @ 24.0%
- −$89
- After-tax cash flow
- $1,303/yr
For passive investors: Depreciation is non-cash, so a rental often shows a tax loss while cash-flowing — sheltering income. Rental losses are passive: they offset passive income freely, and up to $25,000/yr can offset ordinary (W-2) income if you actively participate and your MAGI is under $100k (phasing out to $0 by $150k); unused losses carry forward. On sale, claimed depreciation is recaptured at up to 25%, and gains may owe capital-gains tax (a 1031 exchange can defer both). Figures are a year-1 estimate at your 24.0% rate — not tax advice; consult a CPA.
Schools (NCES district)
- District
- Minneapolis Public School District
- NCES district ID
- 2721240
- Math proficiency
- 35% ▼ -7.00%
- Reading proficiency
- 46% ▼ -1.00%
- Median HH income
- $50,521
- Composite
- 34.92/100
- National rank
- #5067
- State rank
- #217 of 301 in MN
Livability — Minneapolis
- Score
- 78/100
- State rank
- #110
- US rank
- #2525
Category grades
Schools grade is shown separately in the Schools card above.
Census & demographics
- Census place
- Minneapolis, MN
- County
- Hennepin County · 1,150,272 people
- City population
- 417,555
- Metro
- Minneapolis-St. Paul-Bloomington, MN-WI
- Population (ZIP)
- 6,900
- Household income
- $124,921
- Rent vs Own
- Severe rent burden
- 344.0
Population outlook (Hennepin County) Hauer SSP2
- Today (2025)
- 1,405,227 people
- By 2030
- 1,492,650 · +6.2%
- By 2040
- 1,660,157 · +18.1%
- By 2050
- 1,823,498 · +29.8%
- By 2075
- 2,221,283 · +58.1%
- By 2100
- 2,509,976 · +78.6%
Race, ethnicity, and origin ACS 2023
- Neighborhood character
- Diverse neighborhood (Simpson 0.59)
- Race & ethnicity
- White 61% Black 18% Asian 9% Two or more races 6% Hispanic / Latino 4% Native American 2%
- Common ancestry
- Portuguese 6% Slovak 2% Romanian 2%
- Foreign-born
- 16% · Canada, South Korea, China
- Languages at home
- 87% English-only · Other Indo-European 4% Spanish 2% Other Asian/Pacific 1%
Political lean MEDSL · Hennepin
- 2024 margin
- Solid D (+42.6) · D 70.2% · R 27.5% · Other 2.3%
- 2008→2024 swing
- +14.0pp toward D · 2008: 28.6pp · 2024: 42.6pp
- All cycles
- 2024: D+42.6 2020: D+43.2 2016: D+35.3 2012: D+27.1 2008: D+28.6
Not yet ingested
- Civics
- —
Market trends
- HPI YoY
- ▼ -7.23%
- Current HPI
- 289.6606
- Rent YoY
- ▲ 2.65%
- Metro
- Minneapolis-St. Paul-Bloomington, MN-WI
- State GDP YoY
- ▲ 2.41%
- F500 in state
- 34
Industry mix (Fortune 500 HQ in MN)
| Industry | F500 HQs | Revenue |
|---|---|---|
| Healthcare | 2 | $407B |
|
||
| Retail | 2 | $150B |
|
||
| Consumer Goods | 2 | $32B |
|
||
| Industrial Machinery | 2 | $6B |
|
||
| Agriculture | 1 | $40B |
|
||
| Healthcare / Medical Devices | 1 | $32B |
|
||
Price history
+81.2% since first listed23 events — show timeline
- 2026-05-02 Price Changed $99,500 NORTHSTARMLS as Distributed by MLS Grid
- 2026-04-19 Price Changed $102,500 NORTHSTARMLS as Distributed by MLS Grid
- 2026-04-11 Listed $112,500 NORTHSTARMLS as Distributed by MLS Grid
- 2026-01-19 Listing Removed — NORTHSTARMLS as Distributed by MLS Grid
- 2026-01-03 Relisted — NORTHSTARMLS as Distributed by MLS Grid
- 2025-11-19 Price Changed $103,000 NORTHSTARMLS as Distributed by MLS Grid
- 2025-10-10 Price Changed $106,500 NORTHSTARMLS as Distributed by MLS Grid
- 2025-09-10 Price Changed $111,500 NORTHSTARMLS as Distributed by MLS Grid
- 2025-08-20 Price Changed $115,000 NORTHSTARMLS as Distributed by MLS Grid
- 2025-08-11 Listed $119,000 NORTHSTARMLS as Distributed by MLS Grid
- 2025-07-25 Listing Removed — NORTHSTARMLS as Distributed by MLS Grid
- 2025-06-22 Relisted — NORTHSTARMLS as Distributed by MLS Grid
- 2025-06-22 Price Changed $109,000 NORTHSTARMLS as Distributed by MLS Grid
- 2025-06-06 Listed $115,000 NORTHSTARMLS as Distributed by MLS Grid
- 1997-02-26 Listing Removed — NORTHSTARMLS as Distributed by MLS Grid
- 1997-02-10 Listed $54,900 NORTHSTARMLS as Distributed by MLS Grid
- 1995-01-06 Sold (Public Records) $36,001 Public Records
- 1994-06-01 Listing Removed — NORTHSTARMLS as Distributed by MLS Grid
- 1994-01-04 Listed $54,900 NORTHSTARMLS as Distributed by MLS Grid
- 1993-12-29 Listing Removed — NORTHSTARMLS as Distributed by MLS Grid
- 1993-11-05 Listed $54,900 NORTHSTARMLS as Distributed by MLS Grid
- 1993-11-04 Listing Removed — NORTHSTARMLS as Distributed by MLS Grid
- 1993-09-09 Listed $54,900 NORTHSTARMLS as Distributed by MLS Grid
Property tax history
+0.4%/yrLatest (2025): $1,859 · +2.5% YoY. Source: county tax records.
Cash-flow waterfall
monthlySold comps — $/sqft
last 12 mo · ≤1 miLoading sold comps…