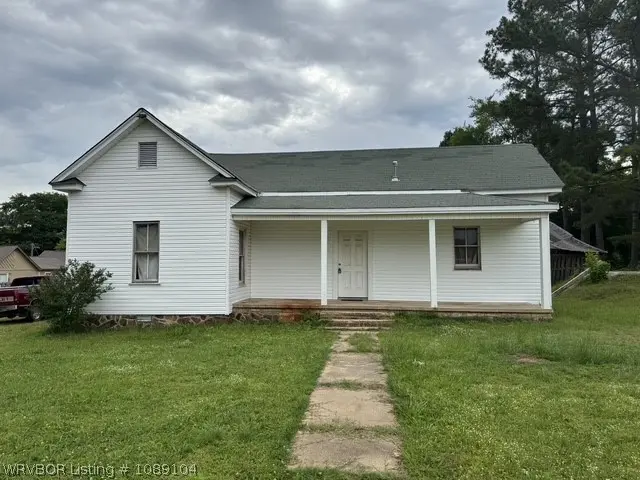
118 Wood St · Charleston, AR
Flood risk 1/10 · Minimal
- FEMA flood zone
- X (unshaded)
- Chance of flooding over 30 yrs
- 0.0%
- Est. flood insurance / yr
- $507 – $1,088
Fire risk 7/10 · Major
- Est. fire insurance / yr
- $1,499 – $2,785
Heat risk 6/10 · Moderate
- Hot days now (above 112°F)
- 7 days/yr
- Hot days in 30 yrs
- 20 days/yr
Wind risk 2/10 · Minimal
- Chance of severe wind over 30 yrs
- 2.0%
Air-quality risk 2/10 · Minimal
- Unhealthy air days now
- 0 days/yr
- Unhealthy air days in 30 yrs
- 1 days/yr
Risk factors via First Street. Map © Google.
Why this score? — see what drove the B+ grade
The composite is a weighted blend of 9 inputs, each scored 0–100. Each bar is that input's sub-score; the figure is the points it added to the 100-point composite (weight × sub-score).
- Cash flow +30.0/30.0
- 1% rule +10.0/10.0
- DSCR +10.0/10.0
- Appreciation +10.0/10.0
- ARV discount +7.5/15.0
- Schools +3.8/10.0
- Livability +3.5/5.0
- Rent growth +2.5/5.0
- Condition / age +2.5/5.0
$37,500
🖨 Deal sheet 📄 Offer letter ✓ Due diligence
Listing remarks MLS
Auction 12/1/2023 @ 11 am. Appx 946 sf 1 bedroom/1 bath home with vinyl siding & outbuildings on appx 0.59-acre lot. Home is ready to remodel or tear down and build something new on this large lot. We will also be selling 1101 Falconer St next door. 10% buyer's premium.
Key facts
- Extra-large lot
- Manageable layout
- Outdoor living
Tags
Property features AI
Finance
- Other: Cleared, level lot; Public maintained road; Lot dimensions approximately 86 x 229; Subdivision: Ellison Add
Exterior
- Utilities: Public water; Electricity available; Sewer available; Water available
- Home design: Single-family residence; One story; House
- Construction: Vinyl siding; Fiberglass and shingle roof
- Exterior features: Covered porch; Porch
Interior
- Flooring: Wood
- Bathrooms: 1 full bathroom
- Interior features: Wood flooring
- Laundry & utility: No laundry hookups or dedicated laundry area
Neighborhood map
What this means for you Summary
Snapshot
- This is a 2-bed/1.0-bath single-family listed at $38k.
Deal economics
- At list price, monthly cash flow is $545 ($7k/yr) — positive.
- The deal already cash-flows at list — no discount required.
- Meets the 1% rule at list price ($1k rent vs $38k).
- Recommended offer: $36k (3.0% below list) — sets the bar for market timing.
Location & tenants
- Location reads 69/100 on livability (#70 in AR) — a middle-class / working-renter tenant base. Strengths: cost of living A+, housing A+, health & safety A+; Watch: crime D, amenities F, commute F.
- Charleston School District (rural): math 46% / reading 43% proficiency, ranked #39 of 238 in AR (top 16%) — families likely to look elsewhere, expect single-tenant / working-renter base with shorter leases.
- Zoned schools: Charleston Elementary School (math 56% / reading 41%, grade D, #109 of 454 statewide, top 25%, 454 students, 47% FRL); Charleston High School (math 38% / reading 46%, grade F, #38 of 292 statewide, top 14%, 435 students, 44% FRL).
- Market conditions: 51 active listings in the ZIP; 2 comparable units currently listed for rent nearby; 23 units permitted in Franklin County in 2024 (0 in 5+ unit buildings).
Forward outlook
- In year one you build about $4k of equity ($259 loan paydown + $4k appreciation (10.0% local appreciation)).
- Franklin County population projected at -16% by 2050 — secular population decline; favor cash flow + early exit over multi-decade hold.
- At projected returns (10.0% appreciation + 3.0% rent growth), your $10k cash investment doubles in ~1 year — after that, you're playing with house money.
- By year 8, paydown + projected appreciation supports a ~$35k cash-out refi (75% LTV) — recoverable capital for the next deal without selling this one.
Negotiation context
- It's been on market 34 days — a 3% lower offer ($36k) is reasonable based on typical stale-listing flexibility.
- 2 sale attempts since 3y ago; this cycle's ask has dropped $2k (6%) from the opening price — seller is motivated, your offer sets the floor, not the list.
- Current owner paid $13k; list at $38k implies a 184% gain — meaningful room to come down on a strong offer.
Risks & watch-outs
- Climate carrying-cost: major wildfire risk; extreme-heat days projected 7→20/yr by 2055 (HVAC capex compounding) — expect insurance premiums to compound above CPI over the hold.
Questions for the listing agent
- It's been on market 34 days. Have you received any prior offers? Is the seller open to a 3% concession, seller financing, or rate buy-down credit?
- Built in 1966 — when were the roof, HVAC, electrical panel, plumbing, and water heater last replaced?
- Is there a deadline driving the sale (1031 exchange, divorce, estate, relocation)? That informs how much negotiation room exists.
- Crime grade is D in this area — have there been break-ins, vandalism, or insurance claims at this property in the last 3 years? What carrier currently insures it and at what premium?
- What's the average days-on-market for RENTAL listings here right now (not sales)? A rising rental-DOM trend means longer vacancies and softer asking-rent achievability than the comps imply.
- What's the recent tenant-quality profile in this submarket — average credit score on applications, eviction rate, late-payment / NSF rate, and stable-employment percentage? A property-management company in the area should have these aggregated.
- How much new for-sale + rental construction is in the pipeline within 1–3 miles? Heavy new supply typically softens prices + rents 12–24 months out; constrained supply supports both.
Investment metrics
- 1% rule
- 2.69% ✓
- Cap rate
- 23.74%
- Cash-on-cash
- 62.31%
- DSCR
- 3.77
- GRM
- 3.1
CMA / ARV
- ARV (on-the-fly)
- $106,898
- Comps found
- 9
Show comp detail 9 sales within ~0.75 mi
| Address | Dist | Beds/Ba | Sqft | Sold | Price | $/sf | Match |
|---|---|---|---|---|---|---|---|
| 506 Newton St | 0.30mi | 2/1.0 | 888 (-6%) | 21mo | $100,000 | $113 | 58 |
| 123 S Logan St | 0.37mi | 2/1.0 | 891 (-6%) | 20mo | $83,000 | $93 | 57 |
| 722 2nd St | 0.30mi | 3/1.0 (+1) | 1,064 (+12%) | 6mo | $120,000 | $113 | 55 |
| 108 Church St | 0.56mi | 2/1.0 | 1,042 (+10%) | 4mo | $59,900 | $57 | 54 |
| 526 N Vine St | 0.49mi | 3/1.0 (+1) | 1,000 (+6%) | 12mo | $129,000 | $129 | 52 |
| 705 Newton St | 0.39mi | 3/2.0 (+1) | 1,079 (+14%) | 3mo | $170,000 | $158 | 47 |
| 711 Logan St | 0.68mi | 3/1.0 (+1) | 888 (-6%) | 7mo | $25,000 | $28 | 47 |
| 23 Church St | 0.58mi | 3/1.0 (+1) | 1,020 (+8%) | 14mo | $42,900 | $42 | 43 |
| 422 Wyndy Height Dr | 0.51mi | 3/1.0 (+1) | 1,032 (+9%) | 17mo | $145,000 | $141 | 41 |
Match score weights: distance 35% · size 25% · config 20% · recency 20%. Top-matched comps best support the ARV.
Projected returns pro-forma
10.0% appreciation · 3.0% rent growth · sell at horizon
- IRR
- 74.2%
- Equity multiple
- 6.25×
- Total profit
- $55,158
- Equity at exit
- $33,783
- IRR
- 68.1%
- Equity multiple
- 13.87×
- Total profit
- $135,148
- Equity at exit
- $72,854
Cash invested: $10,500 (down + closing). Projections, not guarantees.
Landlord ↔ Tenant lean methodology
- Overall (STATE)
- 92 Strongly Landlord-Friendly
- State Arkansas
- 92 Strongly Landlord-Friendly · R+14
- County
- — inherits STATE
- City
- — inherits STATE
ZIP-level market 72933
- Home prices YoY
- 5.8%
- Active inventory
- 51
- Price-to-rent
- 3.1×
Monthly cashflow live
- Estimated rent
- $1,010 medium interval (Pro) →
- Mortgage (P&I)
- −$197
- Tax from tax record
- −$40 /mo · $486/yr
- Insurance
- −$16
- HOA
- −$0
- Vacancy / Maint / Mgmt
- −$212
- Net cashflow
- $545
Break-even live
UW: 25.0% down · 7.5% · 30yr · 1.5% tax · 5.0% vac · 8.0% maint · 8.0% mgmt
Financing live
Cash to close
- Down payment
- $9,375
- Closing costs
- $1,125
- Reserves months
- —
- Total cash needed
- —
Loan-product check · same deal, 3 products live
Conventional
25% down · 7.5% · 30yr
- Down + closing
- —
- Monthly P&I
- —
- Monthly cashflow
- —
- DSCR
- —
- Eligible?
- —
Personal DTI + credit; lowest rate.
DSCR
20% down · 8.5% · 30yr
- Down + closing
- —
- Monthly P&I
- —
- Monthly cashflow
- —
- DSCR
- —
- Eligible?
- —
No personal income docs; deal must DSCR.
Hard money
10% down · 12.0% · 12mo
- Down + closing
- —
- Monthly P&I
- —
- Monthly cashflow
- —
- DSCR
- —
- Eligible?
- —
Short-term bridge; refi at stabilization.
Rent comps 2 comps
| Address | Beds | Baths | Sqft | Rent | $/sqft | DOM | Units | Dist |
|---|---|---|---|---|---|---|---|---|
| 96 N School St Unit 15 Charleston, AR | 2.0 | 1.5 | 952 | $1,195 | $1.26 | 13d | 1 | 0.71mi |
| 12832 Arkansas 217 Unit A-1 Charleston, AR | 2.0 | 2.0 | 864 | $800 | $0.93 | 43d | 1 | 0.74mi |
Listing history 23 events
-
2026-06-19days on market $37,500 Active 34 DOM
-
2026-06-18days on market $37,500 Active 33 DOM
-
2026-06-17days on market $37,500 Active 32 DOM
-
2026-06-16days on market $37,500 Active 31 DOM
-
2026-06-15days on market $37,500 Active 30 DOM
-
2026-06-14pricedays on market $37,500 Active 28 DOM
-
2026-06-12days on market $40,000 Active 27 DOM
-
2026-06-09days on market $40,000 Active 24 DOM
-
2026-06-08days on market $40,000 Active 23 DOM
-
2026-06-07days on market $40,000 Active 22 DOM
-
2026-06-07days on market $40,000 Active 21 DOM
-
2026-06-04days on market $40,000 Active 18 DOM
-
2026-06-02days on market $40,000 Active 17 DOM
-
2026-06-01days on market $40,000 Active 16 DOM
-
2026-05-31days on market $40,000 Active 15 DOM
-
2026-05-31days on market $40,000 Active 14 DOM
-
2026-05-16$40,000 Active
-
2023-12-29soldstatus $13,200 Closed 276-char remark
Show marketing remark (276 chars)
Auction 12/1/2023 @ 11 am. Appx 946 sf 1 bedroom/1 bath home with vinyl siding & outbuildings on appx 0.59-acre lot. Home is ready to remodel or tear down and build something new on this large lot. We will also be selling 1101 Falconer St next door. 10% buyer's premium.
-
2023-12-01status Pending 276-char remark
Show marketing remark (276 chars)
Auction 12/1/2023 @ 11 am. Appx 946 sf 1 bedroom/1 bath home with vinyl siding & outbuildings on appx 0.59-acre lot. Home is ready to remodel or tear down and build something new on this large lot. We will also be selling 1101 Falconer St next door. 10% buyer's premium.
-
2023-12-01price $13,200 276-char remark
Show marketing remark (276 chars)
Auction 12/1/2023 @ 11 am. Appx 946 sf 1 bedroom/1 bath home with vinyl siding & outbuildings on appx 0.59-acre lot. Home is ready to remodel or tear down and build something new on this large lot. We will also be selling 1101 Falconer St next door. 10% buyer's premium.
-
2023-11-02$1 Active 276-char remark
Show marketing remark (276 chars)
Auction 12/1/2023 @ 11 am. Appx 946 sf 1 bedroom/1 bath home with vinyl siding & outbuildings on appx 0.59-acre lot. Home is ready to remodel or tear down and build something new on this large lot. We will also be selling 1101 Falconer St next door. 10% buyer's premium.
-
2020-03-17soldstatus $50,000
-
1991-06-26soldstatus $12,000
ⓘ Source: listings_history table (triggers on properties + properties_extension) + one-shot
backfill from property_details.listing_events for pre-trigger history.
Tax reassessment forecast AR · Resets to sale price
- Current annual tax
- $486 · $40/mo
- Projected year-2 tax
- $486 · $40/mo
- Expected delta
- $0/yr ($0/mo · 0.0%)
ⓘ Screening estimate from a state-policy table — verify with the county assessor before closing.
Climate risk First Street
- Flood 1/10 Low FEMA zone X (unshaded) · 0% chance over 30 yrs
- Wildfire 7/10 Severe
- Heat 6/10 Major 7 d/yr ≥112°F today · 20 d/yr by 30 yrs out
- Wind 2/10 Low 2% chance of damaging wind over 30 yrs
- Air quality 2/10 Low 0 unhealthy d/yr today · 1 by 30 yrs out
Nearby sold comps map
Loading sold comps map…
Walkable amenities ~0.75 mi
Loading nearby amenities…
Taxation est. · year 1
- Rental income
- $12,121
- − Mortgage interest
- −$2,101
- − Property taxes
- −$486
- − Insurance
- −$188
- − Repairs & maintenance
- −$970
- − Management
- −$970
- − Depreciation
- −$1,091
- Taxable income
- $6,317
- Est. tax owed @ 24.0%
- −$1,516
- After-tax cash flow
- $5,026/yr
For passive investors: Depreciation is non-cash, so a rental often shows a tax loss while cash-flowing — sheltering income. Rental losses are passive: they offset passive income freely, and up to $25,000/yr can offset ordinary (W-2) income if you actively participate and your MAGI is under $100k (phasing out to $0 by $150k); unused losses carry forward. On sale, claimed depreciation is recaptured at up to 25%, and gains may owe capital-gains tax (a 1031 exchange can defer both). Figures are a year-1 estimate at your 24.0% rate — not tax advice; consult a CPA.
Schools (NCES district)
- District
- Charleston School District
- NCES district ID
- 0504200
- Math proficiency
- 46% ▼ -12.00%
- Reading proficiency
- 43% ▼ -9.00%
- Median HH income
- $47,155
- Composite
- 37.97/100
- National rank
- #4296
- State rank
- #39 of 238 in AR
Livability — Charleston
- Score
- 69/100
- State rank
- #70
- US rank
- #8583
Category grades
Schools grade is shown separately in the Schools card above.
Census & demographics
- Census place
- Charleston, AR
- Population (ZIP)
- 5,207
Population outlook (Franklin County) Hauer SSP2
- Today (2025)
- 16,946 people
- By 2030
- 16,403 · -3.2%
- By 2040
- 15,303 · -9.7%
- By 2050
- 14,243 · -16.0%
- By 2075
- 12,136 · -28.4%
- By 2100
- 10,443 · -38.4%
Race, ethnicity, and origin ACS 2023
- Neighborhood character
- Predominantly White (86%)
- Race & ethnicity
- White 86% Two or more races 10% Hispanic / Latino 2%
- Common ancestry
- Slovak 2% Iranian 2% Italian 1%
- Foreign-born
- 1%
Political lean MEDSL · Franklin
- 2024 margin
- Solid R (+62.4) · D 17.7% · R 80.1% · Other 2.2%
- 2008→2024 swing
- -23.1pp toward R · 2008: -39.3pp · 2024: -62.4pp
- All cycles
- 2024: R+62.4 2020: R+61.4 2016: R+54.6 2012: R+44.4 2008: R+39.3
Not yet ingested
- Civics
- —
Market trends
- HPI YoY
- ▲ 15.06%
- Current HPI
- 273.2222
- Rent YoY
- —
- Metro
- —
- State GDP YoY
- ▲ 3.80%
- F500 in state
- 10
Industry mix (Fortune 500 HQ in AR)
| Industry | F500 HQs | Revenue |
|---|---|---|
| Retail | 1 | $681B |
|
||
| Food / Agriculture | 1 | $53B |
|
||
| Retail / Energy | 1 | $22B |
|
||
| Transportation / Logistics | 1 | $12B |
|
||
| Energy | 1 | $4B |
|
||
Price history
+233.3% since first listed7 events — show timeline
- 2026-05-16 Listed $40,000 WRVBOR
- 2023-12-29 Sold (MLS) $13,200 WRVBOR
- 2023-12-01 Pending — WRVBOR
- 2023-12-01 Price Changed $13,200 WRVBOR
- 2023-11-02 Listed $1 WRVBOR
- 2020-03-17 Sold (Public Records) $50,000 Public Records
- 1991-06-26 Sold (Public Records) $12,000 Public Records
Property tax history
+1.5%/yrLatest (2025): $486 · +0.0% YoY. Source: county tax records.
Cash-flow waterfall
monthlySold comps — $/sqft
last 12 mo · ≤1 miLoading sold comps…