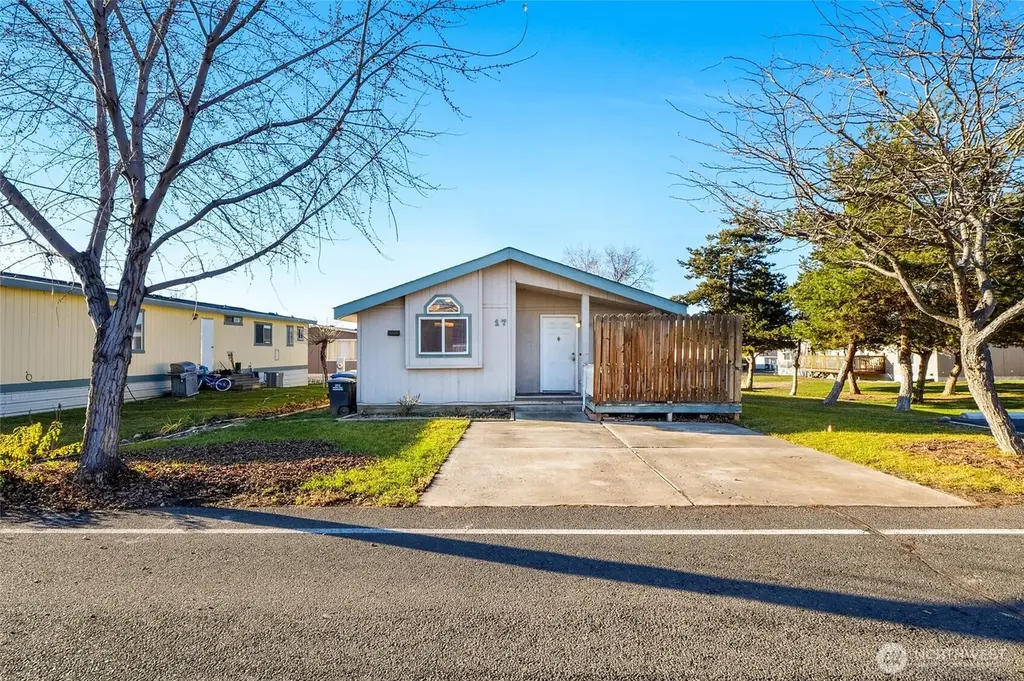
900 N Grape Dr #17 · Moses Lake, WA
Flood risk 1/10 · Minimal
- FEMA flood zone
- X (unshaded)
- Chance of flooding over 30 yrs
- 0.0%
- Est. flood insurance / yr
- $507 – $1,088
Fire risk 2/10 · Minimal
- Est. fire insurance / yr
- $604 – $1,122
Heat risk 4/10 · Minor
- Hot days now (above 96°F)
- 7 days/yr
- Hot days in 30 yrs
- 15 days/yr
Wind risk 1/10 · Minimal
- Chance of severe wind over 30 yrs
- —
Air-quality risk 7/10 · Major
- Unhealthy air days now
- 12 days/yr
- Unhealthy air days in 30 yrs
- 14 days/yr
Risk factors via First Street. Map © Google.
Why this score? — see what drove the D grade
The composite is a weighted blend of 9 inputs, each scored 0–100. Each bar is that input's sub-score; the figure is the points it added to the 100-point composite (weight × sub-score).
- Cash flow +15.0/30.0
- ARV discount +7.5/15.0
- 1% rule +5.0/10.0
- DSCR +5.0/10.0
- Schools +3.9/10.0
- Livability +3.8/5.0
- Condition / age +2.2/5.0
- Rent growth +2.1/5.0
- Appreciation +0.0/10.0
$39,999
🖨 Deal sheet 📄 Offer letter ✓ Due diligence
Listing remarks
Affordable opportunity with flexibility! This approximately 1,000 sq ft manufactured home offers great potential for buyers willing to add some TLC. The home may remain in Village Park Mobile Home Park or be relocated to your own property, providing multiple options to suit your needs. Priced at $47,000 with a motivated seller—bring your vision and make it your own. Ideal for investors, first-time buyers, or those seeking a budget-friendly housing solution.
Key facts
- Parking
- Built 1997
- Listed 114 days
Neighborhood map
What this means for you Summary
Snapshot
- This is a 3-bed/2.0-bath manufactured listed at $40k. Condition is rated fair.
Deal economics
- At list price, monthly cash flow is $1k ($14k/yr) — positive.
- The deal already cash-flows at list — no discount required.
- Meets the 1% rule at list price ($2k rent vs $40k).
- Recommended offer: $36k (9.0% below list) — sets the bar for market timing.
- Cap rate 40.1% vs local median 3.3% in Moses Lake — top-decile yield for the area; either an underpriced asset or a hidden risk that comps aren't pricing in. Stress-test before assuming the spread holds.
Location & tenants
- Location reads 75/100 on livability (#170 in WA, #4,228 nationally) — a middle-class / working-renter tenant base. Strengths: housing A+, health & safety A+, amenities A-; Watch: employment C-, schools D+, crime F.
- Moses Lake School District (town): math 38% / reading 48% proficiency, ranked #198 of 291 in WA (top 68%) — families likely to look elsewhere, expect single-tenant / working-renter base with shorter leases.
- Market conditions: Rents soft (-1.7%/yr); 585 active listings in the ZIP; 12 comparable units currently listed for rent nearby; rentals lingering (median 44d on market — plan ~5-8 weeks vacancy on turnover, expect pricing pressure); 100% of comp listings sitting > 30 days — soft ceiling on asking rent; 559 units permitted in Grant County in 2024 (35 in 5+ unit buildings).
Forward outlook
- Local home prices are declining (-3.0%/yr); year-one equity from $276 of loan paydown is wiped out by about $1k of value loss. Plan a longer hold.
- Grant County population projected at +16% by 2050 — long-run rental-demand tailwind backs the buy-and-hold thesis.
- At projected returns (-3.0% appreciation + 0.0% rent growth), your $11k cash investment doubles in ~1 year — after that, you're playing with house money.
Negotiation context
- It's been on market 115 days — a 9% lower offer ($36k) is reasonable based on typical stale-listing flexibility.
- 3 sale attempts; this cycle's ask has dropped $7k (15%) from the opening price — seller is motivated, your offer sets the floor, not the list.
Questions for the listing agent
- It's been on market 115 days. Have you received any prior offers? Is the seller open to a 9% concession, seller financing, or rate buy-down credit?
- Have any recent inspections been done? Can we get a copy of the seller's disclosures and any deferred-maintenance estimates?
- Why hasn't it sold? Are there any deal-killer items the seller is aware of (foundation, flood, title, zoning, code violations)?
- Is there a deadline driving the sale (1031 exchange, divorce, estate, relocation)? That informs how much negotiation room exists.
- Schools are D-rated, which usually means shorter tenancies and higher turnover. Who's the typical renter profile here, and what's been the actual vacancy rate?
- Crime grade is F in this area — have there been break-ins, vandalism, or insurance claims at this property in the last 3 years? What carrier currently insures it and at what premium?
- The area grade is low — what's the realistic commute time and amenity access for the typical tenant pool here? Any planned neighborhood developments (good or bad) we should know about?
- What's the average days-on-market for RENTAL listings here right now (not sales)? A rising rental-DOM trend means longer vacancies and softer asking-rent achievability than the comps imply.
- What's the recent tenant-quality profile in this submarket — average credit score on applications, eviction rate, late-payment / NSF rate, and stable-employment percentage? A property-management company in the area should have these aggregated.
- How much new for-sale + rental construction is in the pipeline within 1–3 miles? Heavy new supply typically softens prices + rents 12–24 months out; constrained supply supports both.
Investment metrics
- 1% rule
- 4.44% ✓
- Cap rate
- 40.08%
- Cash-on-cash
- 120.66%
- DSCR
- 6.37
- GRM
- 1.9
CMA / ARV
- ARV (median comp)
- $215,000
- List price
- $39,999
- Delta
- -81.40%
- Verdict
- UNDERPRICED
- Comps
- 3 within 1.0 mi
Show comp detail 2 sales within ~0.75 mi
| Address | Dist | Beds/Ba | Sqft | Sold | Price | $/sf | Match |
|---|---|---|---|---|---|---|---|
| 900 N Grape Dr #36 | 0.05mi | 3/2.0 | 924 (-12%) | 15mo | $48,500 | $52 | 66 |
| 8780 NE Lybbert Dr | 0.62mi | 3/2.0 | 1,152 (+10%) | 1mo | $275,000 | $239 | 54 |
Match score weights: distance 35% · size 25% · config 20% · recency 20%. Top-matched comps best support the ARV.
Projected returns pro-forma
-3.0% appreciation · 0.0% rent growth · sell at horizon
- IRR
- —
- Equity multiple
- 6.36×
- Total profit
- $60,068
- Equity at exit
- $5,964
- IRR
- —
- Equity multiple
- 12.13×
- Total profit
- $124,666
- Equity at exit
- $3,458
Cash invested: $11,200 (down + closing). Projections, not guarantees.
Landlord ↔ Tenant lean methodology
- Overall (STATE)
- 28 Tenant-Leaning
- State Washington
- 28 Tenant-Leaning · D+8
- County
- — inherits STATE
- City
- — inherits STATE
ZIP-level market 98837
- Rents YoY
- -1.7%
- Active inventory
- 585
- Price-to-rent
- 1.9×
Monthly cashflow live
- Estimated rent
- $1,775 high interval (Pro) →
- Mortgage (P&I)
- −$210
- Tax est. 1.5%
- −$50 /mo · $600/yr
- Insurance
- −$17
- HOA
- −$0
- Vacancy / Maint / Mgmt
- −$373
- Net cashflow
- $1,126
Break-even live
UW: 25.0% down · 7.5% · 30yr · 1.5% tax · 5.0% vac · 8.0% maint · 8.0% mgmt
Financing live
Cash to close
- Down payment
- $10,000
- Closing costs
- $1,200
- Reserves months
- —
- Total cash needed
- —
Loan-product check · same deal, 3 products live
Conventional
25% down · 7.5% · 30yr
- Down + closing
- —
- Monthly P&I
- —
- Monthly cashflow
- —
- DSCR
- —
- Eligible?
- —
Personal DTI + credit; lowest rate.
DSCR
20% down · 8.5% · 30yr
- Down + closing
- —
- Monthly P&I
- —
- Monthly cashflow
- —
- DSCR
- —
- Eligible?
- —
No personal income docs; deal must DSCR.
Hard money
10% down · 12.0% · 12mo
- Down + closing
- —
- Monthly P&I
- —
- Monthly cashflow
- —
- DSCR
- —
- Eligible?
- —
Short-term bridge; refi at stabilization.
Rent comps 12 comps
| Address | Beds | Baths | Sqft | Rent | $/sqft | DOM | Units | Dist |
|---|---|---|---|---|---|---|---|---|
| 1013 N Pierce Dr Apt B Moses Lake, WA | 3.0 | 2.0 | 1200 | $1,695 | $1.41 | 43d | 1 | 0.14mi |
| 1133 N Grape Dr Moses Lake, WA | 1.0–2.0 | 1.0–2.0 | 859 | $1,825 | $2.12 | 43d | 12 | 0.19mi |
| 422 N Washington St Moses Lake, WA | 3.0 | 2.0 | 1166 | $2,200 | $1.89 | 43d | 1 | 0.39mi |
| 606 W Crest Dr Moses Lake, WA | 2.0 | 2.0 | 1200 | $1,800 | $1.50 | 43d | 1 | 0.41mi |
| 9436 Beacon Rd NE Moses Lake, WA | 2.0 | 1.0 | 1181 | $1,295 | $1.10 | 43d | 1 | 0.72mi |
| 1118 W Sequoia Rd Moses Lake, WA | 3.0 | 2.0 | 1235 | $2,000 | $1.62 | 43d | 1 | 0.75mi |
| 1013 W Maple Dr Moses Lake, WA | 3.0 | 2.0 | 1450 | $1,875 | $1.29 | 43d | 1 | 0.82mi |
| 4208 Stratford Rd NE Moses Lake, WA | 3.0 | 1.0 | 1440 | $1,495 | $1.04 | 43d | 1 | 0.94mi |
| 4727 Owens Rd NE #24 Moses Lake, WA | 2.0 | 1.0 | 900 | $1,200 | $1.33 | 43d | 1 | 1.15mi |
| 211 E 6th Ave Apt B Moses Lake, WA | 3.0 | 2.5 | 1332 | $1,775 | $1.33 | 43d | 1 | 1.36mi |
| 615 S Alder St #02 Moses Lake, WA | 2.0 | 1.0 | 742 | $1,200 | $1.62 | 43d | 1 | 1.41mi |
| 1205 W Ivy Ave Unit 101 Moses Lake, WA | 2.0 | 1.0 | 900 | $1,150 | $1.28 | 43d | 1 | 1.49mi |
Listing history 16 events
-
2026-06-10days on market $39,999 Active 115 DOM
-
2026-06-09days on market $39,999 Active 114 DOM
-
2026-06-08days on market $39,999 Active 113 DOM
-
2026-06-07days on market $39,999 Active 112 DOM
-
2026-06-05days on market $39,999 Active 109 DOM
-
2026-06-03days on market $39,999 Active 108 DOM
-
2026-06-02days on market $39,999 Active 107 DOM
-
2026-06-01days on market $39,999 Active 106 DOM
-
2026-05-31days on market $39,999 Active 105 DOM
-
2026-05-30days on market $39,999 Active 104 DOM
-
2026-05-09price $39,999
-
2026-03-28status Active
-
2026-02-24status Pending
-
2026-02-19status Active
-
2026-01-22status Pending
-
2025-12-17$47,000 Active
ⓘ Source: listings_history table (triggers on properties + properties_extension) + one-shot
backfill from property_details.listing_events for pre-trigger history.
Climate risk First Street
- Flood 1/10 Low FEMA zone X (unshaded) · 0% chance over 30 yrs
- Wildfire 2/10 Low
- Heat 4/10 Moderate 7 d/yr ≥96°F today · 15 d/yr by 30 yrs out
- Wind 1/10 Low
- Air quality 7/10 Severe 12 unhealthy d/yr today · 14 by 30 yrs out
Nearby sold comps map
Loading sold comps map…
Walkable amenities ~0.75 mi
Loading nearby amenities…
Taxation est. · year 1
- Rental income
- $21,305
- − Mortgage interest
- −$2,241
- − Property taxes
- −$600
- − Insurance
- −$200
- − Repairs & maintenance
- −$1,704
- − Management
- −$1,704
- − Depreciation
- −$1,164
- Taxable income
- $13,692
- Est. tax owed @ 24.0%
- −$3,286
- After-tax cash flow
- $10,228/yr
For passive investors: Depreciation is non-cash, so a rental often shows a tax loss while cash-flowing — sheltering income. Rental losses are passive: they offset passive income freely, and up to $25,000/yr can offset ordinary (W-2) income if you actively participate and your MAGI is under $100k (phasing out to $0 by $150k); unused losses carry forward. On sale, claimed depreciation is recaptured at up to 25%, and gains may owe capital-gains tax (a 1031 exchange can defer both). Figures are a year-1 estimate at your 24.0% rate — not tax advice; consult a CPA.
Condition & rehab AI · 12 photos
This manufactured home requires moderate repairs and maintenance to improve its curb appeal and overall condition, making it an affordable opportunity for investors or first-time buyers.
Repairs flagged
- Moderate exterior siding — Weathered and discolored
- Moderate exterior paint — Some discoloration
- Minor exterior landscaping — Some overgrown areas
Value-add opportunities
- Resale paint exterior — Enhances curb appeal
- Resale repair exterior siding — Improves home's appearance
- Resale landscape exterior — Enhances curb appeal
- Both update kitchen appliances — Modernizes and increases value
- Both update bathrooms — Modernizes and increases value
Renovation cost estimate screening
| Repair item | Severity | Est. cost |
|---|---|---|
| exterior siding · Weathered and discolored | Moderate | $3,000–15,000 |
| exterior paint · Some discoloration | Moderate | $3,000–15,000 |
| exterior landscaping · Some overgrown areas | Minor | $500–3,000 |
| Total estimated repair cost · 3 items | $6,500–33,000 |
Value-add ROI direction
- Resale paint exterior — Enhances curb appeal ↑
- Resale repair exterior siding — Improves home's appearance ↑
- Resale landscape exterior — Enhances curb appeal ↑
- Both update kitchen appliances — Modernizes and increases value ↑
- Both update bathrooms — Modernizes and increases value ↑
ⓘ Cost ranges are severity-bucket heuristics (US national rule-of-thumb). Get contractor quotes + a written scope before underwriting a rehab budget.
Schools (NCES district)
- District
- Moses Lake School District
- NCES district ID
- 5305220
- Math proficiency
- 38% ▬ 0.00%
- Reading proficiency
- 48% ▼ -1.00%
- Median HH income
- $49,033
- Composite
- 39.17/100
- National rank
- #8232
- State rank
- #198 of 291 in WA
Livability — Moses Lake
- Score
- 75/100
- State rank
- #170
- US rank
- #4228
Category grades
Schools grade is shown separately in the Schools card above.
Census & demographics
- Census place
- Moses Lake, WA
- County
- Grant County · 61,643 people
- City population
- 49,455
- Metro
- Moses Lake, WA
- Population (ZIP)
- 49,455
- Household income
- $74,586
- Rent vs Own
- Severe rent burden
- 1064.0
Population outlook (Grant County) Hauer SSP2
- Today (2025)
- 99,356 people
- By 2030
- 102,107 · +2.8%
- By 2040
- 108,318 · +9.0%
- By 2050
- 114,712 · +15.5%
- By 2075
- 131,376 · +32.2%
- By 2100
- 146,163 · +47.1%
Race, ethnicity, and origin ACS 2023
- Neighborhood character
- Diverse neighborhood (Simpson 0.55)
- Race & ethnicity
- White 58% Hispanic / Latino 33% Two or more races 15% Black 2% Asian 1%
- Hispanic origin (detail)
- Mexican 30%
- Common ancestry
- Portuguese 3% Subsaharan African 2% Lithuanian 2%
- Foreign-born
- 10% · Canada
- Languages at home
- 76% English-only · Spanish 21% Russian/Polish/Slavic 2%
Political lean MEDSL · Grant
- 2024 margin
- Solid R (+37.5) · D 30.0% · R 67.4% · Other 2.6%
- 2008→2024 swing
- -9.9pp toward R · 2008: -27.5pp · 2024: -37.5pp
- All cycles
- 2024: R+37.5 2020: R+34.4 2016: R+37.9 2012: R+32.6 2008: R+27.5
Not yet ingested
- Civics
- —
Market trends
- HPI YoY
- ▼ -384.29%
- Current HPI
- 208.4574
- Rent YoY
- ▼ -1.72%
- Metro
- Moses Lake, WA
- State GDP YoY
- ▲ 4.65%
- F500 in state
- 22
Industry mix (Fortune 500 HQ in WA)
| Industry | F500 HQs | Revenue |
|---|---|---|
| Retail | 2 | $269B |
|
||
| Technology / Retail | 1 | $638B |
|
||
| Technology | 1 | $245B |
|
||
| Telecommunications | 1 | $38B |
|
||
| Food / Beverage | 1 | $36B |
|
||
| Automotive / Trucks | 1 | $34B |
|
||
Price history
-14.9% since first listed6 events — show timeline
- 2026-05-09 Price Changed $39,999 NWMLS as Distributed by MLS Grid
- 2026-03-28 Relisted — NWMLS as Distributed by MLS Grid
- 2026-02-24 Pending — NWMLS as Distributed by MLS Grid
- 2026-02-19 Relisted — NWMLS as Distributed by MLS Grid
- 2026-01-22 Pending — NWMLS as Distributed by MLS Grid
- 2025-12-17 Listed $47,000 NWMLS as Distributed by MLS Grid
Cash-flow waterfall
monthlySold comps — $/sqft
last 12 mo · ≤1 miLoading sold comps…