1430 10th St · Des Moines, IA
Flood risk 1/10 · Minimal
- FEMA flood zone
- X (unshaded)
- Chance of flooding over 30 yrs
- 0.0%
- Est. flood insurance / yr
- $473 – $860
Fire risk 1/10 · Minimal
- Est. fire insurance / yr
- $902 – $1,676
Heat risk 3/10 · Minor
- Hot days now (above 103°F)
- 7 days/yr
- Hot days in 30 yrs
- 15 days/yr
Wind risk 2/10 · Minimal
- Chance of severe wind over 30 yrs
- —
Air-quality risk 2/10 · Minimal
- Unhealthy air days now
- 1 days/yr
- Unhealthy air days in 30 yrs
- 2 days/yr
Risk factors via First Street. Map © Google.
Why this score? — see what drove the C- grade
The composite is a weighted blend of 9 inputs, each scored 0–100. Each bar is that input's sub-score; the figure is the points it added to the 100-point composite (weight × sub-score).
- Cash flow +17.0/30.0
- Appreciation +10.0/10.0
- DSCR +5.3/10.0
- Rent growth +4.5/5.0
- 1% rule +4.4/10.0
- Livability +4.0/5.0
- Schools +3.8/10.0
- Condition / age +2.5/5.0
- ARV discount +0.0/15.0
$315,000
🖨 Deal sheet (PDF) 📄 Offer letter ✓ Due diligence
Listing remarks MLS
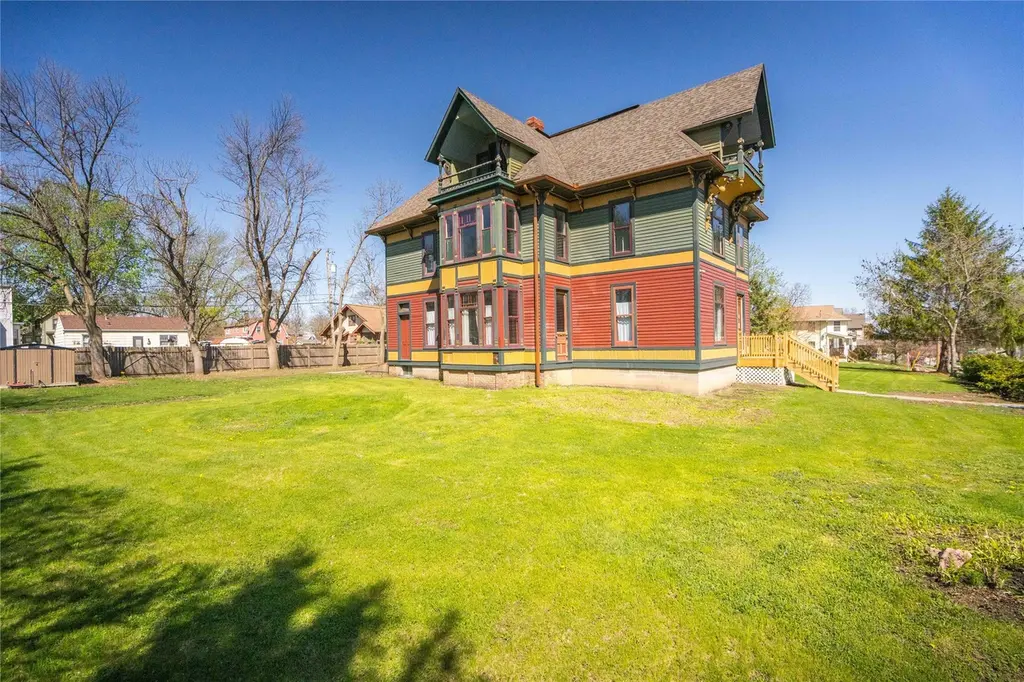
Nows yours chance to own an incredible piece of Des Moines history with the Rev. R. W. and Fannie E. Keeler House. Built in 1889 by local contractor-builders Detwiler and Bedford, this distinctive 2½-story home is recognized as one of the city’s best examples of the attic balcony gable subtype of the Stick Style. Rich in character and architectural detail, the home features a hip and gabled roof, decorative trussed attic balconies supported by large ornamental brackets, wide bracketed overhanging eaves, and wood clapboard siding enhanced by decorative horizontal board patterns. Listed on the National Register of Historic Places in 1993, the property offers 2,970 finished square feet PLUS 550 square feet of unfinished space in the attic, giving a rare opportunity for the next owner to personalize and complete additional living area while honoring the home’s historic charm. Set on an impressive . 6-acre lot, the home offers even more outside space than anything found nearby. There may also be opportunities to explore grants or incentives available for historic properties, adding even more potential to this one-of-a-kind home!
Key facts
- 0.59 acre lot
- Built 1895
- Listed 29 days
Neighborhood map
What this means for you Summary
Snapshot
- This is a 6-bed/1.0-bath single-family listed at $315k.
Deal economics
- At list price, monthly cash flow is $211 ($3k/yr) — positive.
- The deal already cash-flows at list — no discount required.
- To meet the 1% rule (rent ≥ 1% of price), the offer needs to be $296k (6.1% below list).
- Recommended offer: $296k (6.1% below list) — sets the bar for 1% rule.
- Cap rate 7.1% vs local median 3.1% in Des Moines — top-decile yield for the area; either an underpriced asset or a hidden risk that comps aren't pricing in. Stress-test before assuming the spread holds.
Location & tenants
- Location reads 81/100 on livability (#63 in IA, #1,432 nationally) — a professional / high-income tenant draw. Strengths: commute A+, cost of living A+, housing A+; Watch: employment C-, crime F.
- Des Moines Independent Community School District (urban): math 43% / reading 46% proficiency, ranked #289 of 289 in IA (top 100%) — families likely to look elsewhere, expect single-tenant / working-renter base with shorter leases; 63% free/reduced lunch — lower-income household profile, screen leases tightly.
- Zoned schools: Moulton Elementary School (math 31% / reading 21%, grade F, #612 of 616 statewide, top 99%, 420 students, 95% FRL); Harding Middle School (math 31% / reading 30%, grade F, #245 of 246 statewide, top 100%, 655 students, 90% FRL); North High School (math 33% / reading 45%, grade F, #326 of 336 statewide, top 97%, 1,458 students, 87% FRL) — zoned schools average 90% FRL vs 63% district-wide (28 pts higher); higher-poverty schools than district average — tighter screening recommended.
- Zoned-school proficiency averages 32% at this address vs 44% district-wide (-13 pts) — the specific schools serving this property underperform the Des Moines Independent Community School District average; the district grade overstates school quality for this exact location.
- Market conditions: Rents rising fast (+8.2%/yr); 64 active listings in the ZIP; 3 comparable units currently listed for rent nearby; rentals lingering (median 45d on market — plan ~5-8 weeks vacancy on turnover, expect pricing pressure); 67% of comp listings sitting > 30 days — soft ceiling on asking rent; lower-income renter base — watch delinquency; 2,953 units permitted in Polk County in 2024 (540 in 5+ unit buildings).
- At $2,958/mo this rent would consume 89% of the median local household income ($40k/yr) (locally 903% of renters already pay >50% of income on rent) — very limited rent-growth headroom before tenants either downsize or default.
Forward outlook
- In year one you build about $34k of equity ($2k loan paydown + $32k appreciation (10.0% local appreciation)).
- Polk County population projected at +37% by 2050 — long-run rental-demand tailwind backs the buy-and-hold thesis.
- At projected returns (10.0% appreciation + 8.0% rent growth), your $88k cash investment doubles in ~3 years — after that, you're playing with house money.
- By year 2, paydown + projected appreciation supports a ~$54k cash-out refi (75% LTV) — recoverable capital for the next deal without selling this one.
Negotiation context
- It's been on market 29 days — a 2% lower offer ($310k) is reasonable based on typical stale-listing flexibility.
Risks & watch-outs
- Watch-outs: built in 1895 — expect roof / HVAC / electrical / plumbing capex.
Questions for the listing agent
- Built in 1895 — when were the roof, HVAC, electrical panel, plumbing, and water heater last replaced?
- Is there a deadline driving the sale (1031 exchange, divorce, estate, relocation)? That informs how much negotiation room exists.
- Schools are D-rated, which usually means shorter tenancies and higher turnover. Who's the typical renter profile here, and what's been the actual vacancy rate?
- Crime grade is F in this area — have there been break-ins, vandalism, or insurance claims at this property in the last 3 years? What carrier currently insures it and at what premium?
- What's the average days-on-market for RENTAL listings here right now (not sales)? A rising rental-DOM trend means longer vacancies and softer asking-rent achievability than the comps imply.
- What's the recent tenant-quality profile in this submarket — average credit score on applications, eviction rate, late-payment / NSF rate, and stable-employment percentage? A property-management company in the area should have these aggregated.
- How much new for-sale + rental construction is in the pipeline within 1–3 miles? Heavy new supply typically softens prices + rents 12–24 months out; constrained supply supports both.
Investment metrics
- 1% rule
- 0.94% ✗
- Cap rate
- 7.10%
- Cash-on-cash
- 2.88%
- DSCR
- 1.13
- GRM
- 8.9
CMA / ARV
- ARV (median comp)
- $239,914
- List price
- $315,000
- Delta
- 31.30%
- Verdict
- OVERPRICED
- Comps
- 18 within 1.0 mi
Show comp detail 3 sales within ~0.75 mi
| Address | Dist | Beds/Ba | Sqft | Sold | Price | $/sf | Match |
|---|---|---|---|---|---|---|---|
| 1423 7th St | 0.22mi | 5/2.0 (-1) | 3,170 (+7%) | 12mo | $55,000 | $17 | 60 |
| 1717 10th St | 0.30mi | 5/1.5 (-1) | 3,307 (+11%) | 9mo | $130,000 | $39 | 53 |
| 1910 7th St | 0.48mi | 5/2.0 (-1) | 2,612 (-12%) | 8mo | $123,900 | $47 | 42 |
Match score weights: distance 35% · size 25% · config 20% · recency 20%. Top-matched comps best support the ARV.
Projected returns pro-forma
10.0% appreciation · 8.0% rent growth · sell at horizon
- IRR
- 28.2%
- Equity multiple
- 3.28×
- Total profit
- $200,669
- Equity at exit
- $283,777
- IRR
- 26.0%
- Equity multiple
- 8.02×
- Total profit
- $619,107
- Equity at exit
- $611,976
Cash invested: $88,200 (down + closing). Projections, not guarantees.
Landlord ↔ Tenant lean methodology
- Overall (STATE)
- 83 Strongly Landlord-Friendly
- State Iowa
- 83 Strongly Landlord-Friendly · R+6
- County
- — inherits STATE
- City
- — inherits STATE
ZIP-level market 50314
- Home prices YoY
- 9.8%
- Rents YoY
- 8.2%
- Active inventory
- 64
- Price-to-rent
- 8.9×
Monthly cashflow live
- Estimated rent
- $2,958 medium interval (Pro) →
- Mortgage (P&I)
- −$1,652
- Tax from tax record
- −$342 /mo · $4,110/yr
- Insurance
- −$131
- HOA
- −$0
- Vacancy / Maint / Mgmt
- −$621
- Net cashflow
- $211
Break-even live
Sensitivity live
| Price | -10% $390 | -5% $301 | +0% $211 | +5% $122 | +10% $33 |
|---|---|---|---|---|---|
| Rent | -10% $-22 | -5% $95 | +0% $211 | +5% $328 | +10% $445 |
| Rate | -1.0pp $370 | -0.5pp $292 | base $211 | +0.5pp $130 | +1.0pp $47 |
UW: 25.0% down · 7.5% · 30yr · 1.5% tax · 5.0% vac · 8.0% maint · 8.0% mgmt
Financing live
Cash to close
- Down payment
- $78,750
- Closing costs
- $9,450
- Reserves months
- —
- Total cash needed
- —
Loan-product check · same deal, 3 products live
Conventional
25% down · 7.5% · 30yr
- Down + closing
- —
- Monthly P&I
- —
- Monthly cashflow
- —
- DSCR
- —
- Eligible?
- —
Personal DTI + credit; lowest rate.
DSCR
20% down · 8.5% · 30yr
- Down + closing
- —
- Monthly P&I
- —
- Monthly cashflow
- —
- DSCR
- —
- Eligible?
- —
No personal income docs; deal must DSCR.
Hard money
10% down · 12.0% · 12mo
- Down + closing
- —
- Monthly P&I
- —
- Monthly cashflow
- —
- DSCR
- —
- Eligible?
- —
Short-term bridge; refi at stabilization.
Rent comps 3 comps
| Address | Beds | Baths | Sqft | Rent | $/sqft | DOM | Units | Dist |
|---|---|---|---|---|---|---|---|---|
| 669 17th St Unit 667 Des Moines, IA | 6.0 | 3.5 | 3300 | $4,200 | $1.27 | 45d | 1 | 1.25mi |
| 663 17th St Unit 667 Des Moines, IA | 6.0 | 4.0 | 3300 | $3,800 | $1.15 | 20d | 1 | 1.26mi |
| 1087 28th St Des Moines, IA | 5.0 | 2.0 | 2104 | $2,300 | $1.09 | 45d | 1 | 1.33mi |
Listing history 2 events
-
2026-05-16status Pending 1160-char remark
Show marketing remark (1160 chars)
Nows yours chance to own an incredible piece of Des Moines history with the Rev. R. W. and Fannie E. Keeler House. Built in 1889 by local contractor-builders Detwiler and Bedford, this distinctive 2½-story home is recognized as one of the city’s best examples of the attic balcony gable subtype of the Stick Style. Rich in character and architectural detail, the home features a hip and gabled roof, decorative trussed attic balconies supported by large ornamental brackets, wide bracketed overhanging eaves, and wood clapboard siding enhanced by decorative horizontal board patterns. Listed on the National Register of Historic Places in 1993, the property offers 2,970 finished square feet PLUS 550 square feet of unfinished space in the attic, giving a rare opportunity for the next owner to personalize and complete additional living area while honoring the home’s historic charm. Set on an impressive . 6-acre lot, the home offers even more outside space than anything found nearby. There may also be opportunities to explore grants or incentives available for historic properties, adding even more potential to this one-of-a-kind home!
-
2026-04-17$315,000 Active 1160-char remark
Show marketing remark (1160 chars)
Nows yours chance to own an incredible piece of Des Moines history with the Rev. R. W. and Fannie E. Keeler House. Built in 1889 by local contractor-builders Detwiler and Bedford, this distinctive 2½-story home is recognized as one of the city’s best examples of the attic balcony gable subtype of the Stick Style. Rich in character and architectural detail, the home features a hip and gabled roof, decorative trussed attic balconies supported by large ornamental brackets, wide bracketed overhanging eaves, and wood clapboard siding enhanced by decorative horizontal board patterns. Listed on the National Register of Historic Places in 1993, the property offers 2,970 finished square feet PLUS 550 square feet of unfinished space in the attic, giving a rare opportunity for the next owner to personalize and complete additional living area while honoring the home’s historic charm. Set on an impressive . 6-acre lot, the home offers even more outside space than anything found nearby. There may also be opportunities to explore grants or incentives available for historic properties, adding even more potential to this one-of-a-kind home!
ⓘ Source: listings_history table (triggers on properties + properties_extension) + one-shot
backfill from property_details.listing_events for pre-trigger history.
Tax reassessment forecast IA · Partial reset (capped growth)
- Current annual tax
- $4,110 · $342/mo
- Projected year-2 tax
- $4,528 · $377/mo
- Expected delta
- +$418/yr (+$35/mo · 10.2%)
ⓘ Screening estimate from a state-policy table — verify with the county assessor before closing.
Climate risk First Street
- Flood 1/10 Low FEMA zone X (unshaded) · 0% chance over 30 yrs
- Wildfire 1/10 Low
- Heat 3/10 Moderate 7 d/yr ≥103°F today · 15 d/yr by 30 yrs out
- Wind 2/10 Low
- Air quality 2/10 Low 1 unhealthy d/yr today · 2 by 30 yrs out
Nearby sold comps map
Loading sold comps map…
Walkable amenities ~0.75 mi
Loading nearby amenities…
Taxation est. · year 1
- Rental income
- $35,500
- − Mortgage interest
- −$17,645
- − Property taxes
- −$4,110
- − Insurance
- −$1,575
- − Repairs & maintenance
- −$2,840
- − Management
- −$2,840
- − Depreciation
- −$9,164
- Taxable loss
- −$2,674
- Est. tax savings @ 24.0%
- +$642
- After-tax cash flow
- $3,179/yr
For passive investors: Depreciation is non-cash, so a rental often shows a tax loss while cash-flowing — sheltering income. Rental losses are passive: they offset passive income freely, and up to $25,000/yr can offset ordinary (W-2) income if you actively participate and your MAGI is under $100k (phasing out to $0 by $150k); unused losses carry forward. On sale, claimed depreciation is recaptured at up to 25%, and gains may owe capital-gains tax (a 1031 exchange can defer both). Figures are a year-1 estimate at your 24.0% rate — not tax advice; consult a CPA.
Schools (NCES district)
- District
- Des Moines Independent Community School District
- NCES district ID
- 1908970
- Math proficiency
- 43% ▼ -6.00%
- Reading proficiency
- 46% ▼ -1.00%
- Median HH income
- $45,905
- Composite
- 37.83/100
- National rank
- #4331
- State rank
- #289 of 289 in IA
Livability — Des Moines
- Score
- 81/100
- State rank
- #63
- US rank
- #1432
Category grades
Schools grade is shown separately in the Schools card above.
Census & demographics
- Census place
- Des Moines, IA
- County
- Polk County · 453,298 people
- City population
- 203,612
- Metro
- Des Moines-West Des Moines, IA
- Population (ZIP)
- 10,438
- Household income
- $39,950
- Rent vs Own
- Severe rent burden
- 903.0
Population outlook (Polk County) Hauer SSP2
- Today (2025)
- 548,042 people
- By 2030
- 588,557 · +7.4%
- By 2040
- 670,629 · +22.4%
- By 2050
- 752,830 · +37.4%
- By 2075
- 955,069 · +74.3%
- By 2100
- 1,115,436 · +103.5%
Race, ethnicity, and origin ACS 2023
- Neighborhood character
- Highly diverse neighborhood (Simpson 0.73)
- Race & ethnicity
- Black 37% White 29% Hispanic / Latino 20% Asian 12% Two or more races 10%
- Hispanic origin (detail)
- Mexican 13%
- Common ancestry
- Ukrainian 6% Iranian 2% Swiss 1%
- Foreign-born
- 26% · Canada, Vietnam, Philippines
- Languages at home
- 60% English-only · Spanish 16% Vietnamese 6% Other Asian/Pacific 4%
Political lean MEDSL · Polk
- 2024 margin
- D (+10.9) · D 54.8% · R 43.9% · Other 1.3%
- 2008→2024 swing
- -3.7pp toward R · 2008: 14.6pp · 2024: 10.9pp
- All cycles
- 2024: D+10.9 2020: D+15.2 2016: D+11.5 2012: D+14.2 2008: D+14.6
Not yet ingested
- Civics
- —
Market trends
- HPI YoY
- ▲ 30.18%
- Current HPI
- 338.8301
- Rent YoY
- ▲ 8.17%
- Metro
- Des Moines-West Des Moines, IA
- State GDP YoY
- ▲ 2.48%
- F500 in state
- 4
Industry mix (Fortune 500 HQ in IA)
| Industry | F500 HQs | Revenue |
|---|---|---|
| Financial Services | 1 | $16B |
|
||
| Retail / Convenience | 1 | $15B |
|
||
Price history
2 events — show timeline
- 2026-05-16 Pending — DMMLS
- 2026-04-17 Listed $315,000 DMMLS
Property tax history
+2.2%/yrLatest (2025): $4,110 · +2.1% YoY. Source: county tax records.
Cash-flow waterfall
monthlySold comps — $/sqft
last 12 mo · ≤1 miLoading sold comps…