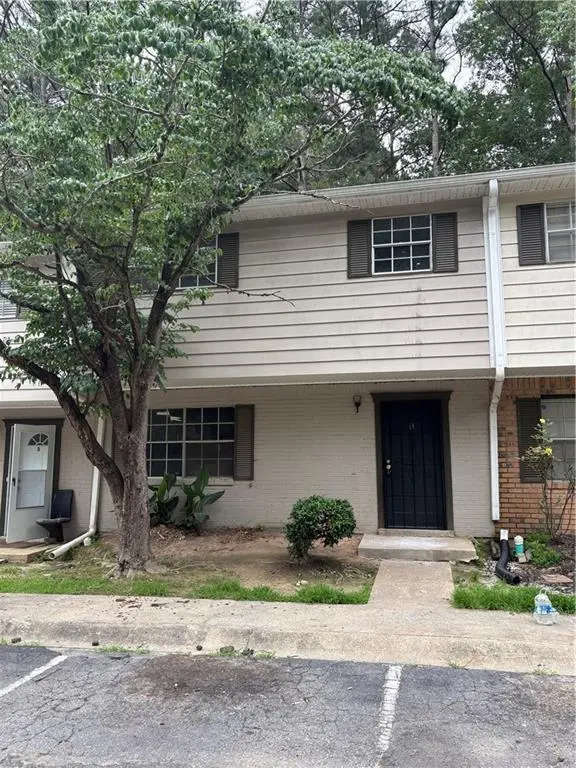
4701 Flat Shoals Rd Unit 59E · Union City, GA
Flood risk 1/10 · Minimal
- FEMA flood zone
- X (unshaded)
- Chance of flooding over 30 yrs
- 0.0%
- Est. flood insurance / yr
- $507 – $1,088
Fire risk 3/10 · Minor
- Est. fire insurance / yr
- $963 – $1,789
Heat risk 6/10 · Moderate
- Hot days now (above 104°F)
- 7 days/yr
- Hot days in 30 yrs
- 20 days/yr
Wind risk 6/10 · Moderate
- Chance of severe wind over 30 yrs
- 27.0%
Air-quality risk 4/10 · Minor
- Unhealthy air days now
- 4 days/yr
- Unhealthy air days in 30 yrs
- 6 days/yr
Risk factors via First Street. Map © Google.
Why this score? — see what drove the A- grade
The composite is a weighted blend of 9 inputs, each scored 0–100. Each bar is that input's sub-score; the figure is the points it added to the 100-point composite (weight × sub-score).
- Cash flow +30.0/30.0
- 1% rule +10.0/10.0
- DSCR +10.0/10.0
- Appreciation +10.0/10.0
- ARV discount +7.5/15.0
- Schools +4.5/10.0
- Rent growth +3.1/5.0
- Livability +2.9/5.0
- Condition / age +2.5/5.0
$54,900
🖨 Deal sheet 📄 Offer letter ✓ Due diligence
Listing remarks
Investors wanted. This home has been cleaned out and ready for a complete rehab. Make your offer today! Perfect for fix & flip investors looking to increase the value. It could be a nice addition to a buy- & -hold portfolio. Sold As-Is. NO BLIND OFFERS. Must use seller’s closing attorney (Perrie & Associates, LLC)
Key facts
- $330 HOA
- Built 1972
- Listed 10 days
Property features AI
Finance
- HOA & community: Association fee $330 monthly; Part of a community with approximately 200 units
Exterior
- Parking: Parking lot
- Utilities: Public water available; Septic tank; 110-volt electric service; Cable available; Electricity available; Sewer available; Water available
- Home design: One and one half levels; Fee simple ownership
- Construction: Brick construction; Composition roof; Slab foundation; Property condition noted as fixer
- Exterior features: Road frontage on a city street; Asphalt road surface
Interior
- Kitchen: Kitchen features: Other; Separate dining room
- Bedrooms: Three main level bedrooms; Bedroom features: None listed
- Flooring: Other flooring
- Bathrooms: Two full bathrooms (both on the main level); Master bathroom: None listed
- Heating & cooling: Central heating; Ceiling fan(s) for cooling
- Interior features: No shared/common walls; Other interior features
- Laundry & utility: Laundry located in the kitchen; Appliances: Other
Neighborhood map
What this means for you Summary
Snapshot
- This is a 3-bed/2.5-bath townhouse listed at $55k.
Deal economics
- At list price, monthly cash flow is $730 ($9k/yr) — positive.
- The deal already cash-flows at list — no discount required.
- Meets the 1% rule at list price ($2k rent vs $55k).
- Cap rate 22.3% vs local median 5.4% in Union City — top-decile yield for the area; either an underpriced asset or a hidden risk that comps aren't pricing in. Stress-test before assuming the spread holds.
Location & tenants
- Location reads 58/100 on livability (#443 in GA) — a working-class tenant base; expect higher turnover. Strengths: cost of living A+, housing A+; Watch: crime D+, schools F, amenities F.
- Fulton County (suburban): math 49% / reading 53% proficiency, ranked #12 of 174 in GA (top 7%) — acceptable for families but not a draw, mixed tenant base, ~2y average lease.
- Market conditions: Rents rising (+2.2%/yr); 167 active listings in the ZIP; 36 comparable units currently listed for rent nearby; rentals at typical pace (median 24d on market — plan ~3-4 weeks tenant-placement turnaround); 44% of comp listings sitting > 30 days — soft ceiling on asking rent; 11,565 units permitted in Fulton County in 2024 (8,159 in 5+ unit buildings).
- At $1,860/mo this rent would consume 46% of the median local household income ($48k/yr) (locally 1778% of renters already pay >50% of income on rent) — very limited rent-growth headroom before tenants either downsize or default.
Forward outlook
- In year one you build about $6k of equity ($380 loan paydown + $5k appreciation (10.0% local appreciation)).
- Fulton County population projected at +38% by 2050 — long-run rental-demand tailwind backs the buy-and-hold thesis.
- At projected returns (10.0% appreciation + 2.2% rent growth), your $15k cash investment doubles in ~2 years — after that, you're playing with house money.
- By year 6, paydown + projected appreciation supports a ~$35k cash-out refi (75% LTV) — recoverable capital for the next deal without selling this one.
Negotiation context
- Only 10 days on market — expect competitive offers; lowballing is unlikely to land.
- Current owner paid $37k; 48% above their basis — modest negotiation headroom, anchor on the comps not their cost.
Risks & watch-outs
- Climate carrying-cost: major wind risk, 27% chance of damaging wind over 30y; extreme-heat days projected 7→20/yr by 2055 (HVAC capex compounding) — expect insurance premiums to compound above CPI over the hold.
Questions for the listing agent
- Built in 1972 — when were the roof, HVAC, electrical panel, plumbing, and water heater last replaced?
- What does the HOA fee cover, when was the last increase, and are there any pending special assessments or reserve-fund shortfalls?
- Is there a deadline driving the sale (1031 exchange, divorce, estate, relocation)? That informs how much negotiation room exists.
- Schools are F-rated, which usually means shorter tenancies and higher turnover. Who's the typical renter profile here, and what's been the actual vacancy rate?
- Crime grade is D in this area — have there been break-ins, vandalism, or insurance claims at this property in the last 3 years? What carrier currently insures it and at what premium?
- What's the average days-on-market for RENTAL listings here right now (not sales)? A rising rental-DOM trend means longer vacancies and softer asking-rent achievability than the comps imply.
- What's the recent tenant-quality profile in this submarket — average credit score on applications, eviction rate, late-payment / NSF rate, and stable-employment percentage? A property-management company in the area should have these aggregated.
- How much new for-sale + rental construction is in the pipeline within 1–3 miles? Heavy new supply typically softens prices + rents 12–24 months out; constrained supply supports both.
Investment metrics
- 1% rule
- 3.39% ✓
- Cap rate
- 22.25%
- Cash-on-cash
- 57.00%
- DSCR
- 3.54
- GRM
- 2.5
CMA / ARV
- ARV (on-the-fly)
- $136,680
- Comps found
- 12
Show comp detail 12 sales within ~0.75 mi
| Address | Dist | Beds/Ba | Sqft | Sold | Price | $/sf | Match |
|---|---|---|---|---|---|---|---|
| 4701 Flat Shoals Rd Unit 62H | 0.00mi | 3/2.5 | 1,340 (0%) | 1mo | $87,080 | $65 | 100 |
| 4701 Flat Shoals Rd Unit 50H | 0.00mi | 3/2.5 | 1,340 (0%) | 2mo | $52,900 | $39 | 99 |
| 4701 Flat Shoals Rd Unit 54B | 0.00mi | 3/2.5 | 1,340 (0%) | 3mo | $60,000 | $45 | 97 |
| 4701 Flat Shoals Rd Unit 56E | 0.00mi | 3/2.5 | 1,340 (0%) | 23mo | $79,900 | $60 | 80 |
| 4701 Flat Shoals Rd Unit 48H | 0.00mi | 3/2.5 | 1,300 (-3%) | 22mo | $132,000 | $102 | 77 |
| 8330 Oakley Cir | 0.39mi | 3/2.5 | 1,436 (+7%) | 1mo | $170,000 | $118 | 69 |
| 6406 Abercorn St | 0.26mi | 2/2.5 (-1) | 1,280 (-4%) | 15mo | $130,000 | $102 | 63 |
| 5070 Oakley Commons Blvd | 0.66mi | 3/2.5 | 1,350 (+1%) | 8mo | $195,000 | $144 | 62 |
| 6354 Shannon Pkwy Unit 32C | 0.35mi | 3/2.5 | 1,536 (+15%) | 4mo | $57,000 | $37 | 56 |
| 7150 Oakley Ct #80 | 0.56mi | 3/2.5 | 1,350 (+1%) | 22mo | $225,000 | $167 | 55 |
| 8195 Oakley Cir | 0.46mi | 3/2.5 | 1,272 (-5%) | 20mo | $223,199 | $175 | 54 |
| 6354 Shannon Pkwy Unit 32F | 0.35mi | 3/2.5 | 1,536 (+15%) | 16mo | $149,000 | $97 | 46 |
Match score weights: distance 35% · size 25% · config 20% · recency 20%. Top-matched comps best support the ARV.
Projected returns pro-forma
10.0% appreciation · 2.2% rent growth · sell at horizon
- IRR
- 68.9%
- Equity multiple
- 5.89×
- Total profit
- $75,165
- Equity at exit
- $49,458
- IRR
- 62.2%
- Equity multiple
- 12.86×
- Total profit
- $182,359
- Equity at exit
- $106,659
Cash invested: $15,372 (down + closing). Projections, not guarantees.
Landlord ↔ Tenant lean methodology
- Overall (STATE)
- 90 Strongly Landlord-Friendly
- State Georgia
- 90 Strongly Landlord-Friendly · R+3
- County
- — inherits STATE
- City
- — inherits STATE
ZIP-level market 30291
- Home prices YoY
- 11.1%
- Rents YoY
- 2.2%
- Active inventory
- 167
- Price-to-rent
- 2.5×
Monthly cashflow live
- Estimated rent
- $1,860 high interval (Pro) →
- Mortgage (P&I)
- −$288
- Tax from tax record
- −$99 /mo · $1,185/yr
- Insurance
- −$23
- HOA
- −$330
- Vacancy / Maint / Mgmt
- −$391
- Net cashflow
- $730
Break-even live
UW: 25.0% down · 7.5% · 30yr · 1.5% tax · 5.0% vac · 8.0% maint · 8.0% mgmt
Financing live
Cash to close
- Down payment
- $13,725
- Closing costs
- $1,647
- Reserves months
- —
- Total cash needed
- —
Loan-product check · same deal, 3 products live
Conventional
25% down · 7.5% · 30yr
- Down + closing
- —
- Monthly P&I
- —
- Monthly cashflow
- —
- DSCR
- —
- Eligible?
- —
Personal DTI + credit; lowest rate.
DSCR
20% down · 8.5% · 30yr
- Down + closing
- —
- Monthly P&I
- —
- Monthly cashflow
- —
- DSCR
- —
- Eligible?
- —
No personal income docs; deal must DSCR.
Hard money
10% down · 12.0% · 12mo
- Down + closing
- —
- Monthly P&I
- —
- Monthly cashflow
- —
- DSCR
- —
- Eligible?
- —
Short-term bridge; refi at stabilization.
Rent comps 36 comps
| Address | Beds | Baths | Sqft | Rent | $/sqft | DOM | Units | Dist |
|---|---|---|---|---|---|---|---|---|
| 4701 Flat Shoals Rd Union City, GA | 3.0 | 2.5–3.0 | 1600 | $1,775 | $1.11 | 2d | 1 | 0.15mi |
| 6340 Westbrook Ave Union City, GA | 3.0 | 2.0 | 1800 | $2,100 | $1.17 | 43d | 1 | 0.40mi |
| 4483 Flat Shoals Rd Union City, GA | 1.0–2.0 | 1.0–2.5 | 957 | $1,495 | $1.56 | 43d | 1 | 0.47mi |
| 5400 Oakley Commons Blvd Union City, GA | 2.0 | 2.0 | 1258 | $1,257 | $1.00 | 43d | 1 | 0.47mi |
| 4500 Shannon Blvd Unit 7 Union City, GA | 3.0 | 2.5 | 1503 | $1,750 | $1.16 | 4d | 1 | 0.54mi |
| 5201 Summer Brooke Ct Union City, GA | 3.0 | 2.5 | 1484 | $2,000 | $1.35 | 1d | 1 | 0.58mi |
| 5150 Oakley Commons Blvd Union City, GA | 3.0 | 2.5 | 1375 | $1,675 | $1.22 | 24d | 1 | 0.65mi |
| 6085 Mallory Rdg #32 Union City, GA | 3.0 | 3.5 | 1540 | $2,300 | $1.49 | 43d | 1 | 0.71mi |
| 3285 Oakley Pl Union City, GA | 3.0 | 2.5 | 1350 | $1,500 | $1.11 | 43d | 1 | 0.74mi |
| 6425 Oakley Rd Union City, GA | 1.0–3.0 | 1.0–2.0 | 1037 | $1,502 | $1.45 | 4d | 18 | 0.76mi |
| 6120 Longino Dr Union City, GA | 4.0 | 2.0 | 1608 | $1,835 | $1.14 | 12d | 1 | 0.76mi |
| 5205 Alexander St Union City, GA | 3.0 | 2.0 | 1326 | $1,681 | $1.27 | 43d | 1 | 0.77mi |
| 5200 Alexander St Union City, GA | 3.0 | 2.0 | 1221 | $1,695 | $1.39 | 43d | 1 | 0.79mi |
| 5207 Dixie Lake Rd Union City, GA | 3.0 | 2.0 | 1516 | $1,950 | $1.29 | 43d | 1 | 0.81mi |
| 6350 Oakley Rd Union City, GA | 3.0 | 2.0–2.5 | 1472 | $1,796 | $1.22 | 1d | 4 | 0.81mi |
| 4312 Smithgall Ct Union City, GA | 3.0 | 2.5 | 1433 | $2,000 | $1.40 | 18d | 1 | 0.82mi |
| 5140 Highpoint Rd Apt 27 Union City, GA | 2.0 | 2.5 | 1290 | $1,295 | $1.00 | 12d | 1 | 0.93mi |
| 6325 Raymond Ter Union City, GA | 2.0 | 1.0 | 1624 | $1,150 | $0.71 | 43d | 1 | 0.99mi |
| 5950 Stonewall Dr Unit 4 Union City, GA | 3.0 | 1.0 | 1320 | $1,445 | $1.09 | 2d | 1 | 1.01mi |
| 5950 Stonewall Dr Unit 2 Union City, GA | 3.0 | 1.5 | 1320 | $1,495 | $1.13 | 15d | 1 | 1.01mi |
| 6596 Woodwell Dr Union City, GA | 3.0 | 2.5 | 1804 | $2,215 | $1.23 | 12d | 1 | 1.04mi |
| 6150 Mallory Rd Atlanta, GA | 3.0 | 2.0 | 1681 | $1,695 | $1.01 | 11d | 1 | 1.09mi |
| 3791 Shenfield Dr Union City, GA | 3.0 | 2.5 | 1784 | $2,086 | $1.17 | 10d | 1 | 1.10mi |
| 5058 Jonesboro Rd Union City, GA | 2.0 | 1.0–1.5 | 997 | $1,395 | $1.40 | 20d | 1 | 1.13mi |
| 5058 Jonesboro Rd Unit E37 Union City, GA | 2.0 | 1.5 | 997 | $1,395 | $1.40 | 4d | 1 | 1.13mi |
| 6115 Forrest Ave Union City, GA | 4.0 | 2.0 | 1368 | $1,690 | $1.24 | 43d | 1 | 1.20mi |
| 4128 Flat Trl Union City, GA | 3.0 | 2.5 | 1450 | $1,700 | $1.17 | 43d | 1 | 1.20mi |
| 3855 Shenfield Dr Union City, GA | 3.0 | 2.5 | 1626 | $1,895 | $1.17 | 43d | 1 | 1.29mi |
| 3859 Shenfield Dr Union City, GA | 4.0 | 2.5 | 1850 | $2,000 | $1.08 | 5d | 1 | 1.30mi |
| 6225 Shenfield Ln Union City, GA | 3.0 | 2.5 | 1821 | $2,000 | $1.10 | 43d | 1 | 1.34mi |
| 4014 Carisbrook Dr Union City, GA | 4.0 | 2.5 | 1795 | $2,295 | $1.28 | 22d | 1 | 1.34mi |
| 4014 Carisbrook Dr Union City, GA | 4.0 | 2.5 | 1795 | $2,195 | $1.22 | 5d | 1 | 1.34mi |
| 4014 Carisbrook Dr Union City, GA | 4.0 | 2.5 | 1795 | $2,295 | $1.28 | 24d | 1 | 1.34mi |
| 7000 Goodson Rd #69 Union City, GA | 3.0 | 2.0 | 960 | $1,400 | $1.46 | 43d | 1 | 1.38mi |
| 5480 Sierra Trl Atlanta, GA | 3.0 | 2.5 | 1400 | $1,845 | $1.32 | 43d | 1 | 1.40mi |
| 5616 Union Pointe Dr Union City, GA | 2.0 | 2.5 | 1387 | $1,545 | $1.11 | 43d | 1 | 1.46mi |
HOA detail
- Monthly dues
- $330 · $3,960/yr
Listing history 8 events
-
2026-06-18status $54,900 Pending 10 DOM
-
2026-06-18days on market $54,900 Active 10 DOM
-
2026-06-17days on market $54,900 Active 9 DOM
-
2026-06-16days on market $54,900 Active 8 DOM
-
2026-06-15days on market $54,900 Active 7 DOM
-
2026-06-13days on market $54,900 Active 5 DOM
-
2026-06-08remarks 319-char remark
-
2026-06-08$54,900 Active 1 DOM
ⓘ Source: listings_history table (triggers on properties + properties_extension) + one-shot
backfill from property_details.listing_events for pre-trigger history.
Tax reassessment forecast GA · Resets to sale price
- Current annual tax
- $1,185 · $99/mo
- Projected year-2 tax
- $1,185 · $99/mo
- Expected delta
- $0/yr ($0/mo · 0.0%)
ⓘ Screening estimate from a state-policy table — verify with the county assessor before closing.
Climate risk First Street
- Flood 1/10 Low FEMA zone X (unshaded) · 0% chance over 30 yrs
- Wildfire 3/10 Moderate
- Heat 6/10 Major 7 d/yr ≥104°F today · 20 d/yr by 30 yrs out
- Wind 6/10 Major 27% chance of damaging wind over 30 yrs
- Air quality 4/10 Moderate 4 unhealthy d/yr today · 6 by 30 yrs out
Nearby sold comps map
Loading sold comps map…
Walkable amenities ~0.75 mi
Loading nearby amenities…
Taxation est. · year 1
- Rental income
- $22,324
- − Mortgage interest
- −$3,075
- − Property taxes
- −$1,185
- − Insurance
- −$274
- − Repairs & maintenance
- −$1,786
- − Management
- −$1,786
- − HOA
- −$3,960
- − Depreciation
- −$1,597
- Taxable income
- $8,660
- Est. tax owed @ 24.0%
- −$2,078
- After-tax cash flow
- $6,683/yr
For passive investors: Depreciation is non-cash, so a rental often shows a tax loss while cash-flowing — sheltering income. Rental losses are passive: they offset passive income freely, and up to $25,000/yr can offset ordinary (W-2) income if you actively participate and your MAGI is under $100k (phasing out to $0 by $150k); unused losses carry forward. On sale, claimed depreciation is recaptured at up to 25%, and gains may owe capital-gains tax (a 1031 exchange can defer both). Figures are a year-1 estimate at your 24.0% rate — not tax advice; consult a CPA.
Schools (NCES district)
- District
- Fulton County
- NCES district ID
- 1302280
- Math proficiency
- 49% ▼ -2.00%
- Reading proficiency
- 53% ▬ 0.00%
- Median HH income
- $68,035
- Composite
- 45.33/100
- National rank
- #2640
- State rank
- #12 of 174 in GA
Livability — Union City
- Score
- 58/100
- State rank
- #443
- US rank
- #21281
Category grades
Schools grade is shown separately in the Schools card above.
Census & demographics
- Census place
- Union City, GA
- County
- Fulton County · 1,094,430 people
- City population
- 25,130
- Metro
- Atlanta-Sandy Springs-Alpharetta, GA
- Population (ZIP)
- 25,130
- Household income
- $48,184
- Rent vs Own
- Severe rent burden
- 1778.0
Population outlook (Fulton County) Hauer SSP2
- Today (2025)
- 1,203,707 people
- By 2030
- 1,299,706 · +8.0%
- By 2040
- 1,488,256 · +23.6%
- By 2050
- 1,664,580 · +38.3%
- By 2075
- 2,036,072 · +69.2%
- By 2100
- 2,222,402 · +84.6%
Race, ethnicity, and origin ACS 2023
- Neighborhood character
- Predominantly Black (86%)
- Race & ethnicity
- Black 86% Hispanic / Latino 7% Two or more races 6% White 3%
- Hispanic origin (detail)
- Mexican 4%
- Common ancestry
- Italian 1%
- Foreign-born
- 5% · Canada
- Languages at home
- 92% English-only · Spanish 6%
Political lean MEDSL · Fulton
- 2024 margin
- Solid D (+44.9) · D 71.9% · R 27.0% · Other 1.1%
- 2008→2024 swing
- +9.8pp toward D · 2008: 35.0pp · 2024: 44.9pp
- All cycles
- 2024: D+44.9 2020: D+46.4 2016: D+42.1 2012: D+29.6 2008: D+35.0
Not yet ingested
- Civics
- —
Market trends
- HPI YoY
- ▲ 23.98%
- Current HPI
- 239.3471
- Rent YoY
- ▲ 2.20%
- Metro
- Atlanta-Sandy Springs-Alpharetta, GA
- State GDP YoY
- ▲ 2.66%
- F500 in state
- 28
Industry mix (Fortune 500 HQ in GA)
| Industry | F500 HQs | Revenue |
|---|---|---|
| Paper / Packaging | 2 | $29B |
|
||
| Retail | 1 | $160B |
|
||
| Transportation / Logistics | 1 | $91B |
|
||
| Airlines | 1 | $62B |
|
||
| Consumer Goods | 1 | $47B |
|
||
| Utilities | 1 | $25B |
|
||
Price history
+37.6% since first listed4 events — show timeline
- 2026-06-08 Listed $54,900 FMLS
- 2019-12-13 Sold (Public Records) $37,000 Public Records
- 2017-01-04 Sold (Public Records) $40,000 Public Records
- 1990-03-10 Sold (Public Records) $39,900 Public Records
Property tax history
+5.5%/yrLatest (2025): $1,185 · +22.1% YoY. Source: county tax records.
Cash-flow waterfall
monthlySold comps — $/sqft
last 12 mo · ≤1 miLoading sold comps…