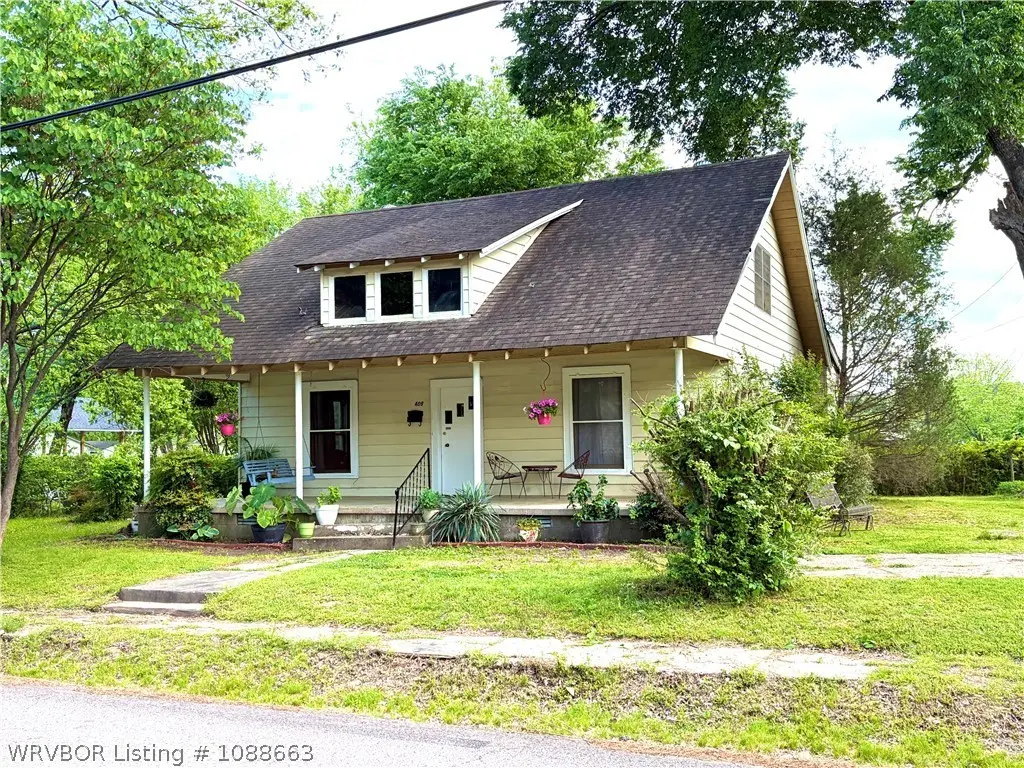
409 NW 1st St · Atkins, AR
Flood risk 1/10 · Minimal
- FEMA flood zone
- X (unshaded)
- Chance of flooding over 30 yrs
- 0.0%
- Est. flood insurance / yr
- $507 – $1,088
Fire risk 3/10 · Minor
- Est. fire insurance / yr
- $1,499 – $2,785
Heat risk 7/10 · Major
- Hot days now (above 113°F)
- 7 days/yr
- Hot days in 30 yrs
- 20 days/yr
Wind risk 2/10 · Minimal
- Chance of severe wind over 30 yrs
- 4.0%
Air-quality risk 1/10 · Minimal
- Unhealthy air days now
- 0 days/yr
- Unhealthy air days in 30 yrs
- 0 days/yr
Risk factors via First Street. Map © Google.
Why this score? — see what drove the C grade
The composite is a weighted blend of 9 inputs, each scored 0–100. Each bar is that input's sub-score; the figure is the points it added to the 100-point composite (weight × sub-score).
- ARV discount +15.0/15.0
- Cash flow +14.4/30.0
- Appreciation +7.9/10.0
- DSCR +4.4/10.0
- 1% rule +4.0/10.0
- Schools +3.2/10.0
- Livability +3.0/5.0
- Rent growth +2.5/5.0
- Condition / age +2.5/5.0
$117,500
🖨 Deal sheet (PDF) 📄 Offer letter ✓ Due diligence
Listing remarks
Charming and full of character, this inviting 4-bedroom, 1-bath home offers the perfect blend of comfort and classic style. Nestled on a spacious lot with mature trees, this home welcomes you with a cozy front porch—ideal for morning coffee or relaxing evenings. Inside, you’ll find a warm and functional layout with plenty of natural light and room for everyone. The four bedrooms provide flexibility for family, guests, or a home office. Thoughtful details throughout give this home a timeless, lived-in charm that’s hard to find. Step outside to enjoy the generous yard, perfect for gardening, entertaining, or simply soaking up the peaceful surroundings. With its inviting curb
Key facts
- Generous yard
- Spacious lot
- Cozy front porch
Tags
Property features AI
Exterior
- Utilities: Public water; Sewer available; Electricity available; Natural gas available
- Home design: Single family residence; Two-story house; Aluminum siding
- Construction: Shingle roof
- Exterior features: Covered patio/porch; Corner lot; Cleared and landscaped yard; Paved public road access
Interior
- Kitchen: Cooktop; Range; Refrigerator; Gas water heater
- Flooring: Laminate flooring; Wood flooring
- Bathrooms: 1 full bathroom
- Heating & cooling: Natural gas heating; Other heating; Electric cooling; Window air conditioning units; Ceiling fans
- Interior features: Ceiling fans; Drapes on windows
- Laundry & utility: Washer hookup; Electric dryer hookup
Neighborhood map
What this means for you Summary
Snapshot
- This is a 4-bed/1.0-bath single-family listed at $118k.
Deal economics
- At list price, monthly cash flow is $24 ($289/yr) — positive.
- The deal already cash-flows at list — no discount required.
- To meet the 1% rule (rent ≥ 1% of price), the offer needs to be $106k (9.9% below list).
- Recommended offer: $106k (9.9% below list) — sets the bar for 1% rule.
Location & tenants
- Location reads 59/100 on livability (#293 in AR) — a working-class tenant base; expect higher turnover. Strengths: cost of living A+, housing B; Watch: amenities F, commute F, employment F.
- Atkins School District (rural): math 39% / reading 37% proficiency, ranked #93 of 238 in AR (top 39%) — families likely to look elsewhere, expect single-tenant / working-renter base with shorter leases.
- Zoned schools: Atkins Elementary School (math 37% / reading 32%, grade F, #254 of 454 statewide, top 59%, 370 students, 70% FRL); Atkins Middle School (math 45% / reading 41%, grade D-, #70 of 201 statewide, top 38%, 291 students, 66% FRL); Atkins High School (math 27% / reading 32%, grade F, #142 of 292 statewide, top 53%, 328 students, 56% FRL).
- Market conditions: 44 active listings in the ZIP; 55 units permitted in Pope County in 2024 (0 in 5+ unit buildings).
Forward outlook
- In year one you build about $8k of equity ($812 loan paydown + $7k appreciation (5.8% local appreciation)).
- Pope County population projected at +9% by 2050 — modest demand growth; plan on rents tracking national, not racing it.
- At projected returns (5.8% appreciation + 3.0% rent growth), your $33k cash investment doubles in ~4 years — after that, you're playing with house money.
- By year 5, paydown + projected appreciation supports a ~$34k cash-out refi (75% LTV) — recoverable capital for the next deal without selling this one.
Negotiation context
- It's been on market 55 days — a 3% lower offer ($114k) is reasonable based on typical stale-listing flexibility.
- Current owner paid $41k; list at $118k implies a 187% gain — meaningful room to come down on a strong offer.
Risks & watch-outs
- Climate carrying-cost: extreme-heat days projected 7→20/yr by 2055 (HVAC capex compounding) — expect insurance premiums to compound above CPI over the hold.
Questions for the listing agent
- It's been on market 55 days. Have you received any prior offers? Is the seller open to a 10% concession, seller financing, or rate buy-down credit?
- Is there a deadline driving the sale (1031 exchange, divorce, estate, relocation)? That informs how much negotiation room exists.
- What's the average days-on-market for RENTAL listings here right now (not sales)? A rising rental-DOM trend means longer vacancies and softer asking-rent achievability than the comps imply.
- What's the recent tenant-quality profile in this submarket — average credit score on applications, eviction rate, late-payment / NSF rate, and stable-employment percentage? A property-management company in the area should have these aggregated.
- How much new for-sale + rental construction is in the pipeline within 1–3 miles? Heavy new supply typically softens prices + rents 12–24 months out; constrained supply supports both.
Investment metrics
- 1% rule
- 0.90% ✗
- Cap rate
- 6.54%
- Cash-on-cash
- 0.88%
- DSCR
- 1.04
- GRM
- 9.3
CMA / ARV
- ARV (on-the-fly)
- $187,824
- Comps found
- 10
Show comp detail 10 sales within ~0.75 mi
| Address | Dist | Beds/Ba | Sqft | Sold | Price | $/sf | Match |
|---|---|---|---|---|---|---|---|
| 203 NW 1st St | 0.19mi | 3/1.0 (-1) | 1,792 (-1%) | 1mo | $230,000 | $128 | 84 |
| 203 NW 1st St | 0.19mi | 3/1.0 (-1) | 1,792 (-1%) | 1mo | $230,000 | $128 | 84 |
| 105 Avenue 2 NW | 0.14mi | 3/2.0 (-1) | 1,840 (+2%) | 8mo | $215,000 | $117 | 75 |
| 806 NW 1st St | 0.19mi | 3/2.0 (-1) | 1,716 (-5%) | 5mo | $32,000 | $19 | 69 |
| 704 NW 1st St | 0.15mi | 3/2.0 (-1) | 1,767 (-2%) | 20mo | $215,900 | $122 | 64 |
| 305 NE 5th St | 0.54mi | 3/1.0 (-1) | 1,656 (-8%) | 15mo | $129,500 | $78 | 43 |
| 307 NE 4th St | 0.51mi | 4/2.0 | 1,682 (-7%) | 21mo | $175,000 | $104 | 43 |
| 408 Ave 2 NE | 0.47mi | 3/2.0 (-1) | 1,636 (-9%) | 23mo | $134,500 | $82 | 35 |
| 1204 SW 3rd St | 0.56mi | 3/2.0 (-1) | 1,560 (-14%) | 11mo | $110,000 | $71 | 33 |
| 1405 W Main St | 0.72mi | 3/2.0 (-1) | 1,582 (-12%) | 16mo | $153,500 | $97 | 24 |
Match score weights: distance 35% · size 25% · config 20% · recency 20%. Top-matched comps best support the ARV.
Projected returns pro-forma
5.82% appreciation · 3.0% rent growth · sell at horizon
- IRR
- 15.7%
- Equity multiple
- 2.04×
- Total profit
- $34,245
- Equity at exit
- $72,557
- IRR
- 15.8%
- Equity multiple
- 4.04×
- Total profit
- $99,897
- Equity at exit
- $130,465
Cash invested: $32,900 (down + closing). Projections, not guarantees.
Landlord ↔ Tenant lean methodology
- Overall (STATE)
- 92 Strongly Landlord-Friendly
- State Arkansas
- 92 Strongly Landlord-Friendly · R+14
- County
- — inherits STATE
- City
- — inherits STATE
ZIP-level market 72823
- Home prices YoY
- 2.2%
- Active inventory
- 44
- Price-to-rent
- 9.3×
Monthly cashflow live
- Estimated rent
- $1,058 medium interval (Pro) →
- Mortgage (P&I)
- −$616
- Tax est. 1.5%
- −$147 /mo · $1,762/yr
- Insurance
- −$49
- HOA
- −$0
- Vacancy / Maint / Mgmt
- −$222
- Net cashflow
- $24
Break-even live
Sensitivity live
| Price | -10% $105 | -5% $65 | +0% $24 | +5% $-17 | +10% $-57 |
|---|---|---|---|---|---|
| Rent | -10% $-60 | -5% $-18 | +0% $24 | +5% $66 | +10% $108 |
| Rate | -1.0pp $83 | -0.5pp $54 | base $24 | +0.5pp $-6 | +1.0pp $-37 |
UW: 25.0% down · 7.5% · 30yr · 1.5% tax · 5.0% vac · 8.0% maint · 8.0% mgmt
Financing live
Cash to close
- Down payment
- $29,375
- Closing costs
- $3,525
- Reserves months
- —
- Total cash needed
- —
Loan-product check · same deal, 3 products live
Conventional
25% down · 7.5% · 30yr
- Down + closing
- —
- Monthly P&I
- —
- Monthly cashflow
- —
- DSCR
- —
- Eligible?
- —
Personal DTI + credit; lowest rate.
DSCR
20% down · 8.5% · 30yr
- Down + closing
- —
- Monthly P&I
- —
- Monthly cashflow
- —
- DSCR
- —
- Eligible?
- —
No personal income docs; deal must DSCR.
Hard money
10% down · 12.0% · 12mo
- Down + closing
- —
- Monthly P&I
- —
- Monthly cashflow
- —
- DSCR
- —
- Eligible?
- —
Short-term bridge; refi at stabilization.
Listing history 20 events
-
2026-06-22days on market $117,500 Active 55 DOM
-
2026-06-19days on market $117,500 Active 52 DOM
-
2026-06-18days on market $117,500 Active 51 DOM
-
2026-06-17days on market $117,500 Active 50 DOM
-
2026-06-16days on market $117,500 Active 49 DOM
-
2026-06-15days on market $117,500 Active 48 DOM
-
2026-06-14days on market $117,500 Active 46 DOM
-
2026-06-12days on market $117,500 Active 45 DOM
-
2026-06-09days on market $117,500 Active 42 DOM
-
2026-06-08days on market $117,500 Active 41 DOM
-
2026-06-07days on market $117,500 Active 40 DOM
-
2026-06-05days on market $117,500 Active 37 DOM
-
2026-06-03days on market $117,500 Active 36 DOM
-
2026-06-02days on market $117,500 Active 35 DOM
-
2026-06-01days on market $117,500 Active 34 DOM
-
2026-05-31days on market $117,500 Active 33 DOM
-
2026-05-30days on market $117,500 Active 32 DOM
-
2026-04-27$117,500 Active
-
2025-08-12price $127,000
-
2004-04-30soldstatus $41,000
ⓘ Source: listings_history table (triggers on properties + properties_extension) + one-shot
backfill from property_details.listing_events for pre-trigger history.
Climate risk First Street
- Flood 1/10 Low FEMA zone X (unshaded) · 0% chance over 30 yrs
- Wildfire 3/10 Moderate
- Heat 7/10 Severe 7 d/yr ≥113°F today · 20 d/yr by 30 yrs out
- Wind 2/10 Low 4% chance of damaging wind over 30 yrs
- Air quality 1/10 Low 0 unhealthy d/yr today · 0 by 30 yrs out
Nearby sold comps map
Loading sold comps map…
Walkable amenities ~0.75 mi
Loading nearby amenities…
Taxation est. · year 1
- Rental income
- $12,700
- − Mortgage interest
- −$6,582
- − Property taxes
- −$1,762
- − Insurance
- −$588
- − Repairs & maintenance
- −$1,016
- − Management
- −$1,016
- − Depreciation
- −$3,418
- Taxable loss
- −$1,682
- Est. tax savings @ 24.0%
- +$404
- After-tax cash flow
- $693/yr
For passive investors: Depreciation is non-cash, so a rental often shows a tax loss while cash-flowing — sheltering income. Rental losses are passive: they offset passive income freely, and up to $25,000/yr can offset ordinary (W-2) income if you actively participate and your MAGI is under $100k (phasing out to $0 by $150k); unused losses carry forward. On sale, claimed depreciation is recaptured at up to 25%, and gains may owe capital-gains tax (a 1031 exchange can defer both). Figures are a year-1 estimate at your 24.0% rate — not tax advice; consult a CPA.
Schools (NCES district)
- District
- Atkins School District
- NCES district ID
- 0502610
- Math proficiency
- 39% ▼ -16.00%
- Reading proficiency
- 37% ▼ -14.00%
- Median HH income
- $39,550
- Composite
- 31.85/100
- National rank
- #5873
- State rank
- #93 of 238 in AR
Livability — Atkins
- Score
- 59/100
- State rank
- #293
- US rank
- #20152
Category grades
Schools grade is shown separately in the Schools card above.
Census & demographics
- Census place
- Atkins, AR
- Population (ZIP)
- 5,980
Population outlook (Pope County) Hauer SSP2
- Today (2025)
- 66,303 people
- By 2030
- 67,635 · +2.0%
- By 2040
- 70,046 · +5.6%
- By 2050
- 72,107 · +8.8%
- By 2075
- 78,042 · +17.7%
- By 2100
- 82,343 · +24.2%
Race, ethnicity, and origin ACS 2023
- Neighborhood character
- Predominantly White (95%)
- Race & ethnicity
- White 95% Two or more races 3% Black 2%
- Common ancestry
- Slovak 2% Iranian 2% Italian 1%
- Foreign-born
- 0%
Political lean MEDSL · Pope
- 2024 margin
- Solid R (+52.2) · D 22.7% · R 74.9% · Other 2.4%
- 2008→2024 swing
- -8.9pp toward R · 2008: -43.3pp · 2024: -52.2pp
- All cycles
- 2024: R+52.2 2020: R+50.4 2016: R+50.5 2012: R+47.2 2008: R+43.3
Not yet ingested
- Civics
- —
Market trends
- HPI YoY
- ▲ 5.82%
- Current HPI
- 273.8762
- Rent YoY
- —
- Metro
- —
- State GDP YoY
- ▲ 3.80%
- F500 in state
- 10
Industry mix (Fortune 500 HQ in AR)
| Industry | F500 HQs | Revenue |
|---|---|---|
| Retail | 1 | $681B |
|
||
| Food / Agriculture | 1 | $53B |
|
||
| Retail / Energy | 1 | $22B |
|
||
| Transportation / Logistics | 1 | $12B |
|
||
| Energy | 1 | $4B |
|
||
Price history
+186.6% since first listed3 events — show timeline
- 2026-04-27 Listed $117,500 WRVBOR
- 2025-08-12 Price Changed $127,000 NWARMLS
- 2004-04-30 Sold (Public Records) $41,000 Public Records
Property tax history
-20.1%/yrLatest (2023): $46 · -51.9% YoY. Source: county tax records.
Cash-flow waterfall
monthlySold comps — $/sqft
last 12 mo · ≤1 miLoading sold comps…