 🏷️ Likely Rental
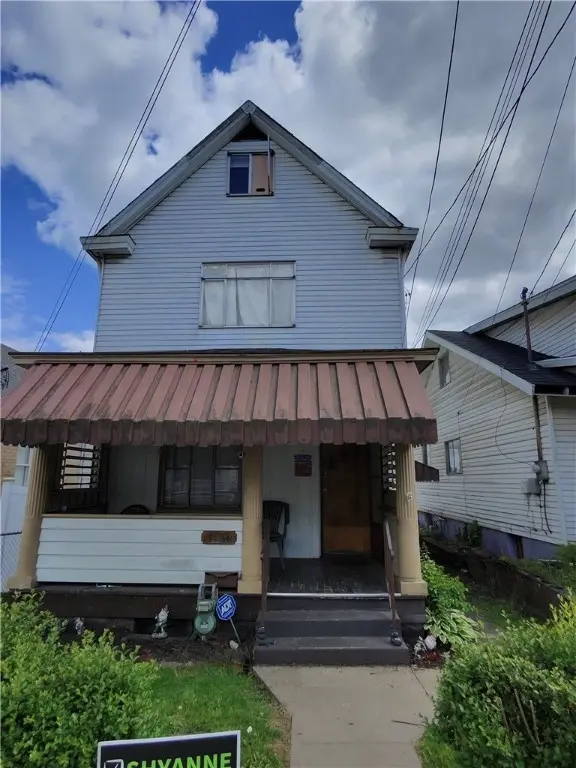
1131 13th St · Stowe, PA
Flood risk 6/10 · Moderate
- FEMA flood zone
- X (unshaded)
- Chance of flooding over 30 yrs
- 0.69%
- Est. flood insurance / yr
- $473 – $860
Fire risk 1/10 · Minimal
- Est. fire insurance / yr
- $511 – $949
Heat risk 4/10 · Minor
- Hot days now (above 98°F)
- 7 days/yr
- Hot days in 30 yrs
- 18 days/yr
Wind risk 2/10 · Minimal
- Chance of severe wind over 30 yrs
- —
Air-quality risk 3/10 · Minor
- Unhealthy air days now
- 3 days/yr
- Unhealthy air days in 30 yrs
- 3 days/yr
Risk factors via First Street. Map © Google.
Why this score? — see what drove the B grade
The composite is a weighted blend of 9 inputs, each scored 0–100. Each bar is that input's sub-score; the figure is the points it added to the 100-point composite (weight × sub-score).
- Cash flow +29.3/30.0
- ARV discount +15.0/15.0
- DSCR +10.0/10.0
- 1% rule +7.7/10.0
- Rent growth +5.0/5.0
- Livability +3.8/5.0
- Condition / age +2.5/5.0
- Schools +0.9/10.0
- Appreciation +0.0/10.0
$109,999
🖨 Deal sheet 📄 Offer letter ✓ Due diligence
Listing remarks MLS
Fully occupied and turnkey rental! Investor Special! Solid frame single family residence conveniently located in the heart of McKees Rocks! Perfect for an investor looking for a great rental with appreciation potential! Amazing location! Residence is professionally managed w a long term tenant in place. Add some cosmetic upgrades and maximize rents! Main Floor: Living Room, Dining Room, and Kitchen. 2nd Floor: 3 Bedrooms and a Full Bath. 3rd Floor: 2 Bedrooms. Full basement for Laundry and Storage. Nice sized covered front porch for your morning coffee. Decent sized rear yard for cookouts! 1 Gas Meter, 1 Water Meter, and 1 Electric Meter. 1 H2O tank, 1 Electric Panel, and 1 Furnace in basement. Could serve as a very nice rental grade home for a tenant, a fix and flip, or owner occupant looking to create the space of their dreams. With a vision, anything is possible here! This is a rare find, ideal for any investment portfolio!
Key facts
- Covered front porch
- Kitchen
- Living room
Tags
Neighborhood map
What this means for you Summary
Snapshot
- This is a 3-bed/1.0-bath single-family listed at $110k.
Deal economics
- At list price, monthly cash flow is $386 ($5k/yr) — positive.
- The deal already cash-flows at list — no discount required.
- Meets the 1% rule at list price ($1k rent vs $110k).
- Recommended offer: $108k (1.5% below list) — sets the bar for market timing.
- Cap rate 10.5% vs local median 6.4% in Stowe — top-decile yield for the area; either an underpriced asset or a hidden risk that comps aren't pricing in. Stress-test before assuming the spread holds.
Location & tenants
- Location reads 75/100 on livability (#441 in PA, #4,019 nationally) — a middle-class / working-renter tenant base. Strengths: crime A+, cost of living A+, housing A+; Watch: amenities F, commute F.
- Sto-Rox SD (suburban): math 4% / reading 18% proficiency, ranked #532 of 539 in PA (top 99%) — low school quality limits family demand, transient renter base, plan for 1-2y turnover; 77% free/reduced lunch — lower-income household profile, screen leases tightly.
- Market conditions: Rents rising fast (+13.1%/yr); 125 active listings in the ZIP; 20 comparable units currently listed for rent nearby; rentals at typical pace (median 24d on market — plan ~3-4 weeks tenant-placement turnaround); 2,996 units permitted in Allegheny County in 2024 (1,588 in 5+ unit buildings).
Forward outlook
- Local home prices are declining (-3.0%/yr); year-one equity from $760 of loan paydown is wiped out by about $3k of value loss. Plan a longer hold.
- At projected returns (-3.0% appreciation + 8.0% rent growth), your $31k cash investment doubles in ~6 years — after that, you're playing with house money.
Negotiation context
- It's been on market 28 days — a 2% lower offer ($108k) is reasonable based on typical stale-listing flexibility.
- 2 sale attempts since 13y ago with the ask held roughly flat each time — persistent listings suggest the price (not the market) is what's stuck; bring a comps-based counter.
- Current owner paid $14k; list at $110k implies a 715% gain — meaningful room to come down on a strong offer.
Risks & watch-outs
- Watch-outs: built in 1923 — expect roof / HVAC / electrical / plumbing capex.
- Climate carrying-cost: major flood risk — expect insurance premiums to compound above CPI over the hold.
Questions for the listing agent
- Built in 1923 — when were the roof, HVAC, electrical panel, plumbing, and water heater last replaced?
- Is there a deadline driving the sale (1031 exchange, divorce, estate, relocation)? That informs how much negotiation room exists.
- What's the average days-on-market for RENTAL listings here right now (not sales)? A rising rental-DOM trend means longer vacancies and softer asking-rent achievability than the comps imply.
- What's the recent tenant-quality profile in this submarket — average credit score on applications, eviction rate, late-payment / NSF rate, and stable-employment percentage? A property-management company in the area should have these aggregated.
- How much new for-sale + rental construction is in the pipeline within 1–3 miles? Heavy new supply typically softens prices + rents 12–24 months out; constrained supply supports both.
Investment metrics
- 1% rule
- 1.27% ✓
- Cap rate
- 10.50%
- Cash-on-cash
- 15.02%
- DSCR
- 1.67
- GRM
- 6.6
CMA / ARV
- ARV (median comp)
- $152,949
- List price
- $109,999
- Delta
- -28.08%
- Verdict
- UNDERPRICED
- Comps
- 20 within 1.0 mi
Show comp detail 12 sales within ~0.75 mi
| Address | Dist | Beds/Ba | Sqft | Sold | Price | $/sf | Match |
|---|---|---|---|---|---|---|---|
| 813 13th St | 0.15mi | 2/2.0 (-1) | 1,404 (+2%) | 4mo | $143,000 | $102 | 78 |
| 810 10th St | 0.21mi | 4/2.0 (+1) | 1,408 (+2%) | 4mo | $80,000 | $57 | 74 |
| 915 Liberty St | 0.18mi | 2/1.0 (-1) | 1,262 (-9%) | 0mo | $85,100 | $67 | 72 |
| 425 Macarthur St | 0.29mi | 3/1.0 | 1,220 (-12%) | 6mo | $170,000 | $139 | 62 |
| 543 Elizabeth Ave | 0.43mi | 4/1.0 (+1) | 1,291 (-7%) | 4mo | $155,000 | $120 | 61 |
| 8 Court Pl | 0.67mi | 3/1.5 | 1,421 (+3%) | 6mo | $325,000 | $229 | 57 |
| 202 Jane St | 0.52mi | 3/2.0 | 1,280 (-7%) | 4mo | $90,000 | $70 | 56 |
| 67 Rosamond St | 0.48mi | 3/2.0 | 1,545 (+12%) | 0mo | $128,000 | $83 | 54 |
| 27 Highland Ave | 0.73mi | 3/1.0 | 1,488 (+8%) | 5mo | $66,000 | $44 | 49 |
| 1109 Progress St | 0.74mi | 3/2.0 | 1,477 (+7%) | 3mo | $77,000 | $52 | 48 |
| 400 Broadway Ave | 0.71mi | 3/1.0 | 1,179 (-15%) | 3mo | $115,000 | $98 | 40 |
| 230 Lenore Dr | 0.69mi | 3/2.0 | 1,190 (-14%) | 6mo | $262,500 | $221 | 35 |
Match score weights: distance 35% · size 25% · config 20% · recency 20%. Top-matched comps best support the ARV.
Projected returns pro-forma
-3.0% appreciation · 8.0% rent growth · sell at horizon
- IRR
- 10.9%
- Equity multiple
- 1.46×
- Total profit
- $14,083
- Equity at exit
- $16,401
- IRR
- 23.6%
- Equity multiple
- 3.51×
- Total profit
- $77,337
- Equity at exit
- $9,511
Cash invested: $30,800 (down + closing). Projections, not guarantees.
Landlord ↔ Tenant lean methodology
- Overall (STATE)
- 62 Landlord-Friendly
- State Pennsylvania
- 62 Landlord-Friendly · EVEN
- County
- — inherits STATE
- City
- — inherits STATE
ZIP-level market 15136
- Home prices YoY
- -30.4%
- Rents YoY
- 13.1%
- Active inventory
- 125
- Price-to-rent
- 6.6×
Monthly cashflow live
- Estimated rent
- $1,392 high interval (Pro) →
- Mortgage (P&I)
- −$577
- Tax from tax record
- −$91 /mo · $1,096/yr
- Insurance
- −$46
- HOA
- −$0
- Vacancy / Maint / Mgmt
- −$292
- Net cashflow
- $386
Break-even live
UW: 25.0% down · 7.5% · 30yr · 1.5% tax · 5.0% vac · 8.0% maint · 8.0% mgmt
Financing live
Cash to close
- Down payment
- $27,500
- Closing costs
- $3,300
- Reserves months
- —
- Total cash needed
- —
Loan-product check · same deal, 3 products live
Conventional
25% down · 7.5% · 30yr
- Down + closing
- —
- Monthly P&I
- —
- Monthly cashflow
- —
- DSCR
- —
- Eligible?
- —
Personal DTI + credit; lowest rate.
DSCR
20% down · 8.5% · 30yr
- Down + closing
- —
- Monthly P&I
- —
- Monthly cashflow
- —
- DSCR
- —
- Eligible?
- —
No personal income docs; deal must DSCR.
Hard money
10% down · 12.0% · 12mo
- Down + closing
- —
- Monthly P&I
- —
- Monthly cashflow
- —
- DSCR
- —
- Eligible?
- —
Short-term bridge; refi at stabilization.
Rent comps 20 comps
| Address | Beds | Baths | Sqft | Rent | $/sqft | DOM | Units | Dist |
|---|---|---|---|---|---|---|---|---|
| 27 Rudolph St Mc Kees Rocks, PA | 3.0 | 1.0 | 1084 | $1,100 | $1.01 | 2d | 1 | 0.13mi |
| 933 Woodward Ave Unit NA McKees Rocks, PA | 2.0 | 1.0 | 1100 | $1,400 | $1.27 | 20d | 1 | 0.14mi |
| 933 Woodward Ave Unit MC McKees Rocks, PA | 2.0 | 1.0 | 1100 | $1,400 | $1.27 | 23d | 1 | 0.14mi |
| 802 13th St Unit 2 McKees Rocks, PA | 2.0 | 1.0 | 1100 | $920 | $0.84 | 43d | 1 | 0.16mi |
| 915 Woodward Ave Mc Kees Rocks, PA | 3.0 | 1.0 | 1224 | $1,399 | $1.14 | 43d | 1 | 0.17mi |
| 1124a Dohrman St McKees Rocks, PA | 3.0 | 1.0 | 1150 | $1,250 | $1.09 | 23d | 1 | 0.28mi |
| 1126 Dohrman St Unit MC McKees Rocks, PA | 2.0 | 1.0 | 1200 | $1,250 | $1.04 | 43d | 1 | 0.28mi |
| 705 Russellwood Ave Unit 2ndFL McKees Rocks, PA | 4.0 | 1.0 | 1100 | $2,250 | $2.05 | 2d | 1 | 0.33mi |
| 705 Russellwood Ave Apt 2nd Floor McKees Rocks, PA | 4.0 | 1.0 | 1100 | $2,195 | $2.00 | 2d | 1 | 0.33mi |
| 214 Wright St Unit Na McKees Rocks, PA | 2.0 | 1.0 | 954 | $1,175 | $1.23 | 14d | 1 | 0.47mi |
| 614 Woodward Ave McKees Rocks, PA | 2.0 | 1.0 | 1000 | $950 | $0.95 | 7d | 1 | 0.49mi |
| 135 Dunn St Mc Kees Rocks, PA | 3.0 | 2.0 | 1600 | $1,599 | $1.00 | 19d | 1 | 0.51mi |
| 207 Singer Ave Mc Kees Rocks, PA | 3.0 | 2.0 | 1728 | $1,700 | $0.98 | 43d | 1 | 0.52mi |
| 71 McKinnie Ave Mc Kees Rocks, PA | 2.0 | 1.0 | 1176 | $1,100 | $0.94 | 23d | 1 | 0.60mi |
| 504 Fair Oaks St Mc Kees Rocks, PA | 4.0 | 1.0 | 1480 | $1,195 | $0.81 | 23d | 1 | 0.67mi |
| 10 Highland Dr Mc Kees Rocks, PA | 2.0 | 1.0 | 1188 | $1,300 | $1.09 | 43d | 1 | 0.68mi |
| 27 Highland Ave Mc Kees Rocks, PA | 3.0 | 1.0 | 1488 | $1,425 | $0.96 | 23d | 1 | 0.72mi |
| 214 Erwin Pl Mc Kees Rocks, PA | 3.0 | 1.0 | 1026 | $1,685 | $1.64 | 43d | 1 | 0.78mi |
| 907 Chartiers Ave Unit 2 McKees Rocks, PA | 2.0 | 1.0 | 900 | $1,100 | $1.22 | 23d | 1 | 0.94mi |
| 720 Mary St Mc Kees Rocks, PA | 4.0 | 2.0 | 1800 | $1,795 | $1.00 | 7d | 1 | 1.10mi |
Listing history 19 events
-
2026-06-18days on market $109,999 Active 28 DOM
-
2026-06-17days on market $109,999 Active 27 DOM
-
2026-06-16days on market $109,999 Active 26 DOM
-
2026-06-15days on market $109,999 Active 25 DOM
-
2026-06-13days on market $109,999 Active 23 DOM
-
2026-06-09days on market $109,999 Active 19 DOM
-
2026-06-08days on market $109,999 Active 18 DOM
-
2026-06-07days on market $109,999 Active 17 DOM
-
2026-06-05days on market $109,999 Active 14 DOM
-
2026-06-03days on market $109,999 Active 13 DOM
-
2026-06-02days on market $109,999 Active 12 DOM
-
2026-06-01days on market $109,999 Active 11 DOM
-
2026-05-31days on market $109,999 Active 10 DOM
-
2025-05-21$109,999 Active 940-char remark
Show marketing remark (940 chars)
Fully occupied and turnkey rental! Investor Special! Solid frame single family residence conveniently located in the heart of McKees Rocks! Perfect for an investor looking for a great rental with appreciation potential! Amazing location! Residence is professionally managed w a long term tenant in place. Add some cosmetic upgrades and maximize rents! Main Floor: Living Room, Dining Room, and Kitchen. 2nd Floor: 3 Bedrooms and a Full Bath. 3rd Floor: 2 Bedrooms. Full basement for Laundry and Storage. Nice sized covered front porch for your morning coffee. Decent sized rear yard for cookouts! 1 Gas Meter, 1 Water Meter, and 1 Electric Meter. 1 H2O tank, 1 Electric Panel, and 1 Furnace in basement. Could serve as a very nice rental grade home for a tenant, a fix and flip, or owner occupant looking to create the space of their dreams. With a vision, anything is possible here! This is a rare find, ideal for any investment portfolio!
-
2022-06-20price $1,395
-
2014-02-12price $13,500 213-char remark
Show marketing remark (213 chars)
Perfect House For Rental Property or Fixer Upper! Hardwood Floors, 3 Bedrooms, And Additional Living Space In The Attic For An Added Bedroom or Family Room! Nice Fenced-In Level Rear Yard. Close To Down Town Area.
-
2014-02-07price $19,900 213-char remark
Show marketing remark (213 chars)
Perfect House For Rental Property or Fixer Upper! Hardwood Floors, 3 Bedrooms, And Additional Living Space In The Attic For An Added Bedroom or Family Room! Nice Fenced-In Level Rear Yard. Close To Down Town Area.
-
2014-02-07soldstatus $13,500 213-char remark
Show marketing remark (213 chars)
Perfect House For Rental Property or Fixer Upper! Hardwood Floors, 3 Bedrooms, And Additional Living Space In The Attic For An Added Bedroom or Family Room! Nice Fenced-In Level Rear Yard. Close To Down Town Area.
-
2013-09-30$19,900 213-char remark
Show marketing remark (213 chars)
Perfect House For Rental Property or Fixer Upper! Hardwood Floors, 3 Bedrooms, And Additional Living Space In The Attic For An Added Bedroom or Family Room! Nice Fenced-In Level Rear Yard. Close To Down Town Area.
ⓘ Source: listings_history table (triggers on properties + properties_extension) + one-shot
backfill from property_details.listing_events for pre-trigger history.
Tax reassessment forecast PA · Partial reset (capped growth)
- Current annual tax
- $1,096 · $91/mo
- Projected year-2 tax
- $1,417 · $118/mo
- Expected delta
- +$321/yr (+$27/mo · 29.3%)
ⓘ Screening estimate from a state-policy table — verify with the county assessor before closing.
Climate risk First Street
- Flood 6/10 Major FEMA zone X (unshaded) · 69% chance over 30 yrs
- Wildfire 1/10 Low
- Heat 4/10 Moderate 7 d/yr ≥98°F today · 18 d/yr by 30 yrs out
- Wind 2/10 Low
- Air quality 3/10 Moderate 3 unhealthy d/yr today · 3 by 30 yrs out
Nearby sold comps map
Loading sold comps map…
Walkable amenities ~0.75 mi
Loading nearby amenities…
Taxation est. · year 1
- Rental income
- $16,703
- − Mortgage interest
- −$6,162
- − Property taxes
- −$1,096
- − Insurance
- −$550
- − Repairs & maintenance
- −$1,336
- − Management
- −$1,336
- − Depreciation
- −$3,200
- Taxable income
- $3,023
- Est. tax owed @ 24.0%
- −$726
- After-tax cash flow
- $3,902/yr
For passive investors: Depreciation is non-cash, so a rental often shows a tax loss while cash-flowing — sheltering income. Rental losses are passive: they offset passive income freely, and up to $25,000/yr can offset ordinary (W-2) income if you actively participate and your MAGI is under $100k (phasing out to $0 by $150k); unused losses carry forward. On sale, claimed depreciation is recaptured at up to 25%, and gains may owe capital-gains tax (a 1031 exchange can defer both). Figures are a year-1 estimate at your 24.0% rate — not tax advice; consult a CPA.
Schools (NCES district)
- District
- Sto-Rox SD
- NCES district ID
- 4222830
- Math proficiency
- 4% ▼ -5.00%
- Reading proficiency
- 18% ▼ -4.00%
- Median HH income
- $30,268
- Composite
- 8.51/100
- National rank
- #9904
- State rank
- #532 of 539 in PA
Livability — Stowe
- Score
- 75/100
- State rank
- #441
- US rank
- #4019
Category grades
Schools grade is shown separately in the Schools card above.
Census & demographics
- County
- Allegheny County · 1,022,028 people
- Metro
- Pittsburgh, PA
- Population (ZIP)
- 22,623
- Household income
- $69,099
- Rent vs Own
- Severe rent burden
- 768.0
Population outlook (Allegheny County) Hauer SSP2
- Today (2025)
- 1,250,282 people
- By 2030
- 1,256,482 · +0.5%
- By 2040
- 1,256,318 · +0.5%
- By 2050
- 1,244,169 · -0.5%
- By 2075
- 1,197,693 · -4.2%
- By 2100
- 1,093,187 · -12.6%
Race, ethnicity, and origin ACS 2023
- Neighborhood character
- Predominantly White (75%)
- Race & ethnicity
- White 75% Black 18% Two or more races 4% Hispanic / Latino 2%
- Common ancestry
- Romanian 10% Subsaharan African 3% Scotch-Irish 2%
- Foreign-born
- 3% · Canada
- Languages at home
- 96% English-only · Spanish 1% Other Indo-European 1%
Political lean MEDSL · Allegheny
- 2024 margin
- Strong D (+20.3) · D 59.7% · R 39.4%
- 2008→2024 swing
- +4.8pp toward D · 2008: 15.5pp · 2024: 20.3pp
- All cycles
- 2024: D+20.3 2020: D+20.4 2016: D+16.4 2012: D+14.4 2008: D+15.5
Not yet ingested
- Civics
- —
Market trends
- HPI YoY
- ▼ -107.07%
- Current HPI
- 244.6934
- Rent YoY
- ▲ 13.12%
- Metro
- Pittsburgh, PA
- State GDP YoY
- ▲ 1.68%
- F500 in state
- 34
Industry mix (Fortune 500 HQ in PA)
| Industry | F500 HQs | Revenue |
|---|---|---|
| Healthcare | 2 | $309B |
|
||
| Insurance | 2 | $27B |
|
||
| Telecommunications / Media | 1 | $124B |
|
||
| Industrial Distribution | 1 | $22B |
|
||
| Financial Services | 1 | $20B |
|
||
| Chemicals / Materials | 1 | $18B |
|
||
Price history
+452.8% since first listed6 events — show timeline
- 2025-05-21 Listed $109,999 West Penn MLS
- 2022-06-20 Price Changed $1,395 RENT.
- 2014-02-12 Price Changed $13,500 West Penn MLS
- 2014-02-07 Sold (MLS) $13,500 West Penn MLS
- 2014-02-07 Price Changed $19,900 West Penn MLS
- 2013-09-30 Listed $19,900 West Penn MLS
Property tax history
-3.1%/yrLatest (2026): $1,096 · +4.0% YoY. Source: county tax records.
Cash-flow waterfall
monthlySold comps — $/sqft
last 12 mo · ≤1 miLoading sold comps…