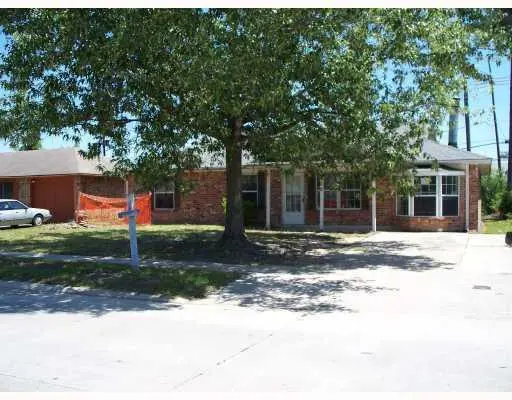
102 Northwood Dr · Slidell, LA
Flood risk 6/10 · Moderate
- FEMA flood zone
- X
- Chance of flooding over 30 yrs
- 0.69%
- Est. flood insurance / yr
- $507 – $1,088
Fire risk 4/10 · Minor
- Est. fire insurance / yr
- $1,269 – $2,357
Heat risk 10/10 · Severe
- Hot days now (above 108°F)
- 7 days/yr
- Hot days in 30 yrs
- 22 days/yr
Wind risk 9/10 · Severe
- Chance of severe wind over 30 yrs
- 99.0%
Air-quality risk 2/10 · Minimal
- Unhealthy air days now
- 1 days/yr
- Unhealthy air days in 30 yrs
- 2 days/yr
Risk factors via First Street. Map © Google.
Why this score? — see what drove the B+ grade
The composite is a weighted blend of 9 inputs, each scored 0–100. Each bar is that input's sub-score; the figure is the points it added to the 100-point composite (weight × sub-score).
- Cash flow +30.0/30.0
- ARV discount +15.0/15.0
- DSCR +10.0/10.0
- 1% rule +8.8/10.0
- Schools +4.3/10.0
- Livability +3.5/5.0
- Rent growth +2.9/5.0
- Condition / age +2.5/5.0
- Appreciation +0.0/10.0
$145,000
🖨 Deal sheet (PDF) 📄 Offer letter ✓ Due diligence
Listing remarks MLS
INVESTOR SPECIAL IN SLIDELL. 5 BEDROOM, 3 BATH HOME LOCATED IN DESIRABLE NORTHSHORE SCHOOL DISTRICT. PROPERTY NEEDS WORK BUT A PROJECT WELL WORTH IT. FLOOD ZONE C. SELLER IS MOTIVATED AND WILL ENTERTAIN ALL OFFERS FOR AN IMMEDIATE SALE.
Key facts
- Parking
- Built 1980
- Listed 9 days
Neighborhood map
What this means for you Summary
Snapshot
- This is a 5-bed/3.0-bath single-family listed at $145k.
Deal economics
- At list price, monthly cash flow is $592 ($7k/yr) — positive.
- The deal already cash-flows at list — no discount required.
- Meets the 1% rule at list price ($2k rent vs $145k).
- Cap rate 11.2% vs local median 5.9% in Slidell — top-decile yield for the area; either an underpriced asset or a hidden risk that comps aren't pricing in. Stress-test before assuming the spread holds.
Location & tenants
- Location reads 70/100 on livability (#57 in LA) — a middle-class / working-renter tenant base. Strengths: cost of living A+, housing A+, health & safety A+; Watch: amenities F, commute F.
- St. Tammany Parish (suburban): math 43% / reading 55% proficiency, ranked #11 of 98 in LA (top 11%) — families likely to look elsewhere, expect single-tenant / working-renter base with shorter leases.
- Market conditions: Rents rising (+1.5%/yr); 489 active listings in the ZIP; 7 comparable units currently listed for rent nearby; rentals leasing fast (median 13d on market — plan ~1-2 weeks tenant-placement turnaround); 1,064 units permitted in St. Tammany Parish in 2024 (0 in 5+ unit buildings).
- This rent runs 33% of the median local income ($73k/yr) — at the standard rent-burdened threshold; future hikes will face affordability resistance.
Forward outlook
- Local home prices are declining (-3.0%/yr); year-one equity from $1k of loan paydown is wiped out by about $4k of value loss. Plan a longer hold.
- St. Tammany County population projected at +27% by 2050 — long-run rental-demand tailwind backs the buy-and-hold thesis.
- At projected returns (-3.0% appreciation + 1.5% rent growth), your $41k cash investment doubles in ~8 years — after that, you're playing with house money.
Negotiation context
- Only 9 days on market — expect competitive offers; lowballing is unlikely to land.
- 10 sale attempts since 27y ago with the ask held roughly flat each time — persistent listings suggest the price (not the market) is what's stuck; bring a comps-based counter.
Risks & watch-outs
- Climate carrying-cost: major flood risk; severe wind risk, 99% chance of damaging wind over 30y; extreme-heat days projected 7→22/yr by 2055 (HVAC capex compounding) — expect insurance premiums to compound above CPI over the hold.
Questions for the listing agent
- Is there a deadline driving the sale (1031 exchange, divorce, estate, relocation)? That informs how much negotiation room exists.
- Schools are B-rated — typically a magnet for longer-tenancy family renters. What's the average tenant stay here, and is there a school-zone premium baked into asking?
- What's the average days-on-market for RENTAL listings here right now (not sales)? A rising rental-DOM trend means longer vacancies and softer asking-rent achievability than the comps imply.
- What's the recent tenant-quality profile in this submarket — average credit score on applications, eviction rate, late-payment / NSF rate, and stable-employment percentage? A property-management company in the area should have these aggregated.
- How much new for-sale + rental construction is in the pipeline within 1–3 miles? Heavy new supply typically softens prices + rents 12–24 months out; constrained supply supports both.
Investment metrics
- 1% rule
- 1.38% ✓
- Cap rate
- 11.19%
- Cash-on-cash
- 17.51%
- DSCR
- 1.78
- GRM
- 6.0
CMA / ARV
- ARV (on-the-fly)
- $222,438
- Comps found
- 7
Show comp detail 7 sales within ~0.75 mi
| Address | Dist | Beds/Ba | Sqft | Sold | Price | $/sf | Match |
|---|---|---|---|---|---|---|---|
| 119 Northwood Dr | 0.10mi | 4/2.0 (-1) | 1,575 (-7%) | 1mo | $190,000 | $121 | 74 |
| 120 Pine Cir | 0.57mi | 4/2.0 (-1) | 1,660 (-2%) | 3mo | $216,800 | $131 | 58 |
| 135 Spruce Cir | 0.43mi | 4/2.0 (-1) | 1,841 (+8%) | 17mo | $145,000 | $79 | 43 |
| 204 N Jayson Dr | 0.27mi | 4/2.0 (-1) | 1,941 (+14%) | 14mo | $335,000 | $173 | 43 |
| 124 Kingston Dr | 0.63mi | 4/2.0 (-1) | 1,911 (+12%) | 0mo | $255,000 | $133 | 40 |
| 609 Haaswood Ln | 0.64mi | 4/2.0 (-1) | 1,875 (+10%) | 4mo | $313,000 | $167 | 40 |
| 124 Kingston Dr | 0.63mi | 4/2.0 (-1) | 1,911 (+12%) | 16mo | $215,000 | $113 | 27 |
Match score weights: distance 35% · size 25% · config 20% · recency 20%. Top-matched comps best support the ARV.
Projected returns pro-forma
-3.0% appreciation · 1.47% rent growth · sell at horizon
- IRR
- 7.2%
- Equity multiple
- 1.28×
- Total profit
- $11,219
- Equity at exit
- $21,620
- IRR
- 15.2%
- Equity multiple
- 2.14×
- Total profit
- $46,371
- Equity at exit
- $12,537
Cash invested: $40,600 (down + closing). Projections, not guarantees.
Landlord ↔ Tenant lean methodology
- Overall (STATE)
- 90 Strongly Landlord-Friendly
- State Louisiana
- 90 Strongly Landlord-Friendly · R+12
- County
- — inherits STATE
- City
- — inherits STATE
ZIP-level market 70458
- Rents YoY
- 1.5%
- Active inventory
- 489
- Price-to-rent
- 6.0×
Monthly cashflow live
- Estimated rent
- $1,998 high interval (Pro) →
- Mortgage (P&I)
- −$760
- Tax from tax record
- −$166 /mo · $1,987/yr
- Insurance
- −$60
- HOA
- −$0
- Vacancy / Maint / Mgmt
- −$420
- Net cashflow
- $592
Break-even live
Sensitivity live
| Price | -10% $674 | -5% $633 | +0% $592 | +5% $551 | +10% $510 |
|---|---|---|---|---|---|
| Rent | -10% $434 | -5% $513 | +0% $592 | +5% $671 | +10% $750 |
| Rate | -1.0pp $665 | -0.5pp $629 | base $592 | +0.5pp $555 | +1.0pp $517 |
UW: 25.0% down · 7.5% · 30yr · 1.5% tax · 5.0% vac · 8.0% maint · 8.0% mgmt
Financing live
Cash to close
- Down payment
- $36,250
- Closing costs
- $4,350
- Reserves months
- —
- Total cash needed
- —
Loan-product check · same deal, 3 products live
Conventional
25% down · 7.5% · 30yr
- Down + closing
- —
- Monthly P&I
- —
- Monthly cashflow
- —
- DSCR
- —
- Eligible?
- —
Personal DTI + credit; lowest rate.
DSCR
20% down · 8.5% · 30yr
- Down + closing
- —
- Monthly P&I
- —
- Monthly cashflow
- —
- DSCR
- —
- Eligible?
- —
No personal income docs; deal must DSCR.
Hard money
10% down · 12.0% · 12mo
- Down + closing
- —
- Monthly P&I
- —
- Monthly cashflow
- —
- DSCR
- —
- Eligible?
- —
Short-term bridge; refi at stabilization.
Rent comps 7 comps
| Address | Beds | Baths | Sqft | Rent | $/sqft | DOM | Units | Dist |
|---|---|---|---|---|---|---|---|---|
| 100 Firwood Dr Slidell, LA | 4.0 | 2.0 | 1649 | $1,900 | $1.15 | 44d | 1 | 0.38mi |
| 101 Dante Cir Slidell, LA | 4.0 | 2.0 | 1941 | $1,950 | $1.00 | 12d | 1 | 0.49mi |
| 108 Ellwood Cir Slidell, LA | 4.0 | 2.0 | 1517 | $1,800 | $1.19 | 4d | 1 | 0.58mi |
| 117 S Queens Dr Slidell, LA | 4.0 | 2.0 | 1476 | $1,800 | $1.22 | 4d | 1 | 0.89mi |
| 347 Oriole Dr Slidell, LA | 4.0 | 1.5 | 1560 | $1,500 | $0.96 | 24d | 1 | 0.92mi |
| 347 Oriole Dr Slidell, LA | 4.0 | 1.5 | 1560 | $1,500 | $0.96 | 44d | 1 | 0.92mi |
| 542 Driftwood Cir Slidell, LA | 4.0 | 2.0 | 1960 | $2,100 | $1.07 | 4d | 1 | 0.97mi |
Listing history 15 events
-
2026-04-11status Pending 236-char remark
Show marketing remark (236 chars)
INVESTOR SPECIAL IN SLIDELL. 5 BEDROOM, 3 BATH HOME LOCATED IN DESIRABLE NORTHSHORE SCHOOL DISTRICT. PROPERTY NEEDS WORK BUT A PROJECT WELL WORTH IT. FLOOD ZONE C. SELLER IS MOTIVATED AND WILL ENTERTAIN ALL OFFERS FOR AN IMMEDIATE SALE.
-
2026-04-11status Pending
Show marketing remark (236 chars)
INVESTOR SPECIAL IN SLIDELL. 5 BEDROOM, 3 BATH HOME LOCATED IN DESIRABLE NORTHSHORE SCHOOL DISTRICT. PROPERTY NEEDS WORK BUT A PROJECT WELL WORTH IT. FLOOD ZONE C. SELLER IS MOTIVATED AND WILL ENTERTAIN ALL OFFERS FOR AN IMMEDIATE SALE.
-
2026-03-30$145,000 Active 236-char remark
Show marketing remark (236 chars)
INVESTOR SPECIAL IN SLIDELL. 5 BEDROOM, 3 BATH HOME LOCATED IN DESIRABLE NORTHSHORE SCHOOL DISTRICT. PROPERTY NEEDS WORK BUT A PROJECT WELL WORTH IT. FLOOD ZONE C. SELLER IS MOTIVATED AND WILL ENTERTAIN ALL OFFERS FOR AN IMMEDIATE SALE.
-
2026-03-30$145,000 Active
Show marketing remark (236 chars)
INVESTOR SPECIAL IN SLIDELL. 5 BEDROOM, 3 BATH HOME LOCATED IN DESIRABLE NORTHSHORE SCHOOL DISTRICT. PROPERTY NEEDS WORK BUT A PROJECT WELL WORTH IT. FLOOD ZONE C. SELLER IS MOTIVATED AND WILL ENTERTAIN ALL OFFERS FOR AN IMMEDIATE SALE.
-
2009-08-31soldstatus $149,000
-
2009-04-23$149,900
-
2009-04-23$149,900
-
2008-12-31$154,900
-
2008-12-31$154,900
-
2008-09-26soldstatus $90,666
-
2008-04-18$97,200
-
2008-04-18$97,200
-
1999-09-24soldstatus $75,500
-
1999-06-03$78,900
-
1999-06-03$78,900
ⓘ Source: listings_history table (triggers on properties + properties_extension) + one-shot
backfill from property_details.listing_events for pre-trigger history.
Tax reassessment forecast LA · Resets to sale price
- Current annual tax
- $1,987 · $166/mo
- Projected year-2 tax
- $1,987 · $166/mo
- Expected delta
- $0/yr ($0/mo · 0.0%)
ⓘ Screening estimate from a state-policy table — verify with the county assessor before closing.
Climate risk First Street
- Flood 6/10 Major FEMA zone X · 69% chance over 30 yrs
- Wildfire 4/10 Moderate
- Heat 10/10 Extreme 7 d/yr ≥108°F today · 22 d/yr by 30 yrs out
- Wind 9/10 Extreme 99% chance of damaging wind over 30 yrs
- Air quality 2/10 Low 1 unhealthy d/yr today · 2 by 30 yrs out
Nearby sold comps map
Loading sold comps map…
Walkable amenities ~0.75 mi
Loading nearby amenities…
Taxation est. · year 1
- Rental income
- $23,980
- − Mortgage interest
- −$8,122
- − Property taxes
- −$1,987
- − Insurance
- −$725
- − Repairs & maintenance
- −$1,918
- − Management
- −$1,918
- − Depreciation
- −$4,218
- Taxable income
- $5,091
- Est. tax owed @ 24.0%
- −$1,222
- After-tax cash flow
- $5,886/yr
For passive investors: Depreciation is non-cash, so a rental often shows a tax loss while cash-flowing — sheltering income. Rental losses are passive: they offset passive income freely, and up to $25,000/yr can offset ordinary (W-2) income if you actively participate and your MAGI is under $100k (phasing out to $0 by $150k); unused losses carry forward. On sale, claimed depreciation is recaptured at up to 25%, and gains may owe capital-gains tax (a 1031 exchange can defer both). Figures are a year-1 estimate at your 24.0% rate — not tax advice; consult a CPA.
Schools (NCES district)
- District
- St. Tammany Parish
- NCES district ID
- 2201650
- Math proficiency
- 43% ▼ -32.00%
- Reading proficiency
- 55% ▼ -26.00%
- Median HH income
- $61,752
- Composite
- 43.04/100
- National rank
- #3098
- State rank
- #11 of 98 in LA
Livability — Slidell
- Score
- 70/100
- State rank
- #57
- US rank
- #7673
Category grades
Schools grade is shown separately in the Schools card above.
Census & demographics
- County
- Saint Tammany Parish · 228,296 people
- City population
- 95,511
- Metro
- New Orleans-Metairie, LA
- Population (ZIP)
- 39,034
- Household income
- $72,843
- Rent vs Own
- Severe rent burden
- 1331.0
Population outlook (St. Tammany County) Hauer SSP2
- Today (2025)
- 286,725 people
- By 2030
- 304,175 · +6.1%
- By 2040
- 336,203 · +17.3%
- By 2050
- 364,590 · +27.2%
- By 2075
- 433,362 · +51.1%
- By 2100
- 470,333 · +64.0%
Race, ethnicity, and origin ACS 2023
- Neighborhood character
- Predominantly White (66%)
- Race & ethnicity
- White 66% Black 17% Two or more races 10% Hispanic / Latino 9% Native American 2% Asian 1%
- Hispanic origin (detail)
- Mexican 3% Puerto Rican 1%
- Common ancestry
- Lithuanian 15% Slovak 2% Romanian 1%
- Foreign-born
- 3% · Canada, Vietnam
- Languages at home
- 93% English-only · Spanish 5% Vietnamese 1%
Political lean MEDSL · St. Tammany
- 2024 margin
- Solid R (+43.8) · D 27.3% · R 71.1% · Other 1.6%
- 2008→2024 swing
- +9.6pp toward D · 2008: -53.4pp · 2024: -43.8pp
- All cycles
- 2024: R+43.8 2020: R+44.2 2016: R+50.8 2012: R+52.2 2008: R+53.4
Not yet ingested
- Civics
- —
Market trends
- HPI YoY
- ▼ -173.60%
- Current HPI
- 147.4749
- Rent YoY
- ▲ 1.47%
- Metro
- New Orleans-Metairie, LA
- State GDP YoY
- ▲ 3.29%
- F500 in state
- 10
Industry mix (Fortune 500 HQ in LA)
| Industry | F500 HQs | Revenue |
|---|---|---|
| Telecommunications | 2 | $23B |
|
||
| Utilities | 1 | $12B |
|
||
| Wholesale / Distribution | 1 | $5B |
|
||
| Advertising | 1 | $2B |
|
||
Price history
+83.8% since first listed15 events — show timeline
- 2026-04-11 Pending — AcadianaMLS
- 2026-04-11 Pending — GSREIN
- 2026-03-30 Listed $145,000 GSREIN
- 2026-03-30 Listed $145,000 AcadianaMLS
- 2009-08-31 Sold (Public Records) $149,000 Public Records
- 2009-04-23 Listed $149,900 GSREIN
- 2009-04-23 Listed $149,900 AcadianaMLS
- 2008-12-31 Listed $154,900 GSREIN
- 2008-12-31 Listed $154,900 AcadianaMLS
- 2008-09-26 Sold (MLS) $90,666 GSREIN
- 2008-04-18 Listed $97,200 GSREIN
- 2008-04-18 Listed $97,200 AcadianaMLS
- 1999-09-24 Sold (MLS) $75,500 GSREIN
- 1999-06-03 Listed $78,900 GSREIN
- 1999-06-03 Listed $78,900 AcadianaMLS
Property tax history
+0.3%/yrLatest (2025): $1,987 · -3.9% YoY. Source: county tax records.
Cash-flow waterfall
monthlySold comps — $/sqft
last 12 mo · ≤1 miLoading sold comps…