314 N Main St · Mount Olive, MS
Flood risk 1/10 · Minimal
- FEMA flood zone
- X (unshaded)
- Chance of flooding over 30 yrs
- 0.0%
- Est. flood insurance / yr
- $507 – $1,088
Fire risk 4/10 · Minor
- Est. fire insurance / yr
- $1,241 – $2,305
Heat risk 7/10 · Major
- Hot days now (above 108°F)
- 7 days/yr
- Hot days in 30 yrs
- 20 days/yr
Wind risk 8/10 · Major
- Chance of severe wind over 30 yrs
- 90.0%
Air-quality risk 1/10 · Minimal
- Unhealthy air days now
- 0 days/yr
- Unhealthy air days in 30 yrs
- 0 days/yr
Risk factors via First Street. Map © Google.
Why this score? — see what drove the B+ grade
The composite is a weighted blend of 9 inputs, each scored 0–100. Each bar is that input's sub-score; the figure is the points it added to the 100-point composite (weight × sub-score).
- Cash flow +30.0/30.0
- 1% rule +10.0/10.0
- DSCR +10.0/10.0
- Appreciation +8.8/10.0
- ARV discount +7.5/15.0
- Livability +3.3/5.0
- Rent growth +2.5/5.0
- Schools +2.2/10.0
- Condition / age +1.0/5.0
$49,900
🖨 Deal sheet 📄 Offer letter ✓ Due diligence
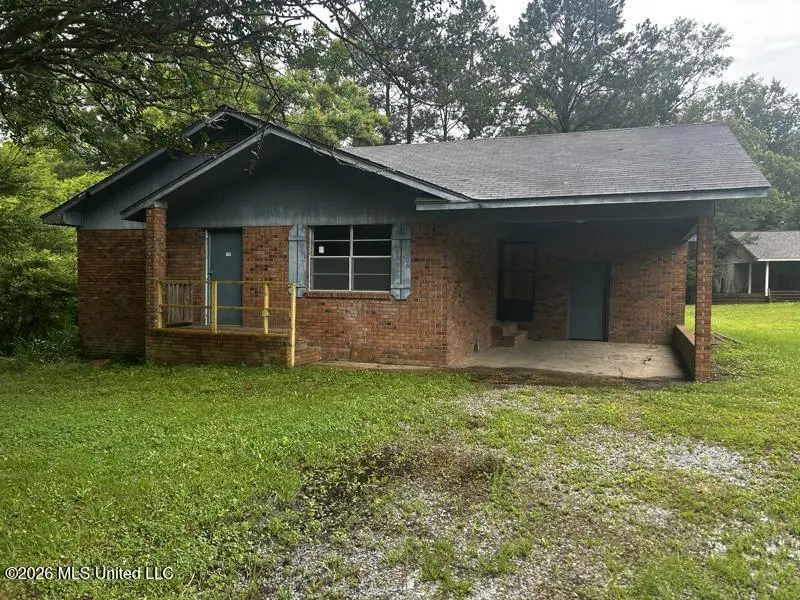
Listing remarks
Come make this property your own. Features 4 bedrooms and 2 bathrooms, Brick exterior, with single carport attached.
Key facts
- 9,583 sq ft lot
- Parking
- Built 1982
Property features AI
Finance
- Other: Lot size about 0.22 acre
Exterior
- Parking: Covered carport (1 space); Total parking for 1 vehicle
- Utilities: Public water; Public sewer; Electricity connected
- Home design: Single-family residence; House; One level
- Construction: Brick and wood siding construction; Pillar/post/pier foundation; Built (year sourced from public records)
- Exterior features: Shingle roof
Interior
- Flooring: Wood
- Bathrooms: 2 full bathrooms
- Heating & cooling: Electric heating; Electric cooling
- Interior features: Wood flooring
Neighborhood map
What this means for you Summary
Snapshot
- This is a 4-bed/2.0-bath single-family listed at $50k. Condition is rated poor.
Deal economics
- At list price, monthly cash flow is $640 ($8k/yr) — positive.
- The deal already cash-flows at list — no discount required.
- Meets the 1% rule at list price ($1k rent vs $50k).
- Recommended offer: $49k (1.5% below list) — sets the bar for market timing.
Location & tenants
- Location reads 66/100 on livability (#93 in MS) — a middle-class / working-renter tenant base. Strengths: crime A+, cost of living A+, housing A+; Watch: health & safety D, schools F, amenities F.
- Covington County School District (rural): math 26% / reading 28% proficiency, ranked #78 of 130 in MS (top 60%) — low school quality limits family demand, transient renter base, plan for 1-2y turnover; 74% free/reduced lunch — lower-income household profile, screen leases tightly.
- Market conditions: 27 active listings in the ZIP.
Forward outlook
- In year one you build about $4k of equity ($345 loan paydown + $4k appreciation (7.6% local appreciation)).
- Covington County population projected at -15% by 2050 — secular population decline; favor cash flow + early exit over multi-decade hold.
- At projected returns (7.6% appreciation + 3.0% rent growth), your $14k cash investment doubles in ~2 years — after that, you're playing with house money.
- By year 8, paydown + projected appreciation supports a ~$33k cash-out refi (75% LTV) — recoverable capital for the next deal without selling this one.
Negotiation context
- It's been on market 18 days — a 2% lower offer ($49k) is reasonable based on typical stale-listing flexibility.
- 3 sale attempts; this cycle's ask has dropped $20k (29%) from the opening price — seller is motivated, your offer sets the floor, not the list.
Risks & watch-outs
- Climate carrying-cost: severe wind risk, 90% chance of damaging wind over 30y; extreme-heat days projected 7→20/yr by 2055 (HVAC capex compounding) — expect insurance premiums to compound above CPI over the hold.
Questions for the listing agent
- Have any recent inspections been done? Can we get a copy of the seller's disclosures and any deferred-maintenance estimates?
- Is there a deadline driving the sale (1031 exchange, divorce, estate, relocation)? That informs how much negotiation room exists.
- Schools are F-rated, which usually means shorter tenancies and higher turnover. Who's the typical renter profile here, and what's been the actual vacancy rate?
- What's the average days-on-market for RENTAL listings here right now (not sales)? A rising rental-DOM trend means longer vacancies and softer asking-rent achievability than the comps imply.
- What's the recent tenant-quality profile in this submarket — average credit score on applications, eviction rate, late-payment / NSF rate, and stable-employment percentage? A property-management company in the area should have these aggregated.
- How much new for-sale + rental construction is in the pipeline within 1–3 miles? Heavy new supply typically softens prices + rents 12–24 months out; constrained supply supports both.
Investment metrics
- 1% rule
- 2.50% ✓
- Cap rate
- 21.69%
- Cash-on-cash
- 54.97%
- DSCR
- 3.45
- GRM
- 3.3
CMA / ARV
No comps found within radius.
Projected returns pro-forma
7.57% appreciation · 3.0% rent growth · sell at horizon
- IRR
- 65.1%
- Equity multiple
- 5.29×
- Total profit
- $59,969
- Equity at exit
- $36,450
- IRR
- 60.7%
- Equity multiple
- 11.29×
- Total profit
- $143,731
- Equity at exit
- $71,003
Cash invested: $13,972 (down + closing). Projections, not guarantees.
Landlord ↔ Tenant lean methodology
- Overall (STATE)
- 90 Strongly Landlord-Friendly
- State Mississippi
- 90 Strongly Landlord-Friendly · R+11
- County
- — inherits STATE
- City
- — inherits STATE
ZIP-level market 39119
- Home prices YoY
- 5.3%
- Active inventory
- 27
- Price-to-rent
- 3.3×
Monthly cashflow live
- Estimated rent
- $1,247 medium interval (Pro) →
- Mortgage (P&I)
- −$262
- Tax est. 1.5%
- −$62 /mo · $748/yr
- Insurance
- −$21
- HOA
- −$0
- Vacancy / Maint / Mgmt
- −$262
- Net cashflow
- $640
Break-even live
UW: 25.0% down · 7.5% · 30yr · 1.5% tax · 5.0% vac · 8.0% maint · 8.0% mgmt
Financing live
Cash to close
- Down payment
- $12,475
- Closing costs
- $1,497
- Reserves months
- —
- Total cash needed
- —
Loan-product check · same deal, 3 products live
Conventional
25% down · 7.5% · 30yr
- Down + closing
- —
- Monthly P&I
- —
- Monthly cashflow
- —
- DSCR
- —
- Eligible?
- —
Personal DTI + credit; lowest rate.
DSCR
20% down · 8.5% · 30yr
- Down + closing
- —
- Monthly P&I
- —
- Monthly cashflow
- —
- DSCR
- —
- Eligible?
- —
No personal income docs; deal must DSCR.
Hard money
10% down · 12.0% · 12mo
- Down + closing
- —
- Monthly P&I
- —
- Monthly cashflow
- —
- DSCR
- —
- Eligible?
- —
Short-term bridge; refi at stabilization.
Listing history 15 events
-
2026-06-19days on market $49,900 Active 18 DOM
-
2026-06-18days on market $49,900 Active 17 DOM
-
2026-06-17days on market $49,900 Active 16 DOM
-
2026-06-16pricedays on market $49,900 Active 15 DOM
-
2026-06-15days on market $69,900 Active 14 DOM
-
2026-06-14days on market $69,900 Active 12 DOM
-
2026-06-13days on market $69,900 Active 11 DOM
-
2026-06-10days on market $69,900 Active 9 DOM
-
2026-06-09days on market $69,900 Active 8 DOM
-
2026-06-08days on market $69,900 Active 7 DOM
-
2026-06-07days on market $69,900 Active 6 DOM
-
2026-06-05days on market $69,900 Active 3 DOM
-
2026-06-03days on market $69,900 Active 2 DOM
-
2026-06-01remarks 116-char remark
-
2026-06-01$69,900 Active 1 DOM
ⓘ Source: listings_history table (triggers on properties + properties_extension) + one-shot
backfill from property_details.listing_events for pre-trigger history.
Climate risk First Street
- Flood 1/10 Low FEMA zone X (unshaded) · 0% chance over 30 yrs
- Wildfire 4/10 Moderate
- Heat 7/10 Severe 7 d/yr ≥108°F today · 20 d/yr by 30 yrs out
- Wind 8/10 Severe 90% chance of damaging wind over 30 yrs
- Air quality 1/10 Low 0 unhealthy d/yr today · 0 by 30 yrs out
Nearby sold comps map
Loading sold comps map…
Walkable amenities ~0.75 mi
Loading nearby amenities…
Taxation est. · year 1
- Rental income
- $14,961
- − Mortgage interest
- −$2,795
- − Property taxes
- −$748
- − Insurance
- −$250
- − Repairs & maintenance
- −$1,197
- − Management
- −$1,197
- − Depreciation
- −$1,452
- Taxable income
- $7,322
- Est. tax owed @ 24.0%
- −$1,757
- After-tax cash flow
- $5,923/yr
For passive investors: Depreciation is non-cash, so a rental often shows a tax loss while cash-flowing — sheltering income. Rental losses are passive: they offset passive income freely, and up to $25,000/yr can offset ordinary (W-2) income if you actively participate and your MAGI is under $100k (phasing out to $0 by $150k); unused losses carry forward. On sale, claimed depreciation is recaptured at up to 25%, and gains may owe capital-gains tax (a 1031 exchange can defer both). Figures are a year-1 estimate at your 24.0% rate — not tax advice; consult a CPA.
Condition & rehab AI · 5 photos
This property requires extensive repairs and rebuilding to become move-in ready. Structural issues and missing siding and shingles are significant concerns.
Repairs flagged
- Major Exposed brick — Structural damage
- Major Missing siding — Exterior exposure
- Major Missing shingles — Roof damage
Value-add opportunities
- Both Rebuild exterior and roof — Structural repairs improve both resale and rental value
- Both Install new flooring — New flooring enhances both resale and rental appeal
- Both Paint interior and exterior — Fresh paint improves curb appeal and interior aesthetics
- Both Install new kitchen and bathrooms — Modern kitchens and bathrooms increase both resale and rental value
Renovation cost estimate screening
| Repair item | Severity | Est. cost |
|---|---|---|
| Exposed brick · Structural damage | Major | $15,000–50,000 |
| Missing siding · Exterior exposure | Major | $15,000–50,000 |
| Missing shingles · Roof damage | Major | $15,000–50,000 |
| Total estimated repair cost · 3 items | $45,000–150,000 |
Value-add ROI direction
- Both Rebuild exterior and roof — Structural repairs improve both resale and rental value ↑
- Both Install new flooring — New flooring enhances both resale and rental appeal ↑
- Both Paint interior and exterior — Fresh paint improves curb appeal and interior aesthetics ↑
- Both Install new kitchen and bathrooms — Modern kitchens and bathrooms increase both resale and rental value ↑
ⓘ Cost ranges are severity-bucket heuristics (US national rule-of-thumb). Get contractor quotes + a written scope before underwriting a rehab budget.
Schools (NCES district)
- District
- Covington County School District
- NCES district ID
- 2801290
- Math proficiency
- 26% ▼ -7.00%
- Reading proficiency
- 28% ▼ -4.00%
- Median HH income
- $33,020
- Composite
- 22.09/100
- National rank
- #8183
- State rank
- #78 of 130 in MS
Livability — Mount Olive
- Score
- 66/100
- State rank
- #93
- US rank
- #11501
Category grades
Schools grade is shown separately in the Schools card above.
Census & demographics
- Census place
- Mount Olive, MS
- Population (ZIP)
- 6,199
Population outlook (Covington County) Hauer SSP2
- Today (2025)
- 19,294 people
- By 2030
- 18,875 · -2.2%
- By 2040
- 17,777 · -7.9%
- By 2050
- 16,381 · -15.1%
- By 2075
- 12,704 · -34.2%
- By 2100
- 9,090 · -52.9%
Race, ethnicity, and origin ACS 2023
- Neighborhood character
- Majority Black (50%)
- Race & ethnicity
- Black 50% White 46% Two or more races 2% Hispanic / Latino 2%
- Common ancestry
- Serbian 4% Italian 1% Slovak 1%
- Foreign-born
- 0%
- Languages at home
- 99% English-only · Spanish 1%
Political lean MEDSL · Covington
- 2024 margin
- Solid R (+33.3) · D 33.0% · R 66.2%
- 2008→2024 swing
- -15.6pp toward R · 2008: -17.7pp · 2024: -33.3pp
- All cycles
- 2024: R+33.3 2020: R+26.0 2016: R+24.5 2012: R+16.2 2008: R+17.7
Not yet ingested
- Civics
- —
Market trends
- HPI YoY
- ▲ 7.57%
- Current HPI
- 150.7147
- Rent YoY
- —
- Metro
- —
- State GDP YoY
- —
- F500 in state
- 0
Price history
-22.2% since first listed5 events — show timeline
- 2026-05-31 Listed $69,900 MLSU
- 2026-03-24 Relisted — HAAR
- 2026-03-24 Price Changed $69,900 HAAR
- 2026-02-20 Price Changed $79,900 HAAR
- 2025-12-15 Listed $89,900 HAAR
Cash-flow waterfall
monthlySold comps — $/sqft
last 12 mo · ≤1 miLoading sold comps…