 🌊 Lakefront
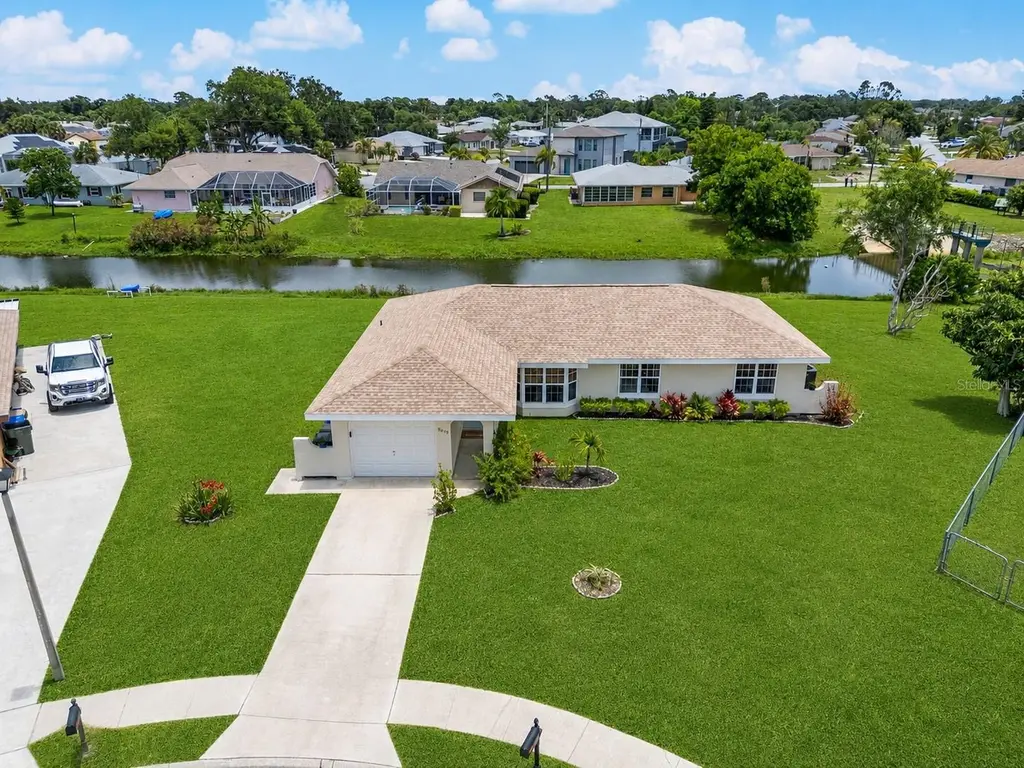
5698 Lingle St · North Port, FL
Flood risk 5/10 · Moderate
- FEMA flood zone
- X (unshaded)
- Chance of flooding over 30 yrs
- 0.48%
- Est. flood insurance / yr
- $507 – $1,088
Fire risk 1/10 · Minimal
- Est. fire insurance / yr
- $947 – $1,759
Heat risk 10/10 · Severe
- Hot days now (above 108°F)
- 7 days/yr
- Hot days in 30 yrs
- 28 days/yr
Wind risk 10/10 · Severe
- Chance of severe wind over 30 yrs
- 99.0%
Air-quality risk 3/10 · Minor
- Unhealthy air days now
- 2 days/yr
- Unhealthy air days in 30 yrs
- 3 days/yr
Risk factors via First Street. Map © Google.
Why this score? — see what drove the D- grade
The composite is a weighted blend of 9 inputs, each scored 0–100. Each bar is that input's sub-score; the figure is the points it added to the 100-point composite (weight × sub-score).
- ARV discount +14.5/15.0
- Cash flow +7.3/30.0
- Schools +5.4/10.0
- Livability +3.8/5.0
- Rent growth +2.6/5.0
- Condition / age +2.5/5.0
- 1% rule +2.0/10.0
- DSCR +1.5/10.0
- Appreciation +0.0/10.0
$299,999
🖨 Deal sheet 📄 Offer letter ✓ Due diligence
Listing remarks
Welcome to 5698 Lingle Street, a beautifully maintained North Port residence showcasing a warm and inviting shabby chic design aesthetic, professionally curated by an interior decorator. Thoughtfully designed with comfort and style in mind, this charming home features soft neutral tones, inviting living spaces, and tasteful finishes that create a relaxed yet elegant atmosphere throughout. Natural light fills the interior, enhancing the home’s character and functional layout ideal for everyday living or seasonal enjoyment. Situated on Blue Ridge Lake with access to the Coco Plum Waterway, this property offers a peaceful waterfront setting ideal for enjoying Florida’s outdoor life
Key facts
- Outdoor living space
- Tranquil water views
- Waterfront setting
Tags
Property features AI
Finance
- Other: Zoned RSF2; Total lot about 0.32 acres (1/4 to less than 1/2 acre)
- HOA & community: No HOA association indicated
Exterior
- Parking: Attached garage (1 car)
- Utilities: Public water; Public sewer; Cable connected; Broadband/high-speed internet available; Sewer connected; Water connected
- Home design: Single family residence; One story; Faces north
- Construction: Stucco and frame construction; Shingle roof; Slab foundation; Built with living area recorded at approximately 1,418 square feet
- Exterior features: Sliding doors; Lake view; Canal and lake water access; Asphalt road access
Interior
- Kitchen: Cooktop; Range; Dishwasher; Disposal; Refrigerator; Stone counters
- Bedrooms: 3 bedrooms
- Flooring: Tile
- Bathrooms: 2 full bathrooms
- Heating & cooling: Central heating; Central air conditioning
- Interior features: Ceiling fans; Eat-in kitchen; Kitchen/family room combo; Open floorplan; Stone counters
- Laundry & utility: Laundry in garage; Washer; Dryer; Electric water heater
Neighborhood map
What this means for you Summary
Snapshot
- This is a 3-bed/2.0-bath single-family listed at $300k.
Deal economics
- At list price, monthly cash flow is $-394 ($-5k/yr) — negative.
- To cash-flow at today's rent, offer at most $230k (23.2% below list).
- To meet the 1% rule (rent ≥ 1% of price), the offer needs to be $209k (30.4% below list).
- Recommended offer: $209k (30.4% below list) — sets the bar for 1% rule.
- Cap rate 4.7% vs local median 3.6% in North Port — meaningfully above typical; check what's discounted (condition, days-on-market, listing class) to confirm the premium yield is real.
Location & tenants
- Location reads 75/100 on livability (#252 in FL, #3,975 nationally) — a middle-class / working-renter tenant base. Strengths: crime A+, housing A+, health & safety A+; Watch: amenities F, commute F.
- Sarasota (urban): math 63% / reading 63% proficiency, ranked #7 of 73 in FL (top 10%) — acceptable for families but not a draw, mixed tenant base, ~2y average lease.
- Zoned schools: Cranberry Elementary School (math 69% / reading 68%, grade B+, #409 of 2,144 statewide, top 20%, 785 students, 68% FRL); North Port High School (math 44% / reading 57%, grade D+, #171 of 667 statewide, top 26%, 2,562 students, 54% FRL) — zoned schools average 61% FRL vs 42% district-wide (19 pts higher); higher-poverty schools than district average — tighter screening recommended.
- Market conditions: Rents flat; 852 active listings in the ZIP; 8 comparable units currently listed for rent nearby; rentals at typical pace (median 22d on market — plan ~3-4 weeks tenant-placement turnaround); 7,466 units permitted in Sarasota County in 2024 (2,138 in 5+ unit buildings).
- This rent runs 39% of the median local income ($63k/yr) — at the standard rent-burdened threshold; future hikes will face affordability resistance.
Forward outlook
- Local home prices are declining (-3.0%/yr); year-one equity from $2k of loan paydown is wiped out by about $9k of value loss. Plan a longer hold.
- Sarasota County population projected at +20% by 2050 — long-run rental-demand tailwind backs the buy-and-hold thesis.
Negotiation context
- It's been on market 36 days — a 3% lower offer ($291k) is reasonable based on typical stale-listing flexibility.
- 4 sale attempts since 2y ago with the ask held roughly flat each time — persistent listings suggest the price (not the market) is what's stuck; bring a comps-based counter.
- Current owner paid $67k; list at $300k implies a 348% gain — meaningful room to come down on a strong offer.
Risks & watch-outs
- Climate carrying-cost: moderate flood risk; severe wind risk, 99% chance of damaging wind over 30y; extreme-heat days projected 7→28/yr by 2055 (HVAC capex compounding) — expect insurance premiums to compound above CPI over the hold.
Questions for the listing agent
- What do current leases actually rent for vs. the listed asking? Can we see a recent rent roll and the last 12 months of T-12 income?
- It's been on market 36 days. Have you received any prior offers? Is the seller open to a 30% concession, seller financing, or rate buy-down credit?
- Is there a deadline driving the sale (1031 exchange, divorce, estate, relocation)? That informs how much negotiation room exists.
- Schools are B-rated — typically a magnet for longer-tenancy family renters. What's the average tenant stay here, and is there a school-zone premium baked into asking?
- The area grade is low — what's the realistic commute time and amenity access for the typical tenant pool here? Any planned neighborhood developments (good or bad) we should know about?
- This sits on a lake — are riparian / water-frontage rights deeded with the parcel? Any dock permits, shoreline easements, or HOA water-use restrictions?
- What's the documented flood / surge / shoreline-erosion history here (FEMA AND non-FEMA — e.g., storm surge, creek backup, septic-field saturation)?
- Any water-quality or seasonal algae-bloom issues that affect tenant satisfaction or short-term-rental demand?
- What's the average days-on-market for RENTAL listings here right now (not sales)? A rising rental-DOM trend means longer vacancies and softer asking-rent achievability than the comps imply.
- What's the recent tenant-quality profile in this submarket — average credit score on applications, eviction rate, late-payment / NSF rate, and stable-employment percentage? A property-management company in the area should have these aggregated.
- How much new for-sale + rental construction is in the pipeline within 1–3 miles? Heavy new supply typically softens prices + rents 12–24 months out; constrained supply supports both.
Investment metrics
- 1% rule
- 0.70% ✗
- Cap rate
- 4.72%
- Cash-on-cash
- -5.62%
- DSCR
- 0.75
- GRM
- 12.0
CMA / ARV
- ARV (median comp)
- $355,193
- List price
- $299,999
- Delta
- -15.54%
- Verdict
- UNDERPRICED
- Comps
- 18 within 1.0 mi
Show comp detail 1 sale within ~0.75 mi
| Address | Dist | Beds/Ba | Sqft | Sold | Price | $/sf | Match |
|---|---|---|---|---|---|---|---|
| 15009 Dania Ave | 0.62mi | 2/2.0 (-1) | 1,232 (-13%) | 21mo | $242,000 | $196 | 27 |
Match score weights: distance 35% · size 25% · config 20% · recency 20%. Top-matched comps best support the ARV.
Projected returns pro-forma
-3.0% appreciation · 0.26% rent growth · sell at horizon
- IRR
- -28.9%
- Equity multiple
- 0.06×
- Total profit
- $-79,264
- Equity at exit
- $44,731
- IRR
- -44.3%
- Equity multiple
- -0.46×
- Total profit
- $-122,996
- Equity at exit
- $25,938
Cash invested: $84,000 (down + closing). Projections, not guarantees.
Landlord ↔ Tenant lean methodology
- Overall (STATE)
- 87 Strongly Landlord-Friendly
- State Florida
- 87 Strongly Landlord-Friendly · R+3
- County
- — inherits STATE
- City
- — inherits STATE
ZIP-level market 34287
- Home prices YoY
- -20.1%
- Rents YoY
- 0.3%
- Active inventory
- 852
- Price-to-rent
- 12.0×
Monthly cashflow live
- Estimated rent
- $2,087 high interval (Pro) →
- Mortgage (P&I)
- −$1,573
- Tax from tax record
- −$344 /mo · $4,124/yr
- Insurance
- −$125
- HOA
- −$0
- Vacancy / Maint / Mgmt
- −$438
- Net cashflow
- $-394
Break-even live
Sensitivity live
| Price | -10% $-224 | -5% $-309 | +0% $-394 | +5% $-478 | +10% $-563 |
|---|---|---|---|---|---|
| Rent | -10% $-558 | -5% $-476 | +0% $-394 | +5% $-311 | +10% $-229 |
| Rate | -1.0pp $-242 | -0.5pp $-317 | base $-394 | +0.5pp $-471 | +1.0pp $-550 |
UW: 25.0% down · 7.5% · 30yr · 1.5% tax · 5.0% vac · 8.0% maint · 8.0% mgmt
Financing live
Cash to close
- Down payment
- $75,000
- Closing costs
- $9,000
- Reserves months
- —
- Total cash needed
- —
Loan-product check · same deal, 3 products live
Conventional
25% down · 7.5% · 30yr
- Down + closing
- —
- Monthly P&I
- —
- Monthly cashflow
- —
- DSCR
- —
- Eligible?
- —
Personal DTI + credit; lowest rate.
DSCR
20% down · 8.5% · 30yr
- Down + closing
- —
- Monthly P&I
- —
- Monthly cashflow
- —
- DSCR
- —
- Eligible?
- —
No personal income docs; deal must DSCR.
Hard money
10% down · 12.0% · 12mo
- Down + closing
- —
- Monthly P&I
- —
- Monthly cashflow
- —
- DSCR
- —
- Eligible?
- —
Short-term bridge; refi at stabilization.
Rent comps 8 comps
| Address | Beds | Baths | Sqft | Rent | $/sqft | DOM | Units | Dist |
|---|---|---|---|---|---|---|---|---|
| 14134 Packard Ave Port Charlotte, FL | 4.0 | 2.0 | 1833 | $2,095 | $1.14 | 14d | 1 | 0.61mi |
| 14500 Ransom Ave Port Charlotte, FL | 2.0 | 2.0 | 1208 | $1,976 | $1.64 | 21d | 1 | 0.68mi |
| 96 Westview Pl Port Charlotte, FL | 1.0–3.0 | 1.0–2.0 | 1120 | $2,303 | $2.06 | 14d | 38 | 0.80mi |
| 232 Bamboo Dr Unit A Port Charlotte, FL | 3.0 | 2.0 | 1018 | $1,395 | $1.37 | 14d | 1 | 1.23mi |
| 312 Bamboo Dr Port Charlotte, FL | 3.0 | 2.0 | 1200 | $2,300 | $1.92 | 21d | 1 | 1.38mi |
| 385 Bowman Ter Unit 387 Port Charlotte, FL | 3.0 | 2.0 | 1200 | $1,900 | $1.58 | 21d | 1 | 1.44mi |
| 486 Hoffer St Port Charlotte, FL | 4.0 | 2.0 | 1833 | $1,995 | $1.09 | 21d | 1 | 1.46mi |
| 358 Bamboo Dr Port Charlotte, FL | 2.0 | 2.0 | 1052 | $1,399 | $1.33 | 21d | 1 | 1.47mi |
Listing history 32 events
-
2026-06-18days on market $299,999 Active 36 DOM
-
2026-06-17days on market $299,999 Active 35 DOM
-
2026-06-16days on market $299,999 Active 34 DOM
-
2026-06-15days on market $299,999 Active 33 DOM
-
2026-06-13days on market $299,999 Active 31 DOM
-
2026-06-13days on market $299,999 Active 30 DOM
-
2026-06-10days on market $299,999 Active 28 DOM
-
2026-06-09days on market $299,999 Active 27 DOM
-
2026-06-08days on market $299,999 Active 26 DOM
-
2026-06-08days on market $299,999 Active 25 DOM
-
2026-06-05days on market $299,999 Active 22 DOM
-
2026-06-03days on market $299,999 Active 21 DOM
-
2026-06-02days on market $299,999 Active 20 DOM
-
2026-06-01days on market $299,999 Active 19 DOM
-
2026-05-31days on market $299,999 Active 18 DOM
-
2026-05-13$315,000 Active 1240-char remark
-
2024-12-21historical
-
2024-12-19$309,900 Active
-
2024-05-30historical
-
2024-05-13price $309,900
-
2024-05-10price $349,900
-
2024-04-23price $299,999
-
2024-04-19price $315,000
-
2024-04-12price $319,900
-
2024-04-08price $330,000
-
2024-03-28price $339,400
-
2024-03-20status Active
-
2024-03-14status Pending
-
2024-03-08price $339,500
-
2024-02-12$359,900 Active
-
1992-04-27soldstatus $67,000
-
1991-04-29soldstatus $47,000
ⓘ Source: listings_history table (triggers on properties + properties_extension) + one-shot
backfill from property_details.listing_events for pre-trigger history.
Tax reassessment forecast FL · Resets to sale price
- Current annual tax
- $4,124 · $344/mo
- Projected year-2 tax
- $4,124 · $344/mo
- Expected delta
- $0/yr ($0/mo · 0.0%)
ⓘ Screening estimate from a state-policy table — verify with the county assessor before closing.
Climate risk First Street
- Flood 5/10 Major FEMA zone X (unshaded) · 48% chance over 30 yrs
- Wildfire 1/10 Low
- Heat 10/10 Extreme 7 d/yr ≥108°F today · 28 d/yr by 30 yrs out
- Wind 10/10 Extreme 99% chance of damaging wind over 30 yrs
- Air quality 3/10 Moderate 2 unhealthy d/yr today · 3 by 30 yrs out
Nearby sold comps map
Loading sold comps map…
Walkable amenities ~0.75 mi
Loading nearby amenities…
Taxation est. · year 1
- Rental income
- $25,038
- − Mortgage interest
- −$16,805
- − Property taxes
- −$4,124
- − Insurance
- −$1,500
- − Repairs & maintenance
- −$2,003
- − Management
- −$2,003
- − Depreciation
- −$8,727
- Taxable loss
- −$10,124
- Est. tax savings @ 24.0%
- +$2,430
- After-tax cash flow
- $-2,293/yr
For passive investors: Depreciation is non-cash, so a rental often shows a tax loss while cash-flowing — sheltering income. Rental losses are passive: they offset passive income freely, and up to $25,000/yr can offset ordinary (W-2) income if you actively participate and your MAGI is under $100k (phasing out to $0 by $150k); unused losses carry forward. On sale, claimed depreciation is recaptured at up to 25%, and gains may owe capital-gains tax (a 1031 exchange can defer both). Figures are a year-1 estimate at your 24.0% rate — not tax advice; consult a CPA.
Schools (NCES district)
- District
- Sarasota
- NCES district ID
- 1201680
- Math proficiency
- 63% ▼ -8.00%
- Reading proficiency
- 63% ▼ -3.00%
- Median HH income
- $51,167
- Composite
- 53.68/100
- National rank
- #1428
- State rank
- #7 of 73 in FL
Livability — North Port
- Score
- 75/100
- State rank
- #252
- US rank
- #3975
Category grades
Schools grade is shown separately in the Schools card above.
Census & demographics
- Census place
- North Port, FL
- County
- Sarasota County · 448,376 people
- City population
- 75,324
- Metro
- North Port-Sarasota-Bradenton, FL
- Population (ZIP)
- 25,929
- Household income
- $63,464
- Rent vs Own
- Severe rent burden
- 522.0
Population outlook (Sarasota County) Hauer SSP2
- Today (2025)
- 452,380 people
- By 2030
- 474,175 · +4.8%
- By 2040
- 511,577 · +13.1%
- By 2050
- 541,467 · +19.7%
- By 2075
- 604,947 · +33.7%
- By 2100
- 621,965 · +37.5%
Race, ethnicity, and origin ACS 2023
- Neighborhood character
- Predominantly White (77%)
- Race & ethnicity
- White 77% Hispanic / Latino 14% Two or more races 7% Asian 4% Black 3%
- Hispanic origin (detail)
- Mexican 2% Puerto Rican 3% Cuban 3% Dominican 1%
- Common ancestry
- Romanian 4% Scotch-Irish 3% Lithuanian 3%
- Foreign-born
- 16% · Canada, Philippines
- Languages at home
- 81% English-only · Spanish 8% Russian/Polish/Slavic 5% French/Haitian/Cajun 2%
Political lean MEDSL · Sarasota
- 2024 margin
- R (+18.2) · D 40.5% · R 58.7%
- 2008→2024 swing
- -18.1pp toward R · 2008: -0.1pp · 2024: -18.2pp
- All cycles
- 2024: R+18.2 2020: R+10.4 2016: R+11.6 2012: R+7.4 2008: R+0.1
Not yet ingested
- Civics
- —
Market trends
- HPI YoY
- ▼ -70.89%
- Current HPI
- 280.8484
- Rent YoY
- ▲ 0.26%
- Metro
- North Port-Sarasota-Bradenton, FL
- State GDP YoY
- ▲ 3.28%
- F500 in state
- 36
Industry mix (Fortune 500 HQ in FL)
| Industry | F500 HQs | Revenue |
|---|---|---|
| Industrial Technology | 2 | $29B |
|
||
| Insurance | 2 | $17B |
|
||
| Retail | 1 | $60B |
|
||
| Technology Distribution | 1 | $58B |
|
||
| Homebuilding | 1 | $35B |
|
||
| Technology Manufacturing | 1 | $35B |
|
||
Price history
+538.3% since first listed18 events — show timeline
- 2026-05-29 Price Changed $299,999 Stellar MLS as Distributed by MLS Grid
- 2026-05-13 Listed $315,000 Stellar MLS as Distributed by MLS Grid
- 2024-12-21 Listing Removed — Stellar MLS as Distributed by MLS Grid
- 2024-12-19 Listed $309,900 Stellar MLS as Distributed by MLS Grid
- 2024-05-30 Listing Removed — Stellar MLS as Distributed by MLS Grid
- 2024-05-13 Price Changed $309,900 Stellar MLS as Distributed by MLS Grid
- 2024-05-10 Price Changed $349,900 Stellar MLS as Distributed by MLS Grid
- 2024-04-23 Price Changed $299,999 Stellar MLS as Distributed by MLS Grid
- 2024-04-19 Price Changed $315,000 Stellar MLS as Distributed by MLS Grid
- 2024-04-12 Price Changed $319,900 Stellar MLS as Distributed by MLS Grid
- 2024-04-08 Price Changed $330,000 Stellar MLS as Distributed by MLS Grid
- 2024-03-28 Price Changed $339,400 Stellar MLS as Distributed by MLS Grid
- 2024-03-20 Relisted — Stellar MLS as Distributed by MLS Grid
- 2024-03-14 Pending — Stellar MLS as Distributed by MLS Grid
- 2024-03-08 Price Changed $339,500 Stellar MLS as Distributed by MLS Grid
- 2024-02-12 Listed $359,900 Stellar MLS as Distributed by MLS Grid
- 1992-04-27 Sold (Public Records) $67,000 Public Records
- 1991-04-29 Sold (Public Records) $47,000 Public Records
Property tax history
+11.1%/yrLatest (2025): $4,124 · +36.4% YoY. Source: county tax records.
Cash-flow waterfall
monthlySold comps — $/sqft
last 12 mo · ≤1 miLoading sold comps…