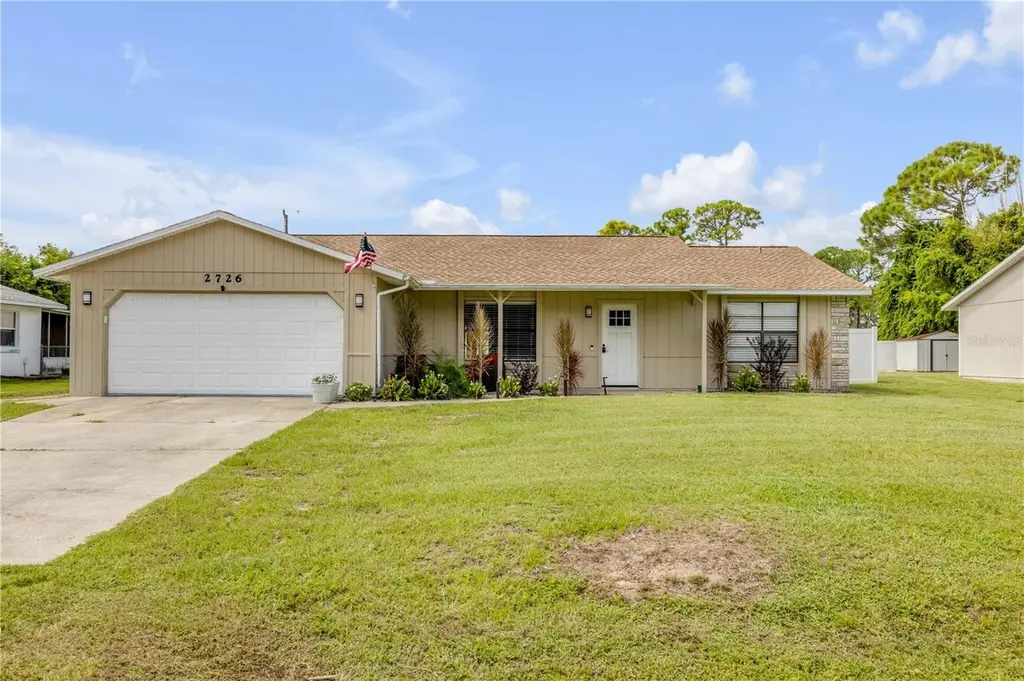
2726 Evergreen Dr · Edgewater, FL
Flood risk 1/10 · Minimal
- FEMA flood zone
- X (unshaded)
- Chance of flooding over 30 yrs
- 0.0%
- Est. flood insurance / yr
- $507 – $1,088
Fire risk 4/10 · Minor
- Est. fire insurance / yr
- $947 – $1,759
Heat risk 10/10 · Severe
- Hot days now (above 105°F)
- 7 days/yr
- Hot days in 30 yrs
- 22 days/yr
Wind risk 10/10 · Severe
- Chance of severe wind over 30 yrs
- 99.0%
Air-quality risk 2/10 · Minimal
- Unhealthy air days now
- 1 days/yr
- Unhealthy air days in 30 yrs
- 1 days/yr
Risk factors via First Street. Map © Google.
Why this score? — see what drove the D- grade
The composite is a weighted blend of 9 inputs, each scored 0–100. Each bar is that input's sub-score; the figure is the points it added to the 100-point composite (weight × sub-score).
- Cash flow +13.4/30.0
- ARV discount +7.5/15.0
- DSCR +4.0/10.0
- Schools +3.9/10.0
- Livability +3.6/5.0
- 1% rule +2.5/10.0
- Rent growth +2.5/5.0
- Condition / age +2.5/5.0
- Appreciation +0.0/10.0
$309,000
🖨 Deal sheet 📄 Offer letter ✓ Due diligence
Listing remarks MLS
Welcome home to Edgewater, Florida! NEW ROOF 2022. Move in ready with NEW exterior and interior paint. New luxury vinyl plank making the space feel open and bright. The kitchen features new shaker cabinets, New granite countertops, New stainless steel range, microwave and dishwasher. Bathrooms have been upgraded with modern finishes. This home is close to schools, shopping, restaurants, river, ocean, beaches yes beaches and Interstate 95 making your commutes a breeze. Schedule your showing today. * * Seller to pay up to $5,000 towards closing costs or rate buydown with contract closing on or before 04/30/2023 * *
Key facts
- Updated kitchen
- Public boat ramps
- Indian river lagoon
Tags
Property features AI
Finance
- Other: Property type: Residential (Single Family Residence); Zoning: 07R-2B
- HOA & community: Not in a development; No HOA indicated
Exterior
- Parking: Attached garage; 2-car garage
- Utilities: Public water; Public sewer; Electricity connected; Cable connected
- Home design: Single family residence; One story; East-facing
- Construction: Frame construction; Shingle roof; Slab foundation; Built on a 0.23-acre lot
- Exterior features: Other exterior features; Asphalt road frontage; Lot dimensions approximately 80 x 125
Interior
- Kitchen: Dishwasher; Microwave; Range; Refrigerator
- Bedrooms: 3 bedrooms
- Flooring: Carpet; Ceramic tile
- Bathrooms: 2 full bathrooms
- Heating & cooling: Central heating; Central air conditioning
- Interior features: Open floorplan; Living room/dining room combo
- Laundry & utility: Washer hookup; Electric dryer hookup
Neighborhood map
What this means for you Summary
Snapshot
- This is a 3-bed/1.5-bath single-family listed at $309k.
Deal economics
- At list price, monthly cash flow is $3 ($37/yr) — positive.
- The deal already cash-flows at list — no discount required.
- To meet the 1% rule (rent ≥ 1% of price), the offer needs to be $232k (24.9% below list).
- Recommended offer: $232k (24.9% below list) — sets the bar for 1% rule.
Location & tenants
- Location reads 72/100 on livability (#329 in FL) — a middle-class / working-renter tenant base. Strengths: cost of living A+, housing A+, health & safety A+; Watch: amenities D-, commute F.
- Volusia (suburban): math 44% / reading 49% proficiency, ranked #47 of 73 in FL (top 64%) — families likely to look elsewhere, expect single-tenant / working-renter base with shorter leases.
- Market conditions: 304 active listings in the ZIP; 13 comparable units currently listed for rent nearby; rentals at typical pace (median 23d on market — plan ~3-4 weeks tenant-placement turnaround); 3,402 units permitted in Volusia County in 2024 (681 in 5+ unit buildings).
- This rent runs 44% of the median local income ($64k/yr) — at the standard rent-burdened threshold; future hikes will face affordability resistance.
Forward outlook
- Local home prices are declining (-3.0%/yr); year-one equity from $2k of loan paydown is wiped out by about $9k of value loss. Plan a longer hold.
- Volusia County population projected at +19% by 2050 — long-run rental-demand tailwind backs the buy-and-hold thesis.
Negotiation context
- Only 2 days on market — expect competitive offers; lowballing is unlikely to land.
- 12 sale attempts since 9y ago with the ask held roughly flat each time — persistent listings suggest the price (not the market) is what's stuck; bring a comps-based counter.
Risks & watch-outs
- Climate carrying-cost: severe wind risk, 99% chance of damaging wind over 30y; extreme-heat days projected 7→22/yr by 2055 (HVAC capex compounding) — expect insurance premiums to compound above CPI over the hold.
Questions for the listing agent
- Is there a deadline driving the sale (1031 exchange, divorce, estate, relocation)? That informs how much negotiation room exists.
- The area grade is low — what's the realistic commute time and amenity access for the typical tenant pool here? Any planned neighborhood developments (good or bad) we should know about?
- What's the average days-on-market for RENTAL listings here right now (not sales)? A rising rental-DOM trend means longer vacancies and softer asking-rent achievability than the comps imply.
- What's the recent tenant-quality profile in this submarket — average credit score on applications, eviction rate, late-payment / NSF rate, and stable-employment percentage? A property-management company in the area should have these aggregated.
- How much new for-sale + rental construction is in the pipeline within 1–3 miles? Heavy new supply typically softens prices + rents 12–24 months out; constrained supply supports both.
Investment metrics
- 1% rule
- 0.75% ✗
- Cap rate
- 6.30%
- Cash-on-cash
- 0.04%
- DSCR
- 1.00
- GRM
- 11.1
CMA / ARV
No comps found within radius.
Projected returns pro-forma
-3.0% appreciation · 3.0% rent growth · sell at horizon
- IRR
- -16.3%
- Equity multiple
- 0.42×
- Total profit
- $-50,027
- Equity at exit
- $46,073
- IRR
- -8.1%
- Equity multiple
- 0.49×
- Total profit
- $-43,929
- Equity at exit
- $26,717
Cash invested: $86,520 (down + closing). Projections, not guarantees.
Landlord ↔ Tenant lean methodology
- Overall (STATE)
- 87 Strongly Landlord-Friendly
- State Florida
- 87 Strongly Landlord-Friendly · R+3
- County
- — inherits STATE
- City
- — inherits STATE
ZIP-level market 32141
- Home prices YoY
- -19.2%
- Active inventory
- 304
- Price-to-rent
- 11.1×
Monthly cashflow live
- Estimated rent
- $2,320 high interval (Pro) →
- Mortgage (P&I)
- −$1,620
- Tax from tax record
- −$80 /mo · $965/yr
- Insurance
- −$129
- HOA
- −$0
- Vacancy / Maint / Mgmt
- −$487
- Net cashflow
- $3
Break-even live
UW: 25.0% down · 7.5% · 30yr · 1.5% tax · 5.0% vac · 8.0% maint · 8.0% mgmt
Financing live
Cash to close
- Down payment
- $77,250
- Closing costs
- $9,270
- Reserves months
- —
- Total cash needed
- —
Loan-product check · same deal, 3 products live
Conventional
25% down · 7.5% · 30yr
- Down + closing
- —
- Monthly P&I
- —
- Monthly cashflow
- —
- DSCR
- —
- Eligible?
- —
Personal DTI + credit; lowest rate.
DSCR
20% down · 8.5% · 30yr
- Down + closing
- —
- Monthly P&I
- —
- Monthly cashflow
- —
- DSCR
- —
- Eligible?
- —
No personal income docs; deal must DSCR.
Hard money
10% down · 12.0% · 12mo
- Down + closing
- —
- Monthly P&I
- —
- Monthly cashflow
- —
- DSCR
- —
- Eligible?
- —
Short-term bridge; refi at stabilization.
Rent comps 13 comps
| Address | Beds | Baths | Sqft | Rent | $/sqft | DOM | Units | Dist |
|---|---|---|---|---|---|---|---|---|
| 2621 India Palm Dr Edgewater, FL | 3.0 | 2.0 | 1269 | $2,400 | $1.89 | 23d | 1 | 0.23mi |
| 2515 Fern Palm Dr Edgewater, FL | 3.0 | 2.0 | 1400 | $2,200 | $1.57 | 11d | 1 | 0.30mi |
| 226 Tree Branch Ln Edgewater, FL | 3.0 | 2.0 | 1514 | $2,350 | $1.55 | 14d | 1 | 0.42mi |
| 2421 India Palm Dr Edgewater, FL | 3.0 | 2.0 | 1358 | $2,150 | $1.58 | 18d | 1 | 0.44mi |
| 2314 Fern Palm Dr Unit 2314 Edgewater, FL | 2.0 | 2.0 | 1200 | $1,700 | $1.42 | 18d | 1 | 0.57mi |
| 3120 Juniper Dr Edgewater, FL | 3.0 | 2.0 | 1440 | $2,150 | $1.49 | 23d | 1 | 0.68mi |
| 2827 Royal Palm Dr Edgewater, FL | 3.0 | 2.0 | 1212 | $1,900 | $1.57 | 23d | 1 | 0.71mi |
| 3119 Mango Tree Dr Edgewater, FL | 3.0 | 2.0 | 1714 | $2,345 | $1.37 | 21d | 1 | 0.75mi |
| 1000 Egret Ct Edgewater, FL | 2.0 | 2.0 | 1051 | $2,400 | $2.28 | 23d | 1 | 0.80mi |
| 2027 Guava Dr Unit 2029 Edgewater, FL | 4.0 | 2.0 | 1760 | $1,995 | $1.13 | 23d | 1 | 0.89mi |
| 3318 India Palm Dr Edgewater, FL | 2.0 | 2.0 | 1200 | $1,875 | $1.56 | 23d | 1 | 0.91mi |
| 2219 Umbrella Tree Dr Edgewater, FL | 3.0 | 2.0 | 1446 | $2,300 | $1.59 | 23d | 1 | 1.09mi |
| 3017 Vista Palm Dr Edgewater, FL | 3.0 | 3.0 | 1560 | $2,196 | $1.41 | 18d | 1 | 1.23mi |
Listing history 4 events
-
2026-06-03status $309,000 Pending 2 DOM
-
2026-06-02days on market $309,000 Active 2 DOM
-
2026-06-01remarks 693-char remark
-
2026-06-01$309,000 Active 1 DOM
ⓘ Source: listings_history table (triggers on properties + properties_extension) + one-shot
backfill from property_details.listing_events for pre-trigger history.
Tax reassessment forecast FL · Resets to sale price
- Current annual tax
- $965 · $80/mo
- Projected year-2 tax
- $2,565 · $214/mo
- Expected delta
- +$1,599/yr (+$133/mo · 165.6%)
ⓘ Screening estimate from a state-policy table — verify with the county assessor before closing.
Climate risk First Street
- Flood 1/10 Low FEMA zone X (unshaded) · 0% chance over 30 yrs
- Wildfire 4/10 Moderate
- Heat 10/10 Extreme 7 d/yr ≥105°F today · 22 d/yr by 30 yrs out
- Wind 10/10 Extreme 99% chance of damaging wind over 30 yrs
- Air quality 2/10 Low 1 unhealthy d/yr today · 1 by 30 yrs out
Nearby sold comps map
Loading sold comps map…
Walkable amenities ~0.75 mi
Loading nearby amenities…
Taxation est. · year 1
- Rental income
- $27,839
- − Mortgage interest
- −$17,309
- − Property taxes
- −$965
- − Insurance
- −$1,545
- − Repairs & maintenance
- −$2,227
- − Management
- −$2,227
- − Depreciation
- −$8,989
- Taxable loss
- −$5,424
- Est. tax savings @ 24.0%
- +$1,302
- After-tax cash flow
- $1,339/yr
For passive investors: Depreciation is non-cash, so a rental often shows a tax loss while cash-flowing — sheltering income. Rental losses are passive: they offset passive income freely, and up to $25,000/yr can offset ordinary (W-2) income if you actively participate and your MAGI is under $100k (phasing out to $0 by $150k); unused losses carry forward. On sale, claimed depreciation is recaptured at up to 25%, and gains may owe capital-gains tax (a 1031 exchange can defer both). Figures are a year-1 estimate at your 24.0% rate — not tax advice; consult a CPA.
Schools (NCES district)
- District
- Volusia
- NCES district ID
- 1201920
- Math proficiency
- 44% ▼ -9.00%
- Reading proficiency
- 49% ▼ -3.00%
- Median HH income
- $42,946
- Composite
- 39.2/100
- National rank
- #4019
- State rank
- #47 of 73 in FL
Livability — Edgewater
- Score
- 72/100
- State rank
- #329
- US rank
- #5753
Category grades
Schools grade is shown separately in the Schools card above.
Census & demographics
- Census place
- Edgewater, FL
- County
- Volusia County · 556,871 people
- City population
- 18,726
- Metro
- Deltona-Daytona Beach-Ormond Beach, FL
- Population (ZIP)
- 18,726
- Household income
- $63,936
- Rent vs Own
- Severe rent burden
- 161.0
Population outlook (Volusia County) Hauer SSP2
- Today (2025)
- 572,749 people
- By 2030
- 598,695 · +4.5%
- By 2040
- 644,880 · +12.6%
- By 2050
- 681,451 · +19.0%
- By 2075
- 759,957 · +32.7%
- By 2100
- 778,902 · +36.0%
Race, ethnicity, and origin ACS 2023
- Neighborhood character
- Predominantly White (90%)
- Race & ethnicity
- White 90% Hispanic / Latino 4% Two or more races 3% Black 2%
- Common ancestry
- Romanian 6% Lithuanian 2% Slovak 1%
- Foreign-born
- 4% · Canada
- Languages at home
- 94% English-only · Spanish 2% Other Indo-European 2% German/W. Germanic 1%
Political lean MEDSL · Volusia
- 2024 margin
- Strong R (+21.8) · D 38.7% · R 60.5%
- 2008→2024 swing
- -27.4pp toward R · 2008: 5.7pp · 2024: -21.8pp
- All cycles
- 2024: R+21.8 2020: R+14.1 2016: R+13.1 2012: R+1.2 2008: D+5.7
Not yet ingested
- Civics
- —
Market trends
- HPI YoY
- ▼ -80.12%
- Current HPI
- 337.8301
- Rent YoY
- —
- Metro
- Deltona-Daytona Beach-Ormond Beach, FL
- State GDP YoY
- ▲ 3.28%
- F500 in state
- 36
Industry mix (Fortune 500 HQ in FL)
| Industry | F500 HQs | Revenue |
|---|---|---|
| Industrial Technology | 2 | $29B |
|
||
| Insurance | 2 | $17B |
|
||
| Retail | 1 | $60B |
|
||
| Technology Distribution | 1 | $58B |
|
||
| Homebuilding | 1 | $35B |
|
||
| Technology Manufacturing | 1 | $35B |
|
||
Price history
+505.9% since first listed53 events — show timeline
- 2026-05-31 Listed $309,000 Stellar MLS as Distributed by MLS Grid
- 2026-02-18 Listing Removed — Stellar MLS as Distributed by MLS Grid
- 2026-01-17 Price Changed $309,900 Stellar MLS as Distributed by MLS Grid
- 2025-11-29 Price Changed $319,900 Stellar MLS as Distributed by MLS Grid
- 2025-09-13 Listed $335,000 Stellar MLS as Distributed by MLS Grid
- 2023-08-14 Sold (Public Records) $285,000 Public Records
- 2023-03-23 Sold (Public Records) $265,000 Public Records
- 2023-03-22 Sold (MLS) $265,000 NSBMLS
- 2023-03-22 Sold (MLS) $265,000 Stellar MLS as Distributed by MLS Grid
- 2023-03-22 Sold (MLS) $265,000 Stellar MLS as Distributed by MLS Grid
- 2023-03-22 Sold (MLS) $265,000 Daytona MLS
- 2023-03-13 Contingent — NSBMLS
- 2023-03-13 Pending — Daytona MLS
- 2023-03-13 Pending — Stellar MLS as Distributed by MLS Grid
- 2023-03-10 Price Changed $274,900 Daytona MLS
- 2023-03-10 Price Changed $274,900 NSBMLS
- 2023-03-10 Price Changed $274,900 Stellar MLS as Distributed by MLS Grid
- 2023-02-28 Price Changed $279,900 Daytona MLS
- 2023-02-17 Listed $279,900 NSBMLS
- 2023-02-17 Listed $274,900 Stellar MLS as Distributed by MLS Grid
- 2023-02-16 Price Changed $279,900 Stellar MLS as Distributed by MLS Grid
- 2023-02-14 Relisted — Stellar MLS as Distributed by MLS Grid
- 2023-02-09 Pending — Stellar MLS as Distributed by MLS Grid
- 2023-01-23 Price Changed $289,900 Daytona MLS
- 2023-01-20 Price Changed $289,900 Stellar MLS as Distributed by MLS Grid
- 2023-01-08 Price Changed $298,900 Daytona MLS
- 2023-01-07 Price Changed $298,900 Stellar MLS as Distributed by MLS Grid
- 2022-12-01 Price Changed $299,900 Daytona MLS
- 2022-12-01 Price Changed $299,900 Stellar MLS as Distributed by MLS Grid
- 2022-10-21 Price Changed $309,900 Daytona MLS
- 2022-10-21 Price Changed $309,900 Stellar MLS as Distributed by MLS Grid
- 2022-09-22 Price Changed $319,900 Daytona MLS
- 2022-09-21 Price Changed $319,900 Stellar MLS as Distributed by MLS Grid
- 2022-08-19 Listed $329,900 Stellar MLS as Distributed by MLS Grid
- 2022-08-19 Listed $329,900 Daytona MLS
- 2022-06-30 Sold (Public Records) $303,500 Public Records
- 2017-12-26 Sold (Public Records) $148,000 Public Records
- 2017-12-21 Sold (MLS) $148,000 Stellar MLS as Distributed by MLS Grid
- 2017-12-21 Sold (MLS) $148,000 NSBMLS
- 2017-12-21 Sold (MLS) $148,000 Daytona MLS
- 2017-12-19 Pending — Daytona MLS
- 2017-12-19 Contingent — NSBMLS
- 2017-10-19 Listed $149,900 Daytona MLS
- 2017-10-18 Relisted — NSBMLS
- 2017-10-18 Delisted — NSBMLS
- 2017-10-18 Listing Removed — Daytona MLS
- 2017-09-22 Price Changed $149,900 NSBMLS
- 2017-09-21 Price Changed $149,900 Daytona MLS
- 2017-07-19 Listed $159,900 Daytona MLS
- 2017-07-19 Listed $159,900 NSBMLS
- 2017-07-18 Listed $149,900 Stellar MLS as Distributed by MLS Grid
- 1990-10-01 Sold (Public Records) $42,300 Public Records
- 1985-03-01 Sold (Public Records) $51,000 Public Records
Property tax history
-5.4%/yrLatest (2025): $965 · +1.9% YoY. Source: county tax records.
Cash-flow waterfall
monthlySold comps — $/sqft
last 12 mo · ≤1 miLoading sold comps…