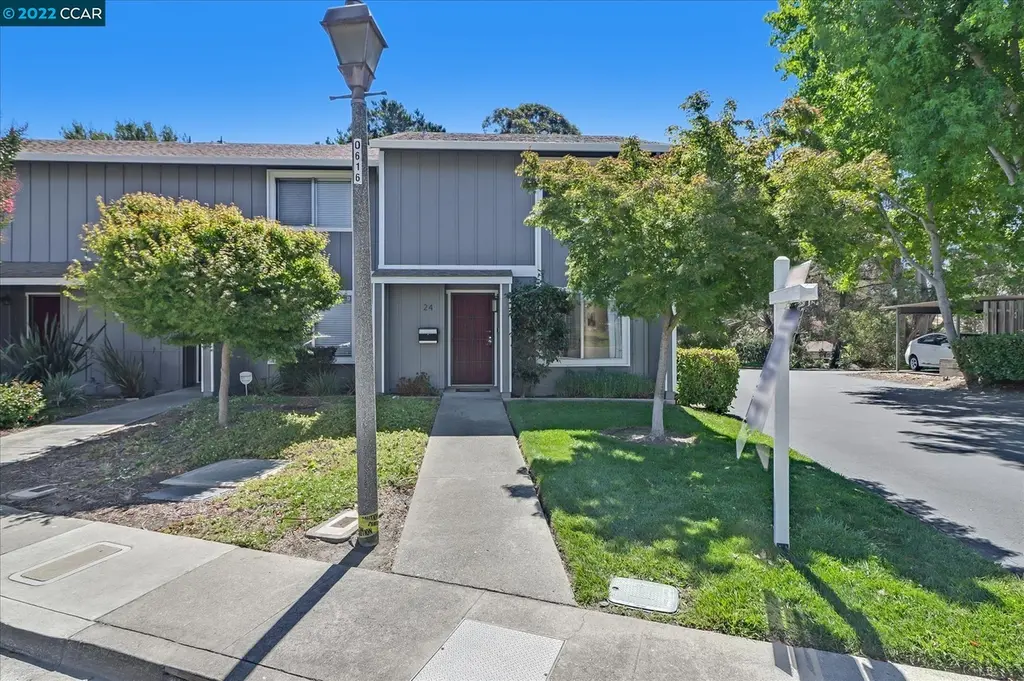
24 Park Ln · Richmond, CA
Flood risk 1/10 · Minimal
- FEMA flood zone
- X (unshaded)
- Chance of flooding over 30 yrs
- 0.0%
- Est. flood insurance / yr
- $507 – $1,088
Fire risk 2/10 · Minimal
- Est. fire insurance / yr
- $659 – $1,223
Heat risk 3/10 · Minor
- Hot days now (above 88°F)
- 7 days/yr
- Hot days in 30 yrs
- 14 days/yr
Wind risk 1/10 · Minimal
- Chance of severe wind over 30 yrs
- —
Air-quality risk 8/10 · Major
- Unhealthy air days now
- 15 days/yr
- Unhealthy air days in 30 yrs
- 15 days/yr
Risk factors via First Street. Map © Google.
Why this score? — see what drove the D grade
The composite is a weighted blend of 9 inputs, each scored 0–100. Each bar is that input's sub-score; the figure is the points it added to the 100-point composite (weight × sub-score).
- Cash flow +15.0/30.0
- ARV discount +7.5/15.0
- 1% rule +5.0/10.0
- DSCR +5.0/10.0
- Livability +3.1/5.0
- Schools +3.0/10.0
- Rent growth +2.5/5.0
- Condition / age +2.5/5.0
- Appreciation +0.0/10.0
$3,200
🖨 Deal sheet 📄 Offer letter ✓ Due diligence
Listing remarks MLS
Spacious and impeccably clean END unit townhome in the highly sought after Hilltop Green community. The 2-story quiet and bright townhome features laminate floors throughout, fresh interior paint, granite kitchen countertops, stainless steel appliances and pantry in the kitchen, remodeled bathrooms, and an inside full-size laundry room. The oversized bedrooms are located upstairs and offer walk-in and ample closet spaces. The relaxing and private patio is conveniently located next to the covered carport spaces assigned to the unit. Do not miss the excellent community amenities such as a gleaming swimming pool, spa, clubhouse, tennis and basketball courts, playground and greenbelt. The home is strategically located in close proximity to downtown, parks, Pinole Vista Shopping Center, restaurants and easy commute routes.
Key facts
- Modern appliances
- Modern amenities
- Close to shopping
Tags
Property features AI
Finance
- HOA & community: No homeowners association; Not a senior community
Exterior
- Parking: Covered parking; Guest parking available
- Utilities: Natural gas connected; Public sewer
- Home design: Residential condominium; Updated/remodeled; Two stories
- Construction: No ADU/second unit
- Exterior features: Front landscaping and additional landscape features; Curbs and gutters; No private pool or spa; Does not allow horses
Interior
- Kitchen: Free standing electric range; Gas water heater
- Bedrooms: 2 bedrooms (located on the upper level)
- Bathrooms: 2 bathrooms total — 1 full bath and 1 partial bath
- Heating & cooling: Central heating; Central air conditioning
- Interior features: Updated/remodeled condition; Two-story layout; No basement
- Laundry & utility: Washer/dryer hookups only
Neighborhood map
What this means for you Summary
Snapshot
- This is a 2-bed/2.0-bath condo listed at $3k.
Deal economics
- At list price, monthly cash flow is $2k ($22k/yr) — positive.
- The deal already cash-flows at list — no discount required.
- Meets the 1% rule at list price ($3k rent vs $3k).
- Cap rate 685.3% vs local median 2.7% in Richmond — top-decile yield for the area; either an underpriced asset or a hidden risk that comps aren't pricing in. Stress-test before assuming the spread holds.
Location & tenants
- Location reads 62/100 on livability (#497 in CA) — a middle-class / working-renter tenant base. Strengths: commute A+, employment A, health & safety B+; Watch: schools F, crime F, amenities F.
- West Contra Costa Unified (suburban): math 24% / reading 35% proficiency, ranked #993 of 1,400 in CA (top 71%) — low school quality limits family demand, transient renter base, plan for 1-2y turnover.
- Market conditions: 88 active listings in the ZIP; 30 comparable units currently listed for rent nearby; rentals at typical pace (median 24d on market — plan ~3-4 weeks tenant-placement turnaround); high-income renter base; 2,169 units permitted in Contra Costa County in 2024 (896 in 5+ unit buildings).
Forward outlook
- Local home prices are declining (-3.0%/yr); year-one equity from $22 of loan paydown is wiped out by about $96 of value loss. Plan a longer hold.
- Contra Costa County population projected at +26% by 2050 — long-run rental-demand tailwind backs the buy-and-hold thesis.
- At projected returns (-3.0% appreciation + 3.0% rent growth), your $896 cash investment doubles in ~1 year — after that, you're playing with house money.
Negotiation context
- Only 2 days on market — expect competitive offers; lowballing is unlikely to land.
- 5 sale attempts since 26y ago; this cycle's ask is 7% above the opening price — seller raised mid-cycle; expect resistance to lowballs.
Questions for the listing agent
- Built in 1972 — when were the roof, HVAC, electrical panel, plumbing, and water heater last replaced?
- What does the HOA fee cover, when was the last increase, and are there any pending special assessments or reserve-fund shortfalls?
- Any open or pending special assessments — roof, HVAC, plumbing, elevator, façade? What's the per-unit balance and payoff schedule, and is the seller paying it off at close or rolling it to the buyer?
- Is there a deadline driving the sale (1031 exchange, divorce, estate, relocation)? That informs how much negotiation room exists.
- Schools are F-rated, which usually means shorter tenancies and higher turnover. Who's the typical renter profile here, and what's been the actual vacancy rate?
- Crime grade is F in this area — have there been break-ins, vandalism, or insurance claims at this property in the last 3 years? What carrier currently insures it and at what premium?
- The area grade is low — what's the realistic commute time and amenity access for the typical tenant pool here? Any planned neighborhood developments (good or bad) we should know about?
- What's the average days-on-market for RENTAL listings here right now (not sales)? A rising rental-DOM trend means longer vacancies and softer asking-rent achievability than the comps imply.
- What's the recent tenant-quality profile in this submarket — average credit score on applications, eviction rate, late-payment / NSF rate, and stable-employment percentage? A property-management company in the area should have these aggregated.
- How much new apartment / multifamily construction is in the pipeline within 1–3 miles? Heavy new supply (>2% of stock underway) typically softens rents 12–24 months out; light construction supports rent growth.
Investment metrics
- 1% rule
- 88.56% ✓
- Cap rate
- 685.25%
- Cash-on-cash
- 2424.86%
- DSCR
- 108.89
- GRM
- 0.1
CMA / ARV
No comps found within radius.
Projected returns pro-forma
-3.0% appreciation · 3.0% rent growth · sell at horizon
- IRR
- —
- Equity multiple
- 129.45×
- Total profit
- $115,090
- Equity at exit
- $477
- IRR
- —
- Equity multiple
- 279.90×
- Total profit
- $249,893
- Equity at exit
- $277
Cash invested: $896 (down + closing). Projections, not guarantees.
Landlord ↔ Tenant lean methodology
- Overall (STATE)
- 18 Strongly Tenant-Friendly
- State California
- 18 Strongly Tenant-Friendly · D+13
- County
- — inherits STATE
- City
- — inherits STATE
ZIP-level market 94803
- Active inventory
- 88
- Price-to-rent
- 0.1×
Monthly cashflow live
- Estimated rent
- $2,834 high interval (Pro) →
- Mortgage (P&I)
- −$17
- Tax est. 1.5%
- −$4 /mo · $48/yr
- Insurance
- −$1
- HOA est. from 2 same-building comps
- −$406
- Vacancy / Maint / Mgmt
- −$595
- Net cashflow
- $1,811
Break-even live
UW: 25.0% down · 7.5% · 30yr · 1.5% tax · 5.0% vac · 8.0% maint · 8.0% mgmt
Financing live
Cash to close
- Down payment
- $800
- Closing costs
- $96
- Reserves months
- —
- Total cash needed
- —
Loan-product check · same deal, 3 products live
Conventional
25% down · 7.5% · 30yr
- Down + closing
- —
- Monthly P&I
- —
- Monthly cashflow
- —
- DSCR
- —
- Eligible?
- —
Personal DTI + credit; lowest rate.
DSCR
20% down · 8.5% · 30yr
- Down + closing
- —
- Monthly P&I
- —
- Monthly cashflow
- —
- DSCR
- —
- Eligible?
- —
No personal income docs; deal must DSCR.
Hard money
10% down · 12.0% · 12mo
- Down + closing
- —
- Monthly P&I
- —
- Monthly cashflow
- —
- DSCR
- —
- Eligible?
- —
Short-term bridge; refi at stabilization.
Rent comps 30 comps
| Address | Beds | Baths | Sqft | Rent | $/sqft | DOM | Units | Dist |
|---|---|---|---|---|---|---|---|---|
| 24 Park Ln El Sobrante, CA | 2.0 | 1.5 | 1080 | $3,200 | $2.96 | 2d | 1 | 0.03mi |
| 934 Appian Way El Sobrante, CA | 3.0 | 1.0 | 835 | $2,995 | $3.59 | 5d | 1 | 0.58mi |
| 760 Alhambra Rd El Sobrante, CA | 2.0 | 1.0 | 725 | $2,150 | $2.97 | 24d | 1 | 0.58mi |
| 4763 Appian Way Unit 09 El Sobrante, CA | 2.0 | 1.5 | 1000 | $2,500 | $2.50 | 24d | 1 | 0.66mi |
| 450 Corte Arango Unit 1 El Sobrante, CA | 2.0 | 1.5 | 800 | $1,900 | $2.38 | 43d | 1 | 0.66mi |
| 507 Chabre Ct El Sobrante, CA | 2.0 | 2.5 | 1248 | $2,695 | $2.16 | 12d | 1 | 0.67mi |
| 507 Chabre Ct El Sobrante, CA | 2.0 | 2.5 | 1248 | $2,695 | $2.16 | 43d | 1 | 0.67mi |
| 4811 Appian Way Unit 4/3 El Sobrante, CA | 2.0 | 1.5 | 960 | $2,200 | $2.29 | 20d | 1 | 0.68mi |
| 6000 Sunhill Cir El Sobrante, CA | 1.0–2.0 | 1.0–2.0 | 950 | $3,045 | $3.21 | 3d | 3 | 0.69mi |
| 4827 Appian Way El Sobrante, CA | 2.0 | 1.5 | 1020 | $2,225 | $2.18 | 43d | 1 | 0.70mi |
| 4861 Appian Way Unit 8 El Sobrante, CA | 2.0 | 1.0 | 725 | $1,795 | $2.48 | 22d | 1 | 0.70mi |
| 4861 Appian Way El Sobrante, CA | 2.0 | 1.0 | 725 | $1,795 | $2.48 | 5d | 1 | 0.70mi |
| 4861 Appian Way Unit 7 El Sobrante, CA | 2.0 | 1.0 | 725 | $1,795 | $2.48 | 43d | 1 | 0.70mi |
| 5071 Appian Way El Sobrante, CA | 2.0 | 1.0 | 800 | $2,195 | $2.74 | 43d | 1 | 0.76mi |
| 3185 Garrity Way Richmond, CA | 1.0–2.0 | 1.0–2.0 | 967 | $3,620 | $3.74 | 1d | 17 | 0.77mi |
| 458 Valley View Rd Apt 5 El Sobrante, CA | 2.0 | 1.0 | 800 | $2,575 | $3.22 | 43d | 1 | 0.80mi |
| 4481 Appian Way El Sobrante, CA | 1.0–2.0 | 1.0–1.5 | 750 | $3,033 | $4.04 | 24d | 2 | 0.84mi |
| 4474 Appian Way Unit 14 El Sobrante, CA | 2.0 | 1.0 | 750 | $2,250 | $3.00 | 2d | 1 | 0.88mi |
| 3078 Deseret Dr Richmond, CA | 3.0 | 2.0 | 1150 | $3,500 | $3.04 | 22d | 1 | 0.98mi |
| 3078 Deseret Dr Richmond, CA | 3.0 | 2.0 | 1150 | $3,500 | $3.04 | 24d | 1 | 0.98mi |
| 2689 Limerick Rd San Pablo, CA | 3.0 | 2.0 | 1170 | $3,650 | $3.12 | 43d | 1 | 1.01mi |
| 3400 Richmond Pkwy San Pablo, CA | 1.0–2.0 | 1.0–2.0 | 906 | $2,417 | $2.67 | 1d | 67 | 1.03mi |
| 1588 Ridgecrest Rd Pinole, CA | 3.0 | 2.0 | 1044 | $3,050 | $2.92 | 24d | 1 | 1.03mi |
| 4001 Mozart Dr El Sobrante, CA | 3.0 | 2.0 | 1357 | $3,499 | $2.58 | 5d | 1 | 1.22mi |
| 3535 El Portal Dr El Sobrante, CA | 1.0–3.0 | 1.0–3.0 | 969 | $3,212 | $3.31 | 1d | 16 | 1.30mi |
| 1252 Marionola Way Pinole, CA | 3.0 | 1.5 | 1167 | $3,195 | $2.74 | 43d | 1 | 1.30mi |
| 4067 Wesley Way El Sobrante, CA | 3.0 | 2.0 | 1245 | $3,900 | $3.13 | 10d | 1 | 1.34mi |
| 2633 Rim Rd San Pablo, CA | 3.0 | 2.0 | 1187 | $3,500 | $2.95 | 43d | 1 | 1.36mi |
| 3643 West Ct Unit 1546418P Richmond, CA | 1.0 | 1.0 | 807 | $2,294 | $2.84 | 12d | 1 | 1.48mi |
| 3614 Stoneglen S San Pablo, CA | 2.0 | 2.0 | 1176 | $2,395 | $2.04 | 43d | 1 | 1.50mi |
HOA detail condo
- Monthly dues
- $0 · $0/yr
- Likely covers
- pool
- Assessments
- None detected in remarks — confirm with the listing agent.
Listing history 2 events
-
2026-06-13remarks 175-char remark
-
2026-06-13$3,200 Active 2 DOM
ⓘ Source: listings_history table (triggers on properties + properties_extension) + one-shot
backfill from property_details.listing_events for pre-trigger history.
Climate risk First Street
- Flood 1/10 Low FEMA zone X (unshaded) · 0% chance over 30 yrs
- Wildfire 2/10 Low
- Heat 3/10 Moderate 7 d/yr ≥88°F today · 14 d/yr by 30 yrs out
- Wind 1/10 Low
- Air quality 8/10 Severe 15 unhealthy d/yr today · 15 by 30 yrs out
Nearby sold comps map
Loading sold comps map…
Walkable amenities ~0.75 mi
Loading nearby amenities…
Taxation est. · year 1
- Rental income
- $34,005
- − Mortgage interest
- −$179
- − Property taxes
- −$48
- − Insurance
- −$16
- − Repairs & maintenance
- −$2,720
- − Management
- −$2,720
- − HOA
- −$4,872
- − Depreciation
- −$93
- Taxable income
- $23,356
- Est. tax owed @ 24.0%
- −$5,605
- After-tax cash flow
- $16,121/yr
For passive investors: Depreciation is non-cash, so a rental often shows a tax loss while cash-flowing — sheltering income. Rental losses are passive: they offset passive income freely, and up to $25,000/yr can offset ordinary (W-2) income if you actively participate and your MAGI is under $100k (phasing out to $0 by $150k); unused losses carry forward. On sale, claimed depreciation is recaptured at up to 25%, and gains may owe capital-gains tax (a 1031 exchange can defer both). Figures are a year-1 estimate at your 24.0% rate — not tax advice; consult a CPA.
Schools (NCES district)
- District
- West Contra Costa Unified
- NCES district ID
- 0632550
- Math proficiency
- 24% ▲ 1.00%
- Reading proficiency
- 35% ▲ 1.00%
- Median HH income
- $64,837
- Composite
- 30.04/100
- National rank
- #11623
- State rank
- #993 of 1400 in CA
Livability — Richmond
- Score
- 62/100
- State rank
- #497
- US rank
- #16759
Category grades
Schools grade is shown separately in the Schools card above.
Census & demographics
- Census place
- Richmond, CA
- County
- Contra Costa County · 1,059,880 people
- City population
- 183,357
- Metro
- San Francisco-Oakland-Berkeley, CA
- Population (ZIP)
- 27,659
- Household income
- $118,447
- Rent vs Own
- Severe rent burden
- 613.0
Population outlook (Contra Costa County) Hauer SSP2
- Today (2025)
- 1,287,720 people
- By 2030
- 1,364,937 · +6.0%
- By 2040
- 1,506,209 · +17.0%
- By 2050
- 1,624,373 · +26.1%
- By 2075
- 1,853,193 · +43.9%
- By 2100
- 1,901,231 · +47.6%
Race, ethnicity, and origin ACS 2023
- Neighborhood character
- Highly diverse neighborhood (Simpson 0.77)
- Race & ethnicity
- Hispanic / Latino 30% White 27% Asian 23% Two or more races 18% Black 12%
- Hispanic origin (detail)
- Mexican 18%
- Common ancestry
- Italian 3% Iranian 1% Lithuanian 1%
- Foreign-born
- 32% · Canada, China, South Korea
- Languages at home
- 57% English-only · Spanish 23% Other Indo-European 7% Tagalog/Filipino 4%
Political lean MEDSL · Contra Costa
- 2024 margin
- Solid D (+38.0) · D 67.3% · R 29.4% · Other 3.3%
- 2008→2024 swing
- +0.2pp no change · 2008: 37.8pp · 2024: 38.0pp
- All cycles
- 2024: D+38.0 2020: D+45.3 2016: D+43.5 2012: D+33.7 2008: D+37.8
Not yet ingested
- Civics
- —
Market trends
- HPI YoY
- ▼ -531.44%
- Current HPI
- 274.5772
- Rent YoY
- —
- Metro
- San Francisco-Oakland-Berkeley, CA
- State GDP YoY
- ▲ 3.21%
- F500 in state
- 116
Industry mix (Fortune 500 HQ in CA)
| Industry | F500 HQs | Revenue |
|---|---|---|
| Technology | 27 | $1,492B |
|
||
| Financial Services | 3 | $174B |
|
||
| Retail | 3 | $44B |
|
||
| Insurance | 3 | $26B |
|
||
| Media / Entertainment | 2 | $115B |
|
||
| Pharmaceuticals / Biotech | 2 | $62B |
|
||
Price history
-86.7% since first listed20 events — show timeline
- 2026-06-11 Price Changed $3,200 BAREIS
- 2026-06-11 Listed $3,000 BAREIS
- 2022-08-26 Sold (Public Records) $450,000 Public Records
- 2022-08-26 Sold (MLS) $450,000 bridgeMLS, Bay East AOR, or Contra Costa AOR
- 2022-08-12 Pending — bridgeMLS, Bay East AOR, or Contra Costa AOR
- 2022-08-11 Price Changed $465,000 bridgeMLS, Bay East AOR, or Contra Costa AOR
- 2022-07-10 Listed $475,000 bridgeMLS, Bay East AOR, or Contra Costa AOR
- 2020-05-21 Sold (Public Records) $360,000 Public Records
- 2020-05-21 Sold (MLS) $360,000 bridgeMLS, Bay East AOR, or Contra Costa AOR
- 2020-04-09 Pending — bridgeMLS, Bay East AOR, or Contra Costa AOR
- 2020-03-23 Listed $369,900 bridgeMLS, Bay East AOR, or Contra Costa AOR
- 2001-07-13 Sold (Public Records) $185,000 Public Records
- 2001-07-13 Sold (MLS) $185,000 bridgeMLS, Bay East AOR, or Contra Costa AOR
- 2001-06-14 Listing Removed — bridgeMLS, Bay East AOR, or Contra Costa AOR
- 2001-06-04 Listed $180,000 bridgeMLS, Bay East AOR, or Contra Costa AOR
- 2000-11-20 Sold (Public Records) $165,000 Public Records
- 2000-11-20 Sold (MLS) $165,000 bridgeMLS, Bay East AOR, or Contra Costa AOR
- 2000-09-23 Listing Removed — bridgeMLS, Bay East AOR, or Contra Costa AOR
- 2000-09-10 Listed $155,000 bridgeMLS, Bay East AOR, or Contra Costa AOR
- 1972-09-15 Sold (Public Records) $24,000 Public Records
Property tax history
+5.5%/yrLatest (2025): $7,855 · +2.3% YoY. Source: county tax records.
Cash-flow waterfall
monthlySold comps — $/sqft
last 12 mo · ≤1 miLoading sold comps…