14256 Star Cactus Ave · Horizon City, TX
Flood risk No data
- FEMA flood zone
- —
- Chance of flooding over 30 yrs
- —
- Est. flood insurance / yr
- —
Fire risk No data
- Est. fire insurance / yr
- —
Heat risk No data
- Hot days now (above threshold)
- —
- Hot days in 30 yrs
- —
Wind risk No data
- Chance of severe wind over 30 yrs
- —
Air-quality risk No data
- Unhealthy air days now
- —
- Unhealthy air days in 30 yrs
- —
Risk factors via First Street. Map © Google.
Why this score? — see what drove the D grade
The composite is a weighted blend of 9 inputs, each scored 0–100. Each bar is that input's sub-score; the figure is the points it added to the 100-point composite (weight × sub-score).
- Cash flow +13.0/30.0
- ARV discount +7.5/15.0
- Condition / age +4.0/5.0
- DSCR +3.9/10.0
- 1% rule +3.7/10.0
- Livability +3.3/5.0
- Rent growth +3.2/5.0
- Schools +1.5/10.0
- Appreciation +0.0/10.0
$216,800
🖨 Deal sheet (PDF) 📄 Offer letter ✓ Due diligence
Listing remarks
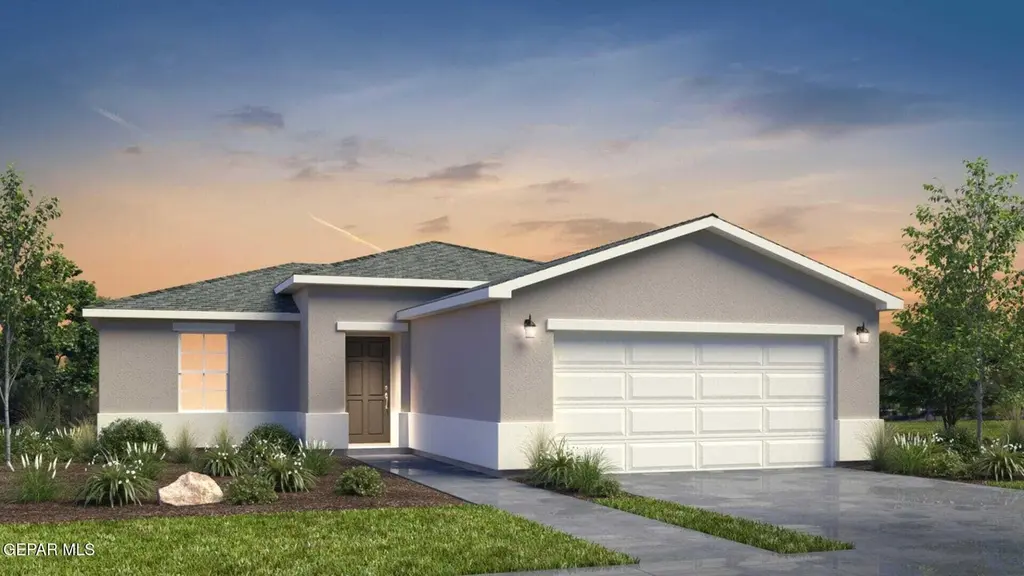
The Katy floorplan offers the perfect combination of space, privacy, and comfort. With a layout designed to keep daily life simple and functional, this home is ideal for families, couples, or first-time buyers looking for an affordable and efficient design.
Key facts
- 6,325 sq ft lot
- 2 garage spots
- Built 2026
Property features AI
Exterior
- Home design: Single family residence
- Construction: Built as new construction
- Exterior features: Walled backyard; Shingle roof; Stucco exterior
Interior
- Kitchen: Dishwasher; Disposal; Microwave
- Flooring: Tile; Carpet
- Bathrooms: 2 full bathrooms
- Heating & cooling: Central heating; Refrigerated cooling
- Interior features: Ceiling fan(s); Double pane windows
Neighborhood map
What this means for you Summary
Snapshot
- This is a 3-bed/2.0-bath single-family listed at $217k. Condition is rated good.
Deal economics
- At list price, monthly cash flow is $-13 ($-160/yr) — negative.
- To cash-flow at today's rent, offer at most $215k (0.9% below list).
- To meet the 1% rule (rent ≥ 1% of price), the offer needs to be $188k (13.3% below list).
- Recommended offer: $188k (13.3% below list) — sets the bar for 1% rule.
Location & tenants
- Location reads 66/100 on livability (#619 in TX) — a middle-class / working-renter tenant base. Strengths: crime A+, cost of living A+, housing A+; Watch: employment D, amenities F, commute F.
- Clint ISD (suburban): math 14% / reading 22% proficiency, ranked #792 of 826 in TX (top 96%) — low school quality limits family demand, transient renter base, plan for 1-2y turnover.
- Zoned schools: Ricardo Estrada Middle (math 15% / reading 16%, grade F, #1,556 of 1,662 statewide, top 94%, 518 students, 91% FRL); Horizon H S (math 14% / reading 26%, grade F, #1,397 of 1,632 statewide, top 87%, 1,677 students, 85% FRL) — zoned schools average 88% FRL vs 59% district-wide (29 pts higher); higher-poverty schools than district average — tighter screening recommended.
- Market conditions: Rents rising (+2.9%/yr); 2088 active listings in the ZIP; 7 comparable units currently listed for rent nearby; rentals leasing fast (median 11d on market — plan ~1-2 weeks tenant-placement turnaround); solid renter incomes; 2,196 units permitted in El Paso County in 2024 (143 in 5+ unit buildings).
Forward outlook
- Local home prices are declining (-3.0%/yr); year-one equity from $1k of loan paydown is wiped out by about $7k of value loss. Plan a longer hold.
- El Paso County population projected at +10% by 2050 — modest demand growth; plan on rents tracking national, not racing it.
Negotiation context
- It's been on market 29 days — a 2% lower offer ($214k) is reasonable based on typical stale-listing flexibility.
Questions for the listing agent
- What do current leases actually rent for vs. the listed asking? Can we see a recent rent roll and the last 12 months of T-12 income?
- Is there a deadline driving the sale (1031 exchange, divorce, estate, relocation)? That informs how much negotiation room exists.
- Schools are D-rated, which usually means shorter tenancies and higher turnover. Who's the typical renter profile here, and what's been the actual vacancy rate?
- The area grade is low — what's the realistic commute time and amenity access for the typical tenant pool here? Any planned neighborhood developments (good or bad) we should know about?
- What's the average days-on-market for RENTAL listings here right now (not sales)? A rising rental-DOM trend means longer vacancies and softer asking-rent achievability than the comps imply.
- What's the recent tenant-quality profile in this submarket — average credit score on applications, eviction rate, late-payment / NSF rate, and stable-employment percentage? A property-management company in the area should have these aggregated.
- How much new for-sale + rental construction is in the pipeline within 1–3 miles? Heavy new supply typically softens prices + rents 12–24 months out; constrained supply supports both.
Investment metrics
- 1% rule
- 0.87% ✗
- Cap rate
- 6.22%
- Cash-on-cash
- -0.26%
- DSCR
- 0.99
- GRM
- 9.6
CMA / ARV
No comps found within radius.
Projected returns pro-forma
-3.0% appreciation · 2.93% rent growth · sell at horizon
- IRR
- -16.8%
- Equity multiple
- 0.41×
- Total profit
- $-36,083
- Equity at exit
- $32,326
- IRR
- -8.7%
- Equity multiple
- 0.46×
- Total profit
- $-32,939
- Equity at exit
- $18,745
Cash invested: $60,704 (down + closing). Projections, not guarantees.
Landlord ↔ Tenant lean methodology
- Overall (STATE)
- 87 Strongly Landlord-Friendly
- State Texas
- 87 Strongly Landlord-Friendly · R+5
- County
- — inherits STATE
- City
- — inherits STATE
ZIP-level market 79928
- Home prices YoY
- -16.9%
- Rents YoY
- 2.9%
- Active inventory
- 2088
- Price-to-rent
- 9.6×
Monthly cashflow live
- Estimated rent
- $1,880 high interval (Pro) →
- Mortgage (P&I)
- −$1,137
- Tax est. 1.5%
- −$271 /mo · $3,252/yr
- Insurance
- −$90
- HOA
- −$0
- Vacancy / Maint / Mgmt
- −$395
- Net cashflow
- $-13
Break-even live
Sensitivity live
| Price | -10% $137 | -5% $62 | +0% $-13 | +5% $-88 | +10% $-163 |
|---|---|---|---|---|---|
| Rent | -10% $-162 | -5% $-88 | +0% $-13 | +5% $61 | +10% $135 |
| Rate | -1.0pp $96 | -0.5pp $42 | base $-13 | +0.5pp $-69 | +1.0pp $-127 |
UW: 25.0% down · 7.5% · 30yr · 1.5% tax · 5.0% vac · 8.0% maint · 8.0% mgmt
Financing live
Cash to close
- Down payment
- $54,200
- Closing costs
- $6,504
- Reserves months
- —
- Total cash needed
- —
Loan-product check · same deal, 3 products live
Conventional
25% down · 7.5% · 30yr
- Down + closing
- —
- Monthly P&I
- —
- Monthly cashflow
- —
- DSCR
- —
- Eligible?
- —
Personal DTI + credit; lowest rate.
DSCR
20% down · 8.5% · 30yr
- Down + closing
- —
- Monthly P&I
- —
- Monthly cashflow
- —
- DSCR
- —
- Eligible?
- —
No personal income docs; deal must DSCR.
Hard money
10% down · 12.0% · 12mo
- Down + closing
- —
- Monthly P&I
- —
- Monthly cashflow
- —
- DSCR
- —
- Eligible?
- —
Short-term bridge; refi at stabilization.
Rent comps 7 comps
| Address | Beds | Baths | Sqft | Rent | $/sqft | DOM | Units | Dist |
|---|---|---|---|---|---|---|---|---|
| 14361 Star Cactus Ave Horizon City, TX | 3.0 | 2.0 | 1170 | $1,600 | $1.37 | 11d | 1 | 0.01mi |
| 14333 Paraiso Dr El Paso, TX | 3.0 | 2.0 | 1224 | $2,000 | $1.63 | 3d | 1 | 0.13mi |
| 14269 Escalera Dr El Paso, TX | 3.0 | 2.0 | 1269 | $1,850 | $1.46 | 3d | 1 | 0.40mi |
| 14608 Adonis Blue Ct El Paso, TX | 3.0 | 2.5 | 1350 | $1,650 | $1.22 | 11d | 1 | 0.51mi |
| 14565 Hendrik Dr Unit B El Paso, TX | 2.0 | 1.0 | 970 | $900 | $0.93 | 3d | 1 | 1.04mi |
| 14624 Achim Dr El Paso, TX | 3.0 | 2.0 | 1422 | $1,500 | $1.05 | 11d | 1 | 1.15mi |
| 656 Orchid Dr Horizon City, TX | 3.0 | 2.0 | 1092 | $1,350 | $1.24 | 24d | 1 | 1.25mi |
Listing history 14 events
-
2026-06-18days on market $216,800 Active 29 DOM
-
2026-06-17days on market $216,800 Active 28 DOM
-
2026-06-16days on market $216,800 Active 27 DOM
-
2026-06-15days on market $216,800 Active 26 DOM
-
2026-06-13days on market $216,800 Active 24 DOM
-
2026-06-10days on market $216,800 Active 21 DOM
-
2026-06-09days on market $216,800 Active 20 DOM
-
2026-06-08days on market $216,800 Active 19 DOM
-
2026-06-07days on market $216,800 Active 18 DOM
-
2026-06-03days on market $216,800 Active 14 DOM
-
2026-06-03days on market $216,800 Active 13 DOM
-
2026-06-01days on market $216,800 Active 12 DOM
-
2026-05-31days on market $216,800 Active 11 DOM
-
2026-05-20$216,800 Active
ⓘ Source: listings_history table (triggers on properties + properties_extension) + one-shot
backfill from property_details.listing_events for pre-trigger history.
Nearby sold comps map
Loading sold comps map…
Walkable amenities ~0.75 mi
Loading nearby amenities…
Taxation est. · year 1
- Rental income
- $22,556
- − Mortgage interest
- −$12,144
- − Property taxes
- −$3,252
- − Insurance
- −$1,084
- − Repairs & maintenance
- −$1,804
- − Management
- −$1,804
- − Depreciation
- −$6,307
- Taxable loss
- −$3,840
- Est. tax savings @ 24.0%
- +$922
- After-tax cash flow
- $762/yr
For passive investors: Depreciation is non-cash, so a rental often shows a tax loss while cash-flowing — sheltering income. Rental losses are passive: they offset passive income freely, and up to $25,000/yr can offset ordinary (W-2) income if you actively participate and your MAGI is under $100k (phasing out to $0 by $150k); unused losses carry forward. On sale, claimed depreciation is recaptured at up to 25%, and gains may owe capital-gains tax (a 1031 exchange can defer both). Figures are a year-1 estimate at your 24.0% rate — not tax advice; consult a CPA.
Condition & rehab AI · 9 photos
This single-family home is in good condition with a modern floor plan and well-maintained exterior. It offers a good balance of space and privacy, making it ideal for families or first-time buyers. Potential value-adding updates include painting, landscaping, kitchen appliance upgrades, smart home features, and HVAC improvements.
Value-add opportunities
- Both Painting the exterior and interior walls — Fresh paint can enhance curb appeal and interior aesthetics.
- Both Landscaping improvements — Enhanced landscaping can increase curb appeal and property value.
- Resale Upgrading the kitchen appliances — Modern appliances can attract more buyers and renters.
- Both Adding smart home features — Smart home features can increase convenience and appeal to tech-savvy buyers and renters.
- Both Upgrading the HVAC system — A more efficient HVAC system can improve comfort and reduce energy costs, attracting more buyers and renters.
Renovation cost estimate screening
Value-add ROI direction
- Both Painting the exterior and interior walls — Fresh paint can enhance curb appeal and interior aesthetics. ↑
- Both Landscaping improvements — Enhanced landscaping can increase curb appeal and property value. ↑
- Resale Upgrading the kitchen appliances — Modern appliances can attract more buyers and renters. ↑
- Both Adding smart home features — Smart home features can increase convenience and appeal to tech-savvy buyers and renters. ↑
- Both Upgrading the HVAC system — A more efficient HVAC system can improve comfort and reduce energy costs, attracting more buyers and renters. ↑
ⓘ Cost ranges are severity-bucket heuristics (US national rule-of-thumb). Get contractor quotes + a written scope before underwriting a rehab budget.
Schools (NCES district)
- District
- Clint ISD
- NCES district ID
- 4814430
- Math proficiency
- 14% ▼ -32.00%
- Reading proficiency
- 22% ▼ -15.00%
- Median HH income
- $37,490
- Composite
- 15.03/100
- National rank
- #9356
- State rank
- #792 of 826 in TX
Livability — Horizon City
- Score
- 66/100
- State rank
- #619
- US rank
- #11815
Category grades
Schools grade is shown separately in the Schools card above.
Census & demographics
- Census place
- Horizon City, TX
- County
- El Paso County · 761,266 people
- City population
- 86,599
- Metro
- El Paso, TX
- Population (ZIP)
- 86,599
- Household income
- $76,643
- Rent vs Own
- Severe rent burden
- 838.0
Population outlook (El Paso County) Hauer SSP2
- Today (2025)
- 897,899 people
- By 2030
- 922,694 · +2.8%
- By 2040
- 960,492 · +7.0%
- By 2050
- 982,919 · +9.5%
- By 2075
- 997,266 · +11.1%
- By 2100
- 900,630 · +0.3%
Race, ethnicity, and origin ACS 2023
- Neighborhood character
- Predominantly Hispanic (89%)
- Race & ethnicity
- Hispanic / Latino 89% Two or more races 39% White 7% Black 2% Native American 2%
- Hispanic origin (detail)
- Mexican 84%
- Foreign-born
- 23% · Canada
- Languages at home
- 25% English-only · Spanish 74% Other Asian/Pacific 1%
Political lean MEDSL · El Paso
- 2024 margin
- D (+15.1) · D 57.0% · R 41.8% · Other 1.2%
- 2008→2024 swing
- -17.4pp toward R · 2008: 32.5pp · 2024: 15.1pp
- All cycles
- 2024: D+15.1 2020: D+35.1 2016: D+43.2 2012: D+32.6 2008: D+32.5
Not yet ingested
- Civics
- —
Market trends
- HPI YoY
- ▼ -40.72%
- Current HPI
- 200.6454
- Rent YoY
- ▲ 2.93%
- Metro
- El Paso, TX
- State GDP YoY
- ▲ 3.95%
- F500 in state
- 110
Industry mix (Fortune 500 HQ in TX)
| Industry | F500 HQs | Revenue |
|---|---|---|
| Energy | 16 | $1,198B |
|
||
| Technology | 5 | $198B |
|
||
| Engineering / Construction | 4 | $72B |
|
||
| Energy Services | 3 | $60B |
|
||
| Utilities | 3 | $41B |
|
||
| Healthcare | 2 | $330B |
|
||
Price history
1 event — show timeline
- 2026-05-20 Listed $216,800 GEPARMLS
Cash-flow waterfall
monthlySold comps — $/sqft
last 12 mo · ≤1 miLoading sold comps…