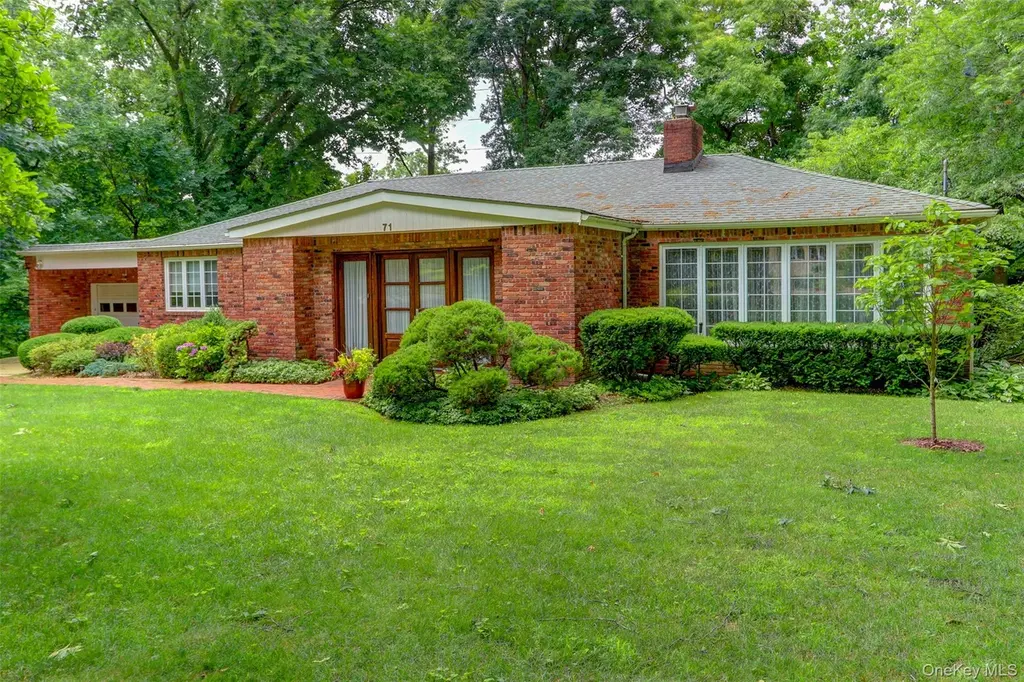
71 Knollwood Rd · Flower Hill, NY
Flood risk 1/10 · Minimal
- FEMA flood zone
- X (unshaded)
- Chance of flooding over 30 yrs
- 0.0%
- Est. flood insurance / yr
- $507 – $1,088
Fire risk 3/10 · Minor
- Est. fire insurance / yr
- $691 – $1,283
Heat risk 6/10 · Moderate
- Hot days now (above 98°F)
- 7 days/yr
- Hot days in 30 yrs
- 16 days/yr
Wind risk 6/10 · Moderate
- Chance of severe wind over 30 yrs
- 59.0%
Air-quality risk 4/10 · Minor
- Unhealthy air days now
- 6 days/yr
- Unhealthy air days in 30 yrs
- 7 days/yr
Risk factors via First Street. Map © Google.
Why this score? — see what drove the D- grade
The composite is a weighted blend of 9 inputs, each scored 0–100. Each bar is that input's sub-score; the figure is the points it added to the 100-point composite (weight × sub-score).
- ARV discount +10.0/15.0
- Appreciation +8.7/10.0
- Schools +7.7/10.0
- Cash flow +4.5/30.0
- Livability +3.8/5.0
- Rent growth +2.5/5.0
- Condition / age +2.5/5.0
- 1% rule +0.0/10.0
- DSCR +0.0/10.0
$1,648,000
🖨 Deal sheet (PDF) 📄 Offer letter ✓ Due diligence
Listing remarks
A Home To Love, Cherish & Entertain In!!!! Welcome to This Sunlit Beautifully Maintained Residence Nestled ion . 38 Acre in Flower Hill Section Of Roslyn. This Elegant Home Offers The Perfect Blend Of Comfort, Functionality, And Timeless Charm . Featuring A Spacious Entry Foyer, Living Room With High Ceiling & Dual Fireplace, Dining Area, Large Den, Kitchen With Breakfast Area In Sunroom, Primary With Full Bath, Full Finished Basement. An Incredible Backyard Designed For Everyday Living and Entertaining. Port Washington Train Sticker. Ideally located near premier shopping, major highways, and the LIRR, this home offers a seamless blend of style, comfort, and convenience. Roslyn
Key facts
- 0.37 acre lot
- Garage
- Built 1951
Property features AI
Exterior
- Parking: Driveway; Attached garage with approximately 1.5 garage spaces
- Utilities: Electric service by PSEG; Natural gas connected; Cesspool sewer
- Home design: Single family residence
- Construction: Brick construction
- Exterior features: Brick exterior; Not waterfront
Interior
- Kitchen: Eat-in kitchen; Dishwasher; Gas range; Refrigerator
- Bedrooms: Includes a first-floor bedroom
- Bathrooms: Three full bathrooms
- Heating & cooling: Forced-air heating; Central air conditioning
- Interior features: First-floor bedroom; First-floor full bathroom; Cathedral ceilings; Chandelier; Eat-in kitchen; Entrance foyer; Primary bathroom; Storage; Full basement; Partial attic; Deck and patio
- Laundry & utility: Washer and dryer; Laundry located in the basement
Neighborhood map
What this means for you Summary
Snapshot
- This is a 3-bed/2.0-bath single-family listed at $1.65M.
Deal economics
- At list price, monthly cash flow is $-4k ($-51k/yr) — negative.
- To cash-flow at today's rent, offer at most $891k (45.9% below list).
- To meet the 1% rule (rent ≥ 1% of price), the offer needs to be $735k (55.4% below list).
- Recommended offer: $735k (55.4% below list) — sets the bar for 1% rule.
Location & tenants
- Location reads 76/100 on livability (#212 in NY, #3,270 nationally) — a middle-class / working-renter tenant base. Strengths: crime A+, commute A+, employment A+; Watch: amenities D, cost of living F.
- Roslyn Union Free School District (suburban): math 83% / reading 82% proficiency, ranked #28 of 590 in NY (top 5%) — strong family-tenant draw, lease renewals of 3-5y typical; only 8% free/reduced lunch — higher-income household profile.
- Zoned schools: Harbor Hill School (math 83% / reading 82%, grade A+, #133 of 2,108 statewide, top 6%, 584 students, 10% FRL); Roslyn Middle School (math 78% / reading 82%, grade A+, #28 of 729 statewide, top 4%, 766 students, 16% FRL); Roslyn High School (math 97% / reading 87%, grade A+, #171 of 1,100 statewide, top 18%, 1,035 students, 15% FRL).
- Market conditions: 81 active listings in the ZIP; 7 comparable units currently listed for rent nearby; rentals leasing fast (median 4d on market — plan ~1-2 weeks tenant-placement turnaround); 824 units permitted in Nassau County in 2024 (153 in 5+ unit buildings).
Forward outlook
- In year one you build about $135k of equity ($11k loan paydown + $123k appreciation (7.5% local appreciation)).
- Nassau County population projected at +7% by 2050 — modest demand growth; plan on rents tracking national, not racing it.
- By year 2, paydown + projected appreciation supports a ~$216k cash-out refi (75% LTV) — recoverable capital for the next deal without selling this one.
Negotiation context
- It's been on market 44 days — a 3% lower offer ($1.60M) is reasonable based on typical stale-listing flexibility.
- 4 sale attempts since 8y ago with the ask held roughly flat each time — persistent listings suggest the price (not the market) is what's stuck; bring a comps-based counter.
Risks & watch-outs
- Watch-outs: built in 1951 — expect roof / HVAC / electrical / plumbing capex.
- Climate carrying-cost: major wind risk, 59% chance of damaging wind over 30y; extreme-heat days projected 7→16/yr by 2055 (HVAC capex compounding) — expect insurance premiums to compound above CPI over the hold.
Questions for the listing agent
- What do current leases actually rent for vs. the listed asking? Can we see a recent rent roll and the last 12 months of T-12 income?
- It's been on market 44 days. Have you received any prior offers? Is the seller open to a 55% concession, seller financing, or rate buy-down credit?
- Built in 1951 — when were the roof, HVAC, electrical panel, plumbing, and water heater last replaced?
- Is there a deadline driving the sale (1031 exchange, divorce, estate, relocation)? That informs how much negotiation room exists.
- The area grade is low — what's the realistic commute time and amenity access for the typical tenant pool here? Any planned neighborhood developments (good or bad) we should know about?
- What's the average days-on-market for RENTAL listings here right now (not sales)? A rising rental-DOM trend means longer vacancies and softer asking-rent achievability than the comps imply.
- What's the recent tenant-quality profile in this submarket — average credit score on applications, eviction rate, late-payment / NSF rate, and stable-employment percentage? A property-management company in the area should have these aggregated.
- How much new for-sale + rental construction is in the pipeline within 1–3 miles? Heavy new supply typically softens prices + rents 12–24 months out; constrained supply supports both.
Investment metrics
- 1% rule
- 0.45% ✗
- Cap rate
- 3.17%
- Cash-on-cash
- -11.14%
- DSCR
- 0.50
- GRM
- 18.7
CMA / ARV
- ARV (median comp)
- $1,746,210
- List price
- $1,648,000
- Delta
- -5.62%
- Verdict
- FAIR
- Comps
- 20 within 1.0 mi
Show comp detail 10 sales within ~0.75 mi
| Address | Dist | Beds/Ba | Sqft | Sold | Price | $/sf | Match |
|---|---|---|---|---|---|---|---|
| 53 Knollwood Rd | 0.12mi | 3/2.0 | 1,814 (-3%) | 9mo | $1,500,000 | $827 | 81 |
| 20 The Hemlocks | 0.39mi | 3/2.0 | 1,752 (-7%) | 10mo | $1,260,000 | $719 | 62 |
| 715 Park Ave | 0.40mi | 3/1.5 | 1,825 (-3%) | 17mo | $1,650,000 | $904 | 60 |
| 30 Borglum Rd | 0.08mi | 3/2.5 | 2,152 (+15%) | 12mo | $1,875,000 | $871 | 60 |
| 6 Overhill Ln | 0.34mi | 3/2.5 | 2,092 (+11%) | 6mo | $1,500,000 | $717 | 58 |
| 63 Hilltop Dr | 0.69mi | 3/1.5 | 1,824 (-3%) | 9mo | $2,025,000 | $1,110 | 54 |
| 11 Mill Spring Rd | 0.59mi | 3/2.5 | 1,859 (-1%) | 23mo | $1,663,000 | $895 | 50 |
| 12 Pine Dr S | 0.72mi | 3/2.0 | 1,690 (-10%) | 8mo | $1,255,000 | $743 | 43 |
| 3 Wood Valley Ln | 0.46mi | 4/3.5 (+1) | 2,008 (+7%) | 24mo | $1,800,000 | $896 | 36 |
| 1127 Old Northern Blvd | 0.70mi | 3/2.5 | 1,629 (-13%) | 13mo | $875,000 | $537 | 32 |
Match score weights: distance 35% · size 25% · config 20% · recency 20%. Top-matched comps best support the ARV.
Projected returns pro-forma
7.48% appreciation · 3.0% rent growth · sell at horizon
- IRR
- 10.4%
- Equity multiple
- 1.76×
- Total profit
- $351,408
- Equity at exit
- $1,194,619
- IRR
- 11.3%
- Equity multiple
- 3.65×
- Total profit
- $1,220,707
- Equity at exit
- $2,318,553
Cash invested: $461,440 (down + closing). Projections, not guarantees.
Landlord ↔ Tenant lean methodology
- Overall (STATE)
- 15 Strongly Tenant-Friendly
- State New York
- 15 Strongly Tenant-Friendly · D+10
- County
- — inherits STATE
- City
- — inherits STATE
ZIP-level market 11576
- Home prices YoY
- 2.5%
- Active inventory
- 81
- Price-to-rent
- 18.7×
Monthly cashflow live
- Estimated rent
- $7,355 high interval (Pro) →
- Mortgage (P&I)
- −$8,642
- Tax from tax record
- −$765 /mo · $9,177/yr
- Insurance
- −$687
- HOA
- −$0
- Vacancy / Maint / Mgmt
- −$1,544
- Net cashflow
- $-4,284
Break-even live
Sensitivity live
| Price | -10% $-3,351 | -5% $-3,817 | +0% $-4,284 | +5% $-4,750 | +10% $-5,216 |
|---|---|---|---|---|---|
| Rent | -10% $-4,865 | -5% $-4,574 | +0% $-4,284 | +5% $-3,993 | +10% $-3,703 |
| Rate | -1.0pp $-3,454 | -0.5pp $-3,864 | base $-4,284 | +0.5pp $-4,711 | +1.0pp $-5,145 |
UW: 25.0% down · 7.5% · 30yr · 1.5% tax · 5.0% vac · 8.0% maint · 8.0% mgmt
Financing live
Cash to close
- Down payment
- $412,000
- Closing costs
- $49,440
- Reserves months
- —
- Total cash needed
- —
Loan-product check · same deal, 3 products live
Conventional
25% down · 7.5% · 30yr
- Down + closing
- —
- Monthly P&I
- —
- Monthly cashflow
- —
- DSCR
- —
- Eligible?
- —
Personal DTI + credit; lowest rate.
DSCR
20% down · 8.5% · 30yr
- Down + closing
- —
- Monthly P&I
- —
- Monthly cashflow
- —
- DSCR
- —
- Eligible?
- —
No personal income docs; deal must DSCR.
Hard money
10% down · 12.0% · 12mo
- Down + closing
- —
- Monthly P&I
- —
- Monthly cashflow
- —
- DSCR
- —
- Eligible?
- —
Short-term bridge; refi at stabilization.
Rent comps 7 comps
| Address | Beds | Baths | Sqft | Rent | $/sqft | DOM | Units | Dist |
|---|---|---|---|---|---|---|---|---|
| 91 Duckpond Dr Manhasset, NY | 2.0 | 2.0 | 1915 | $8,530 | $4.45 | 3d | 1 | 0.76mi |
| 109 Chase Rd Manhasset, NY | 3.0 | 1.5 | 1392 | $7,350 | $5.28 | 45d | 1 | 0.98mi |
| 94 Main St Roslyn, NY | 3.0 | 2.5 | 1462 | $9,200 | $6.29 | 0d | 1 | 1.04mi |
| 24 Skillman St Unit Lower Roslyn, NY | 2.0 | 2.0 | 1250 | $4,950 | $3.96 | 4d | 1 | 1.12mi |
| 300 Edwards St Roslyn, NY | 1.0–2.0 | 1.0–2.0 | 1250 | $4,904 | $3.92 | 0d | 1 | 1.21mi |
| 333 Warner Ave Unit 316 Roslyn Heights, NY | 2.0 | 2.5 | 1784 | $7,850 | $4.40 | 4d | 1 | 1.41mi |
| 71 Orchard St Manhasset, NY | 2.0 | 2.5 | 1596 | $6,600 | $4.14 | 26d | 1 | 1.50mi |
Listing history 22 events
-
2026-06-21days on market $1,648,000 Active 44 DOM
-
2026-06-18days on market $1,648,000 Active 41 DOM
-
2026-06-17days on market $1,648,000 Active 40 DOM
-
2026-06-16days on market $1,648,000 Active 39 DOM
-
2026-06-15days on market $1,648,000 Active 38 DOM
-
2026-06-13days on market $1,648,000 Active 36 DOM
-
2026-06-13days on market $1,648,000 Active 35 DOM
-
2026-06-09days on market $1,648,000 Active 32 DOM
-
2026-06-08days on market $1,648,000 Active 31 DOM
-
2026-06-07days on market $1,648,000 Active 30 DOM
-
2026-06-04days on market $1,648,000 Active 27 DOM
-
2026-06-03days on market $1,648,000 Active 26 DOM
-
2026-06-02days on market $1,648,000 Active 25 DOM
-
2026-06-01days on market $1,648,000 Active 24 DOM
-
2026-05-31days on market $1,648,000 Active 23 DOM
-
2026-05-08$1,648,000 Active 703-char remark
-
2019-12-16historical
-
2019-08-07$998,000 New
-
2018-11-01historical
-
2018-10-31historical
-
2018-07-31$998,000 New
-
2018-07-31$998,000
ⓘ Source: listings_history table (triggers on properties + properties_extension) + one-shot
backfill from property_details.listing_events for pre-trigger history.
Tax reassessment forecast NY · Partial reset (capped growth)
- Current annual tax
- $9,177 · $765/mo
- Projected year-2 tax
- $18,514 · $1,543/mo
- Expected delta
- +$9,337/yr (+$778/mo · 101.7%)
ⓘ Screening estimate from a state-policy table — verify with the county assessor before closing.
Climate risk First Street
- Flood 1/10 Low FEMA zone X (unshaded) · 0% chance over 30 yrs
- Wildfire 3/10 Moderate
- Heat 6/10 Major 7 d/yr ≥98°F today · 16 d/yr by 30 yrs out
- Wind 6/10 Major 59% chance of damaging wind over 30 yrs
- Air quality 4/10 Moderate 6 unhealthy d/yr today · 7 by 30 yrs out
Nearby sold comps map
Loading sold comps map…
Walkable amenities ~0.75 mi
Loading nearby amenities…
Taxation est. · year 1
- Rental income
- $88,256
- − Mortgage interest
- −$92,314
- − Property taxes
- −$9,177
- − Insurance
- −$8,240
- − Repairs & maintenance
- −$7,060
- − Management
- −$7,060
- − Depreciation
- −$47,942
- Taxable loss
- −$83,538
- Est. tax savings @ 24.0%
- +$20,049
- After-tax cash flow
- $-31,354/yr
For passive investors: Depreciation is non-cash, so a rental often shows a tax loss while cash-flowing — sheltering income. Rental losses are passive: they offset passive income freely, and up to $25,000/yr can offset ordinary (W-2) income if you actively participate and your MAGI is under $100k (phasing out to $0 by $150k); unused losses carry forward. On sale, claimed depreciation is recaptured at up to 25%, and gains may owe capital-gains tax (a 1031 exchange can defer both). Figures are a year-1 estimate at your 24.0% rate — not tax advice; consult a CPA.
Schools (NCES district)
- District
- Roslyn Union Free School District
- NCES district ID
- 3625050
- Math proficiency
- 83% ▼ -2.00%
- Reading proficiency
- 82% ▲ 3.00%
- Median HH income
- $128,640
- Composite
- 77.26/100
- National rank
- #101
- State rank
- #28 of 590 in NY
Livability — Flower Hill
- Score
- 76/100
- State rank
- #212
- US rank
- #3270
Category grades
Schools grade is shown separately in the Schools card above.
Census & demographics
- Census place
- Flower Hill, NY
- Population (ZIP)
- 12,796
Population outlook (Nassau County) Hauer SSP2
- Today (2025)
- 1,409,302 people
- By 2030
- 1,431,482 · +1.6%
- By 2040
- 1,471,607 · +4.4%
- By 2050
- 1,502,845 · +6.6%
- By 2075
- 1,575,403 · +11.8%
- By 2100
- 1,554,356 · +10.3%
Race, ethnicity, and origin ACS 2023
- Neighborhood character
- Predominantly White (69%)
- Race & ethnicity
- White 69% Asian 19% Hispanic / Latino 6% Two or more races 2% Black 1%
- Hispanic origin (detail)
- Puerto Rican 3%
- Common ancestry
- Romanian 11% Scotch-Irish 7% Italian 3%
- Foreign-born
- 24% · Canada, China, South Korea
- Languages at home
- 71% English-only · Other Indo-European 11% Korean 4% Chinese 4%
Political lean MEDSL · Nassau
- 2024 margin
- Toss-up / Even · D 47.9% · R 52.1%
- 2008→2024 swing
- -12.6pp toward R · 2008: 8.4pp · 2024: -4.2pp
- All cycles
- 2024: R+4.2 2020: D+9.5 2016: D+5.3 2012: D+6.7 2008: D+8.4
Not yet ingested
- Civics
- —
Market trends
- HPI YoY
- ▲ 7.48%
- Current HPI
- 305.952
- Rent YoY
- —
- Metro
- —
- State GDP YoY
- ▲ 2.60%
- F500 in state
- 92
Industry mix (Fortune 500 HQ in NY)
| Industry | F500 HQs | Revenue |
|---|---|---|
| Financial Services | 10 | $950B |
|
||
| Consumer Goods | 9 | $162B |
|
||
| Insurance | 4 | $225B |
|
||
| Telecommunications | 2 | $144B |
|
||
| Pharmaceuticals | 2 | $112B |
|
||
| Media / Entertainment | 2 | $69B |
|
||
Price history
+65.1% since first listed7 events — show timeline
- 2026-05-08 Listed $1,648,000 OneKey® MLS as Distributed by MLS Grid
- 2019-12-16 Listing Removed — OneKey® MLS as Distributed by MLS Grid
- 2019-08-07 Listed $998,000 OneKey® MLS as Distributed by MLS Grid
- 2018-11-01 Listing Removed — OneKey® MLS as Distributed by MLS Grid
- 2018-10-31 Listing Removed — Cincy MLS
- 2018-07-31 Listed $998,000 Cincy MLS
- 2018-07-31 Listed $998,000 OneKey® MLS as Distributed by MLS Grid
Property tax history
-2.2%/yrLatest (2024): $9,177 · +30.9% YoY. Source: county tax records.
Cash-flow waterfall
monthlySold comps — $/sqft
last 12 mo · ≤1 miLoading sold comps…