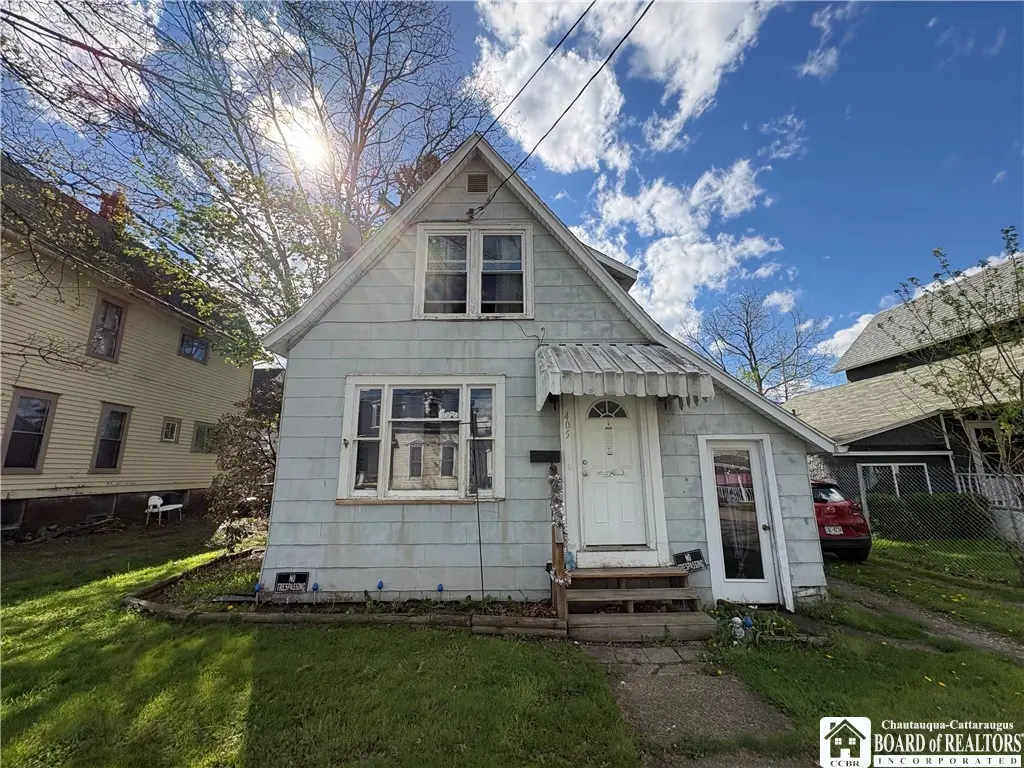
405 4th Ave · Olean, NY
Flood risk 5/10 · Moderate
- FEMA flood zone
- X (shaded)
- Chance of flooding over 30 yrs
- 0.27%
- Est. flood insurance / yr
- $473 – $860
Fire risk 4/10 · Minor
- Est. fire insurance / yr
- $691 – $1,283
Heat risk 2/10 · Minimal
- Hot days now (above 90°F)
- 8 days/yr
- Hot days in 30 yrs
- 19 days/yr
Wind risk 1/10 · Minimal
- Chance of severe wind over 30 yrs
- —
Air-quality risk 1/10 · Minimal
- Unhealthy air days now
- 0 days/yr
- Unhealthy air days in 30 yrs
- 0 days/yr
Risk factors via First Street. Map © Google.
Why this score? — see what drove the B- grade
The composite is a weighted blend of 9 inputs, each scored 0–100. Each bar is that input's sub-score; the figure is the points it added to the 100-point composite (weight × sub-score).
- Cash flow +30.0/30.0
- 1% rule +10.0/10.0
- DSCR +10.0/10.0
- ARV discount +7.5/15.0
- Livability +3.6/5.0
- Schools +3.5/10.0
- Rent growth +2.5/5.0
- Condition / age +2.5/5.0
- Appreciation +0.0/10.0
$49,900
🖨 Deal sheet 📄 Offer letter ✓ Due diligence
Listing remarks
Welcome to this charming 1.75-story property offering a warm, functional layout and plenty of flexible living space. The main floor features a spacious mudroom, an inviting flow between living areas, and a bonus room off the kitchen that would make an excellent home office, play room, or potential third bedroom. Upstairs, you’ll find two comfortable bedrooms and a full bath. Laundry is conveniently located in the basement, providing additional storage potential as well. Outside, enjoy off-street parking, a storage shed for extra convenience, and a generously sized yard with room to relax, garden, or entertain.
Key facts
- Off street parking
- Bonus room
- Storage shed
Tags
Property features AI
Exterior
- Parking: No garage
- Utilities: Public water connected; Sewer connected
- Home design: Single-story; Resale property; Shingle roof
- Construction: See remarks for construction materials
- Exterior features: Dirt driveway; Rectangular lot (approx. 50 x 130)
Interior
- Kitchen: Free-standing range; Oven
- Bedrooms: Convertible bedroom
- Bathrooms: 1 full bathroom
- Heating & cooling: Gas forced-air heating
- Interior features: Separate/formal dining room; Separate/formal living room; Convertible bedroom; Partial basement
- Laundry & utility: Laundry in basement; Gas water heater
Neighborhood map
What this means for you Summary
Snapshot
- This is a 2-bed/1.0-bath single-family listed at $50k.
Deal economics
- At list price, monthly cash flow is $483 ($6k/yr) — positive.
- The deal already cash-flows at list — no discount required.
- Meets the 1% rule at list price ($1k rent vs $50k).
- Cap rate 17.9% vs local median 8.0% in Olean — top-decile yield for the area; either an underpriced asset or a hidden risk that comps aren't pricing in. Stress-test before assuming the spread holds.
Location & tenants
- Location reads 72/100 on livability (#353 in NY) — a middle-class / working-renter tenant base. Strengths: cost of living A+, housing A+, health & safety A+; Watch: crime F, amenities F, commute F.
- Olean City School District (town): math 40% / reading 43% proficiency, ranked #511 of 590 in NY (top 87%) — families likely to look elsewhere, expect single-tenant / working-renter base with shorter leases.
- Market conditions: 141 active listings in the ZIP; 128 units permitted in Cattaraugus County in 2024 (21 in 5+ unit buildings).
Forward outlook
- Local home prices are declining (-3.0%/yr); year-one equity from $345 of loan paydown is wiped out by about $1k of value loss. Plan a longer hold.
- Cattaraugus County population projected at -28% by 2050 — secular population decline; favor cash flow + early exit over multi-decade hold.
- At projected returns (-3.0% appreciation + 3.0% rent growth), your $14k cash investment doubles in ~3 years — after that, you're playing with house money.
Negotiation context
- Only 5 days on market — expect competitive offers; lowballing is unlikely to land.
- Current owner paid $30k; list at $50k implies a 66% gain — meaningful room to come down on a strong offer.
Risks & watch-outs
- Watch-outs: property tax is 2.8% of price; built in 1900 — expect roof / HVAC / electrical / plumbing capex.
- Climate carrying-cost: moderate flood risk — expect insurance premiums to compound above CPI over the hold.
Questions for the listing agent
- Built in 1900 — when were the roof, HVAC, electrical panel, plumbing, and water heater last replaced?
- Property tax is high relative to price — has the assessment been appealed recently, and will the sale trigger a re-assessment?
- Is there a deadline driving the sale (1031 exchange, divorce, estate, relocation)? That informs how much negotiation room exists.
- Schools are B-rated — typically a magnet for longer-tenancy family renters. What's the average tenant stay here, and is there a school-zone premium baked into asking?
- Crime grade is F in this area — have there been break-ins, vandalism, or insurance claims at this property in the last 3 years? What carrier currently insures it and at what premium?
- What's the average days-on-market for RENTAL listings here right now (not sales)? A rising rental-DOM trend means longer vacancies and softer asking-rent achievability than the comps imply.
- What's the recent tenant-quality profile in this submarket — average credit score on applications, eviction rate, late-payment / NSF rate, and stable-employment percentage? A property-management company in the area should have these aggregated.
- How much new for-sale + rental construction is in the pipeline within 1–3 miles? Heavy new supply typically softens prices + rents 12–24 months out; constrained supply supports both.
Investment metrics
- 1% rule
- 2.24% ✓
- Cap rate
- 17.90%
- Cash-on-cash
- 41.45%
- DSCR
- 2.84
- GRM
- 3.7
CMA / ARV
- ARV (median comp)
- $119,452
- List price
- $49,900
- Delta
- -58.23%
- Verdict
- UNDERPRICED
- Comps
- 20 within 1.0 mi
Show comp detail 10 sales within ~0.75 mi
| Address | Dist | Beds/Ba | Sqft | Sold | Price | $/sf | Match |
|---|---|---|---|---|---|---|---|
| 417 4th Ave | 0.03mi | 1/1.0 (-1) | 1,099 (-0%) | 9mo | $75,000 | $68 | 86 |
| 714 Front St | 0.10mi | 3/1.0 (+1) | 1,056 (-4%) | 3mo | $112,000 | $106 | 81 |
| 509 3rd Ave | 0.14mi | 3/1.5 (+1) | 1,172 (+6%) | 22mo | $56,000 | $48 | 57 |
| 269 Hamilton Ave | 0.41mi | 3/1.0 (+1) | 1,128 (+2%) | 19mo | $107,000 | $95 | 56 |
| 105 Fulton St | 0.71mi | 2/1.0 | 1,084 (-2%) | 14mo | $115,000 | $106 | 53 |
| 213 Madison Ave | 0.58mi | 2/1.0 | 1,178 (+7%) | 14mo | $120,000 | $102 | 49 |
| 1014 N Union St | 0.66mi | 2/1.0 | 1,224 (+11%) | 3mo | $30,000 | $25 | 48 |
| 526 Queen St | 0.74mi | 2/1.0 | 1,176 (+7%) | 15mo | $138,000 | $117 | 41 |
| 817 N 4th St | 0.65mi | 3/2.0 (+1) | 1,044 (-5%) | 16mo | $59,900 | $57 | 38 |
| 314 Van Campen Ave | 0.51mi | 3/2.0 (+1) | 1,213 (+10%) | 18mo | $96,000 | $79 | 35 |
Match score weights: distance 35% · size 25% · config 20% · recency 20%. Top-matched comps best support the ARV.
Projected returns pro-forma
-3.0% appreciation · 3.0% rent growth · sell at horizon
- IRR
- 38.1%
- Equity multiple
- 2.62×
- Total profit
- $22,704
- Equity at exit
- $7,440
- IRR
- 44.6%
- Equity multiple
- 5.26×
- Total profit
- $59,556
- Equity at exit
- $4,314
Cash invested: $13,972 (down + closing). Projections, not guarantees.
Landlord ↔ Tenant lean methodology
- Overall (STATE)
- 15 Strongly Tenant-Friendly
- State New York
- 15 Strongly Tenant-Friendly · D+10
- County
- — inherits STATE
- City
- — inherits STATE
ZIP-level market 14760
- Home prices YoY
- -7.7%
- Active inventory
- 141
- Price-to-rent
- 3.7×
Monthly cashflow live
- Estimated rent
- $1,115 medium interval (Pro) →
- Mortgage (P&I)
- −$262
- Tax from tax record
- −$116 /mo · $1,391/yr
- Insurance
- −$21
- HOA
- −$0
- Vacancy / Maint / Mgmt
- −$234
- Net cashflow
- $483
Break-even live
UW: 25.0% down · 7.5% · 30yr · 1.5% tax · 5.0% vac · 8.0% maint · 8.0% mgmt
Financing live
Cash to close
- Down payment
- $12,475
- Closing costs
- $1,497
- Reserves months
- —
- Total cash needed
- —
Loan-product check · same deal, 3 products live
Conventional
25% down · 7.5% · 30yr
- Down + closing
- —
- Monthly P&I
- —
- Monthly cashflow
- —
- DSCR
- —
- Eligible?
- —
Personal DTI + credit; lowest rate.
DSCR
20% down · 8.5% · 30yr
- Down + closing
- —
- Monthly P&I
- —
- Monthly cashflow
- —
- DSCR
- —
- Eligible?
- —
No personal income docs; deal must DSCR.
Hard money
10% down · 12.0% · 12mo
- Down + closing
- —
- Monthly P&I
- —
- Monthly cashflow
- —
- DSCR
- —
- Eligible?
- —
Short-term bridge; refi at stabilization.
Listing history 4 events
-
2026-05-14$49,900 Active 623-char remark
-
2014-04-30soldstatus $30,000
-
2009-11-12soldstatus $25,000
-
2003-12-22soldstatus $17,651
ⓘ Source: listings_history table (triggers on properties + properties_extension) + one-shot
backfill from property_details.listing_events for pre-trigger history.
Tax reassessment forecast NY · Partial reset (capped growth)
- Current annual tax
- $1,391 · $116/mo
- Projected year-2 tax
- $1,391 · $116/mo
- Expected delta
- $0/yr ($0/mo · 0.0%)
ⓘ Screening estimate from a state-policy table — verify with the county assessor before closing.
Climate risk First Street
- Flood 5/10 Major FEMA zone X (shaded) · 27% chance over 30 yrs
- Wildfire 4/10 Moderate
- Heat 2/10 Low 8 d/yr ≥90°F today · 19 d/yr by 30 yrs out
- Wind 1/10 Low
- Air quality 1/10 Low 0 unhealthy d/yr today · 0 by 30 yrs out
Nearby sold comps map
Loading sold comps map…
Walkable amenities ~0.75 mi
Loading nearby amenities…
Taxation est. · year 1
- Rental income
- $13,383
- − Mortgage interest
- −$2,795
- − Property taxes
- −$1,391
- − Insurance
- −$250
- − Repairs & maintenance
- −$1,071
- − Management
- −$1,071
- − Depreciation
- −$1,452
- Taxable income
- $5,354
- Est. tax owed @ 24.0%
- −$1,285
- After-tax cash flow
- $4,507/yr
For passive investors: Depreciation is non-cash, so a rental often shows a tax loss while cash-flowing — sheltering income. Rental losses are passive: they offset passive income freely, and up to $25,000/yr can offset ordinary (W-2) income if you actively participate and your MAGI is under $100k (phasing out to $0 by $150k); unused losses carry forward. On sale, claimed depreciation is recaptured at up to 25%, and gains may owe capital-gains tax (a 1031 exchange can defer both). Figures are a year-1 estimate at your 24.0% rate — not tax advice; consult a CPA.
Schools (NCES district)
- District
- Olean City School District
- NCES district ID
- 3621720
- Math proficiency
- 40% ▼ -10.00%
- Reading proficiency
- 43% ▼ -3.00%
- Median HH income
- $40,365
- Composite
- 34.81/100
- National rank
- #5104
- State rank
- #511 of 590 in NY
Livability — Olean
- Score
- 72/100
- State rank
- #353
- US rank
- #5930
Category grades
Schools grade is shown separately in the Schools card above.
Census & demographics
- Census place
- Olean, NY
- City population
- 17,272
- Population (ZIP)
- 17,272
Population outlook (Cattaraugus County) Hauer SSP2
- Today (2025)
- 71,623 people
- By 2030
- 67,751 · -5.4%
- By 2040
- 59,488 · -16.9%
- By 2050
- 51,601 · -28.0%
- By 2075
- 35,025 · -51.1%
- By 2100
- 21,243 · -70.3%
Race, ethnicity, and origin ACS 2023
- Neighborhood character
- Predominantly White (89%)
- Race & ethnicity
- White 89% Two or more races 5% Black 2% Asian 2% Hispanic / Latino 1%
- Common ancestry
- Romanian 10% Iranian 2% Lithuanian 1%
- Foreign-born
- 3% · Canada
- Languages at home
- 97% English-only · Other Indo-European 1%
Political lean MEDSL · Cattaraugus
- 2024 margin
- Solid R (+32.8) · D 33.6% · R 66.4%
- 2008→2024 swing
- -22.2pp toward R · 2008: -10.6pp · 2024: -32.8pp
- All cycles
- 2024: R+32.8 2020: R+29.5 2016: R+34.4 2012: R+13.4 2008: R+10.6
Not yet ingested
- Civics
- —
Market trends
- HPI YoY
- ▼ -19.85%
- Current HPI
- 237.327
- Rent YoY
- —
- Metro
- —
- State GDP YoY
- ▲ 2.60%
- F500 in state
- 92
Industry mix (Fortune 500 HQ in NY)
| Industry | F500 HQs | Revenue |
|---|---|---|
| Financial Services | 10 | $950B |
|
||
| Consumer Goods | 9 | $162B |
|
||
| Insurance | 4 | $225B |
|
||
| Telecommunications | 2 | $144B |
|
||
| Pharmaceuticals | 2 | $112B |
|
||
| Media / Entertainment | 2 | $69B |
|
||
Price history
+182.7% since first listed5 events — show timeline
- 2026-05-19 Pending — UNYREIS
- 2026-05-14 Listed $49,900 UNYREIS
- 2014-04-30 Sold (Public Records) $30,000 Public Records
- 2009-11-12 Sold (Public Records) $25,000 Public Records
- 2003-12-22 Sold (Public Records) $17,651 Public Records
Property tax history
+6.7%/yrLatest (2025): $1,391 · -38.9% YoY. Source: county tax records.
Cash-flow waterfall
monthlySold comps — $/sqft
last 12 mo · ≤1 miLoading sold comps…