300 Berry St #902 · San Francisco, CA
Flood risk 7/10 · Major
- FEMA flood zone
- X (unshaded)
- Chance of flooding over 30 yrs
- 0.76%
- Est. flood insurance / yr
- $507 – $1,088
Fire risk 1/10 · Minimal
- Est. fire insurance / yr
- $659 – $1,223
Heat risk 2/10 · Minimal
- Hot days now (above 78°F)
- 7 days/yr
- Hot days in 30 yrs
- 16 days/yr
Wind risk 1/10 · Minimal
- Chance of severe wind over 30 yrs
- —
Air-quality risk 8/10 · Major
- Unhealthy air days now
- 15 days/yr
- Unhealthy air days in 30 yrs
- 15 days/yr
Risk factors via First Street. Map © Google.
Why this score? — see what drove the D grade
The composite is a weighted blend of 9 inputs, each scored 0–100. Each bar is that input's sub-score; the figure is the points it added to the 100-point composite (weight × sub-score).
- Appreciation +8.5/10.0
- ARV discount +7.5/15.0
- Cash flow +6.2/30.0
- Rent growth +5.0/5.0
- Schools +5.0/10.0
- Livability +3.8/5.0
- Condition / age +2.5/5.0
- 1% rule +2.3/10.0
- DSCR +0.5/10.0
$775,000
🖨 Deal sheet (PDF) 📄 Offer letter ✓ Due diligence
Listing remarks MLS
For comps purposes only. Arterra is San Francisco's premiere LEED-Silver luxury residential high rise. With designer, eco-friendly finishes; smart modern design, in-unit laundry & amenities galore, you will have everything you need & then some! Enjoy a luxurious lifestyle with the sunny panoramic view roof deck & BBQ, fitness center, community room, private guest suite & 24/7 attended lobby. Steps to Caltrain & easy freeway access. Walkscore = 98, Walker's Paradise.
Key facts
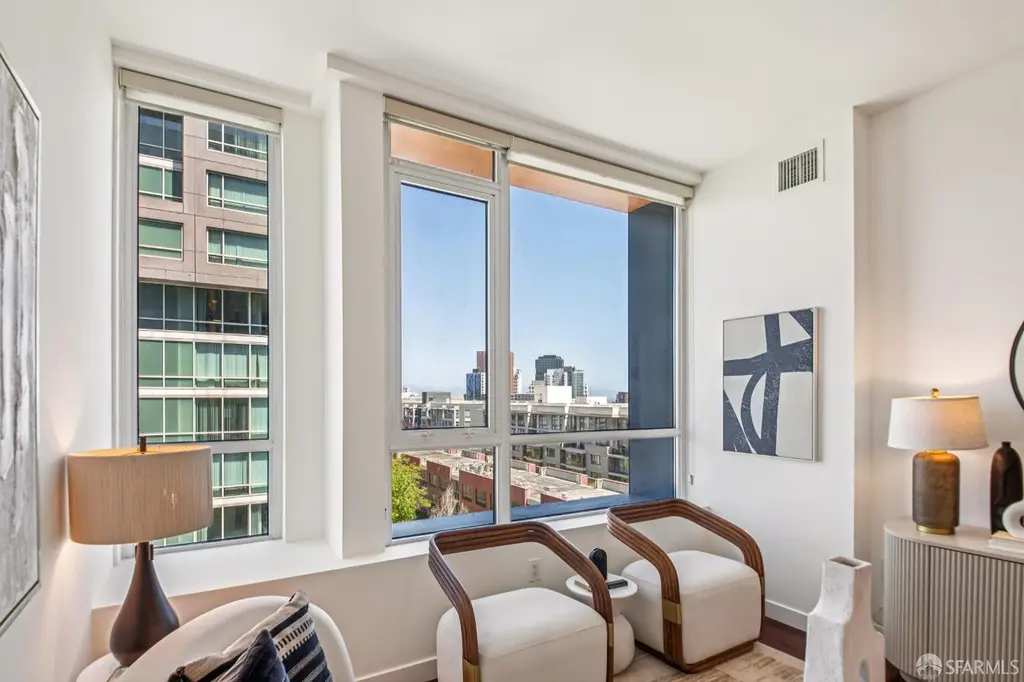
- Large window wall
- 10 foot ceilings
- Spacious peninsula
Tags
Property features AI
Finance
- HOA & community: HOA with monthly fee; Monthly association fee $803; HOA covers common areas, building insurance, structural maintenance, grounds maintenance, management, sewer, trash and water; Community amenities include barbecue, clubhouse and gym; Community contains 269 units; Pets allowed (cats and dogs; number limits apply)
Exterior
- Parking: On-site parking; Side-by-side parking layout; Independent parking; 1 parking space
- Security: Secured access; Carbon monoxide detector(s)
- Utilities: Electricity available; Natural gas connected; Public water; Public sewer
- Home design: Residential condominium; Attached property; Built in 2009
- Exterior features: Ground-level entry
Interior
- Bedrooms: 1 bedroom
- Bathrooms: 1 full bathroom
- Interior features: Secured building access; Carbon monoxide detectors
Neighborhood map
What this means for you Summary
Snapshot
- This is a 2-bed/1.0-bath condo listed at $775k.
Deal economics
- At list price, monthly cash flow is $-1k ($-18k/yr) — negative.
- To cash-flow at today's rent, offer at most $511k (34.1% below list).
- To meet the 1% rule (rent ≥ 1% of price), the offer needs to be $567k (26.8% below list).
- Recommended offer: $511k (34.1% below list) — sets the bar for cash-flow.
- Cap rate 4.1% vs local median 2.1% in San Francisco — top-decile yield for the area; either an underpriced asset or a hidden risk that comps aren't pricing in. Stress-test before assuming the spread holds.
Location & tenants
- Location reads 76/100 on livability (#90 in CA, #3,143 nationally) — a middle-class / working-renter tenant base. Strengths: amenities A+, commute A+, employment A+; Watch: crime F, cost of living F.
- San Francisco Unified (urban): math 50% / reading 56% proficiency, ranked #322 of 1,400 in CA (top 23%) — acceptable for families but not a draw, mixed tenant base, ~2y average lease.
- Zoned schools: Lilienthal (Claire) Elementary (669 students, 19% FRL); Giannini (A.P.) Middle (1,192 students, 34% FRL); Lowell High (2,632 students, 37% FRL) — zoned schools average 30% FRL vs 49% district-wide (19 pts lower); this property's tenant base skews higher-income than the district average.
- Market conditions: Rents rising fast (+21.0%/yr); 19 active listings in the ZIP; 40 comparable units currently listed for rent nearby; rentals leasing fast (median 1d on market — plan ~1-2 weeks tenant-placement turnaround); high-income renter base; 750 units permitted in San Francisco County in 2024 (688 in 5+ unit buildings).
- This rent runs 35% of the median local income ($197k/yr) — at the standard rent-burdened threshold; future hikes will face affordability resistance.
Forward outlook
- In year one you build about $59k of equity ($5k loan paydown + $53k appreciation (6.9% local appreciation)).
- San Francisco County population projected at +39% by 2050 — long-run rental-demand tailwind backs the buy-and-hold thesis.
- By year 2, paydown + projected appreciation supports a ~$94k cash-out refi (75% LTV) — recoverable capital for the next deal without selling this one.
Negotiation context
- Only 14 days on market — expect competitive offers; lowballing is unlikely to land.
- 2 sale attempts since 12y ago with the ask held roughly flat each time — persistent listings suggest the price (not the market) is what's stuck; bring a comps-based counter.
Risks & watch-outs
- Watch-outs: flood insurance adds $66/mo.
- Climate carrying-cost: major flood risk — expect insurance premiums to compound above CPI over the hold.
Questions for the listing agent
- What do current leases actually rent for vs. the listed asking? Can we see a recent rent roll and the last 12 months of T-12 income?
- What's the actual annual flood-insurance premium (NFIP or private), and is the property in a SFHA with mandatory coverage?
- What does the HOA fee cover, when was the last increase, and are there any pending special assessments or reserve-fund shortfalls?
- Any open or pending special assessments — roof, HVAC, plumbing, elevator, façade? What's the per-unit balance and payoff schedule, and is the seller paying it off at close or rolling it to the buyer?
- Is there a deadline driving the sale (1031 exchange, divorce, estate, relocation)? That informs how much negotiation room exists.
- Schools are B-rated — typically a magnet for longer-tenancy family renters. What's the average tenant stay here, and is there a school-zone premium baked into asking?
- Crime grade is F in this area — have there been break-ins, vandalism, or insurance claims at this property in the last 3 years? What carrier currently insures it and at what premium?
- The area grade is low — what's the realistic commute time and amenity access for the typical tenant pool here? Any planned neighborhood developments (good or bad) we should know about?
- What's the average days-on-market for RENTAL listings here right now (not sales)? A rising rental-DOM trend means longer vacancies and softer asking-rent achievability than the comps imply.
- What's the recent tenant-quality profile in this submarket — average credit score on applications, eviction rate, late-payment / NSF rate, and stable-employment percentage? A property-management company in the area should have these aggregated.
- How much new apartment / multifamily construction is in the pipeline within 1–3 miles? Heavy new supply (>2% of stock underway) typically softens rents 12–24 months out; light construction supports rent growth.
Investment metrics
- 1% rule
- 0.73% ✗
- Cap rate
- 4.08%
- Cash-on-cash
- -7.89%
- DSCR
- 0.65
- GRM
- 11.4
CMA / ARV
No comps found within radius.
Projected returns pro-forma
6.9% appreciation · 8.0% rent growth · sell at horizon
- IRR
- 12.9%
- Equity multiple
- 1.93×
- Total profit
- $201,217
- Equity at exit
- $532,060
- IRR
- 14.9%
- Equity multiple
- 4.38×
- Total profit
- $732,921
- Equity at exit
- $1,006,183
Cash invested: $217,000 (down + closing). Projections, not guarantees.
Landlord ↔ Tenant lean methodology
- Overall (CITY)
- 0 Strongly Tenant-Friendly
- State California
- 18 Strongly Tenant-Friendly · D+13
- County
- — inherits STATE
- City San Francisco
- 0 Strongly Tenant-Friendly · D+57
ZIP-level market 94158
- Home prices YoY
- 3.7%
- Rents YoY
- 21.0%
- Active inventory
- 19
- Price-to-rent
- 11.4×
Monthly cashflow live
- Estimated rent
- $5,673 high interval (Pro) →
- Mortgage (P&I)
- −$4,064
- Tax from tax record
- −$719 /mo · $8,626/yr
- Insurance
- −$323
- Flood insurance flood zone
- −$66 /mo · $798/yr
- HOA
- −$803
- Vacancy / Maint / Mgmt
- −$1,191
- Net cashflow
- $-1,494
Break-even live
Sensitivity live
| Price | -10% $-1,055 | -5% $-1,275 | +0% $-1,494 | +5% $-1,713 | +10% $-1,933 |
|---|---|---|---|---|---|
| Rent | -10% $-1,942 | -5% $-1,718 | +0% $-1,494 | +5% $-1,270 | +10% $-1,046 |
| Rate | -1.0pp $-1,104 | -0.5pp $-1,297 | base $-1,494 | +0.5pp $-1,695 | +1.0pp $-1,899 |
UW: 25.0% down · 7.5% · 30yr · 1.5% tax · 5.0% vac · 8.0% maint · 8.0% mgmt
Financing live
Cash to close
- Down payment
- $193,750
- Closing costs
- $23,250
- Reserves months
- —
- Total cash needed
- —
Loan-product check · same deal, 3 products live
Conventional
25% down · 7.5% · 30yr
- Down + closing
- —
- Monthly P&I
- —
- Monthly cashflow
- —
- DSCR
- —
- Eligible?
- —
Personal DTI + credit; lowest rate.
DSCR
20% down · 8.5% · 30yr
- Down + closing
- —
- Monthly P&I
- —
- Monthly cashflow
- —
- DSCR
- —
- Eligible?
- —
No personal income docs; deal must DSCR.
Hard money
10% down · 12.0% · 12mo
- Down + closing
- —
- Monthly P&I
- —
- Monthly cashflow
- —
- DSCR
- —
- Eligible?
- —
Short-term bridge; refi at stabilization.
Rent comps 40 comps
| Address | Beds | Baths | Sqft | Rent | $/sqft | DOM | Units | Dist |
|---|---|---|---|---|---|---|---|---|
| 300 Berry St #907 San Francisco, CA | 1.0 | 1.0 | 732 | $5,000 | $6.83 | 9d | 1 | 0.01mi |
| 360 Berry St San Francisco, CA | 1.0–2.0 | 1.0–2.0 | 842 | $7,305 | $8.68 | 0d | 5 | 0.10mi |
| 355 Berry St San Francisco, CA | 1.0 | 1.0 | 707 | $4,978 | $7.04 | 0d | 3 | 0.10mi |
| 255 King St San Francisco, CA | 3.0 | 1.0–2.5 | 1228 | $6,912 | $5.63 | 0d | 1 | 0.22mi |
| 185 Channel St San Francisco, CA | 2.0 | 1.0–2.0 | 914 | $7,855 | $8.59 | 0d | 36 | 0.26mi |
| 1155 4th St San Francisco, CA | 1.0–2.0 | 1.0–2.0 | 864 | $7,452 | $8.62 | 0d | 5 | 0.28mi |
| 1201 4th St Unit 1297791P San Francisco, CA | 1.0 | 1.0 | 742 | $6,148 | $8.29 | 16d | 1 | 0.30mi |
| 1023 3rd St San Francisco, CA | 2.0 | 1.0–2.0 | 743 | $10,000 | $13.46 | 3d | 13 | 0.37mi |
| 555 Bryant St San Francisco, CA | 2.0 | 1.0–2.0 | 687 | $6,574 | $9.57 | 0d | 10 | 0.41mi |
| 855 Brannan St San Francisco, CA | 3.0 | 1.0–2.0 | 958 | $5,633 | $5.88 | 0d | 5 | 0.48mi |
| 1 Henry Adams St San Francisco, CA | 3.0 | 2.0 | 873 | $5,646 | $6.46 | 0d | 3 | 0.52mi |
| 1010 16th St San Francisco, CA | 2.0 | 1.0–2.0 | 956 | $4,767 | $4.98 | 0d | 8 | 0.53mi |
| 975 Bryant St San Francisco, CA | 2.0 | 1.0–2.0 | 697 | $6,304 | $9.04 | 0d | 10 | 0.55mi |
| 88 Townsend St #311 San Francisco, CA | 1.0 | 1.0 | 632 | $4,450 | $7.04 | 26d | 1 | 0.57mi |
| 821 Folsom St #401 San Francisco, CA | 1.0 | 1.0 | 652 | $3,650 | $5.60 | 26d | 1 | 0.59mi |
| 900 Folsom St San Francisco, CA | 2.0 | 1.0–2.0 | 863 | $6,324 | $7.33 | 0d | 27 | 0.61mi |
| 88 Arkansas St #105 San Francisco, CA | 1.0 | 1.0 | 604 | $4,000 | $6.62 | 45d | 1 | 0.62mi |
| 291 15th St San Francisco, CA | 1.0 | 1.0 | 550 | $2,695 | $4.90 | 26d | 1 | 0.63mi |
| 400 Clementina St #1449 San Francisco, CA | 1.0–2.0 | 1.0–2.0 | 775 | $5,210 | $6.72 | 3d | 2 | 0.64mi |
| 84 Harriet St Unit A San Francisco, CA | 1.0 | 1.0 | 718 | $3,295 | $4.59 | 22d | 1 | 0.65mi |
| 1 St Francis Pl San Francisco, CA | 3.0 | 1.0–2.0 | 923 | $4,365 | $4.73 | 0d | 4 | 0.65mi |
| 2 Townsend St San Francisco, CA | 1.0–2.0 | 1.0–2.0 | 786 | $6,925 | $8.81 | 0d | 4 | 0.66mi |
| 99 Rausch St San Francisco, CA | 1.0 | 1.0 | 655 | $4,250 | $6.49 | 26d | 1 | 0.73mi |
| 1222 Harrison St San Francisco, CA | 2.0 | 1.0–2.5 | 853 | $6,346 | $7.44 | 0d | 33 | 0.73mi |
| 601 Tennessee St San Francisco, CA | 1.0 | 1.0 | 426 | $3,695 | $8.67 | 45d | 2 | 0.76mi |
| 451 Kansas St #375 San Francisco, CA | 1.0 | 1.0 | 661 | $4,350 | $6.58 | 20d | 1 | 0.79mi |
| 434 Minna St San Francisco, CA | 2.0 | 1.0–2.0 | 719 | $6,581 | $9.15 | 0d | 15 | 0.80mi |
| 501 Delancey St #182 San Francisco, CA | 1.0 | 1.0 | 640 | $3,200 | $5.00 | 16d | 1 | 0.82mi |
| 603 Natoma St Apt 406 San Francisco, CA | 1.0 | 1.0 | 556 | $2,950 | $5.31 | 45d | 1 | 0.82mi |
| 45 Lansing St San Francisco, CA | 1.0 | 1.0 | 640 | $5,332 | $8.32 | 0d | 4 | 0.83mi |
| 390 1st St San Francisco, CA | 2.0 | 1.0–2.0 | 676 | $7,546 | $11.16 | 0d | 12 | 0.84mi |
| 3 Bayside Village Pl San Francisco, CA | 2.0 | 1.0–2.0 | 686 | $6,390 | $9.31 | 0d | 22 | 0.84mi |
| 2121 3rd St San Francisco, CA | 1.0–2.0 | 1.0–2.0 | 774 | $6,934 | $8.96 | 0d | 4 | 0.88mi |
| 340 Fremont St San Francisco, CA | 3.0 | 1.0–3.0 | 1146 | $7,028 | $6.13 | 3d | 5 | 0.92mi |
| 39 Tehama St San Francisco, CA | 1.0–2.0 | 1.0–2.0 | 1291 | $20,493 | $15.87 | 0d | 13 | 0.92mi |
| 500 Folsom St San Francisco, CA | 1.0 | 1.0 | 676 | $6,987 | $10.34 | 0d | 18 | 0.92mi |
| 399 Fremont St San Francisco, CA | 2.0 | 1.0–2.0 | 825 | $8,808 | $10.68 | 0d | 44 | 0.94mi |
| 1288 Howard St #1908 San Francisco, CA | 1.0–2.0 | 1.0–2.0 | 782 | $6,710 | $8.58 | 3d | 2 | 0.95mi |
| 1288 Howard St #604 San Francisco, CA | 1.0 | 1.0 | 431 | $3,400 | $7.89 | 45d | 1 | 0.95mi |
| 1188 Mission St San Francisco, CA | 1.0 | 1.0 | 448 | $3,333 | $7.43 | 0d | 17 | 0.95mi |
HOA detail condo
- Monthly dues
- $803 · $9,636/yr
- Likely covers
- gym
- Assessments
- None detected in remarks — confirm with the listing agent.
Listing history 4 events
-
2026-05-08$775,000 Active 1363-char remark
-
2014-12-19$760,900 Active 500-char remark
Show marketing remark (500 chars)
For comps purposes only. Arterra is San Francisco's premiere LEED-Silver luxury residential high rise. With designer, eco-friendly finishes; smart modern design, in-unit laundry & amenities galore, you will have everything you need & then some! Enjoy a luxurious lifestyle with the sunny panoramic view roof deck & BBQ, fitness center, community room, private guest suite & 24/7 attended lobby. Steps to Caltrain & easy freeway access. Walkscore = 98, Walker's Paradise.
-
2014-12-16soldstatus $761,000
-
2014-12-09soldstatus $760,900 Closed 500-char remark
Show marketing remark (500 chars)
For comps purposes only. Arterra is San Francisco's premiere LEED-Silver luxury residential high rise. With designer, eco-friendly finishes; smart modern design, in-unit laundry & amenities galore, you will have everything you need & then some! Enjoy a luxurious lifestyle with the sunny panoramic view roof deck & BBQ, fitness center, community room, private guest suite & 24/7 attended lobby. Steps to Caltrain & easy freeway access. Walkscore = 98, Walker's Paradise.
ⓘ Source: listings_history table (triggers on properties + properties_extension) + one-shot
backfill from property_details.listing_events for pre-trigger history.
Tax reassessment forecast CA · Resets to sale price
- Current annual tax
- $8,626 · $719/mo
- Projected year-2 tax
- $8,626 · $719/mo
- Expected delta
- $0/yr ($0/mo · 0.0%)
ⓘ Screening estimate from a state-policy table — verify with the county assessor before closing.
Climate risk First Street
- Flood 7/10 Severe FEMA zone X (unshaded) · 76% chance over 30 yrs
- Wildfire 1/10 Low
- Heat 2/10 Low 7 d/yr ≥78°F today · 16 d/yr by 30 yrs out
- Wind 1/10 Low
- Air quality 8/10 Severe 15 unhealthy d/yr today · 15 by 30 yrs out
Nearby sold comps map
Loading sold comps map…
Walkable amenities ~0.75 mi
Loading nearby amenities…
Taxation est. · year 1
- Rental income
- $68,071
- − Mortgage interest
- −$43,412
- − Property taxes
- −$8,626
- − Insurance
- −$4,672
- − Repairs & maintenance
- −$5,446
- − Management
- −$5,446
- − HOA
- −$9,636
- − Depreciation
- −$22,545
- Taxable loss
- −$31,713
- Est. tax savings @ 24.0%
- +$7,611
- After-tax cash flow
- $-10,318/yr
For passive investors: Depreciation is non-cash, so a rental often shows a tax loss while cash-flowing — sheltering income. Rental losses are passive: they offset passive income freely, and up to $25,000/yr can offset ordinary (W-2) income if you actively participate and your MAGI is under $100k (phasing out to $0 by $150k); unused losses carry forward. On sale, claimed depreciation is recaptured at up to 25%, and gains may owe capital-gains tax (a 1031 exchange can defer both). Figures are a year-1 estimate at your 24.0% rate — not tax advice; consult a CPA.
Schools (NCES district)
- District
- San Francisco Unified
- NCES district ID
- 0634410
- Math proficiency
- 50% ▬ 0.00%
- Reading proficiency
- 56% ▲ 1.00%
- Median HH income
- $81,249
- Composite
- 50.14/100
- National rank
- #4088
- State rank
- #322 of 1400 in CA
Livability — San Francisco
- Score
- 76/100
- State rank
- #90
- US rank
- #3143
Category grades
Schools grade is shown separately in the Schools card above.
Census & demographics
- Census place
- San Francisco, CA
- County
- San Francisco County · 827,552 people
- City population
- 827,552
- Metro
- San Francisco-Oakland-Berkeley, CA
- Population (ZIP)
- 11,314
- Household income
- $196,506
- Rent vs Own
- Severe rent burden
- 558.0
Population outlook (San Francisco County) Hauer SSP2
- Today (2025)
- 1,030,936 people
- By 2030
- 1,110,409 · +7.7%
- By 2040
- 1,270,010 · +23.2%
- By 2050
- 1,435,001 · +39.2%
- By 2075
- 1,779,074 · +72.6%
- By 2100
- 1,966,767 · +90.8%
Race, ethnicity, and origin ACS 2023
- Neighborhood character
- Highly diverse neighborhood (Simpson 0.74)
- Race & ethnicity
- Asian 43% White 21% Black 14% Hispanic / Latino 13% Two or more races 11% Pacific Islander 1%
- Hispanic origin (detail)
- Mexican 6%
- Common ancestry
- Estonian 3% Scotch-Irish 1% Italian 1%
- Foreign-born
- 42% · China, Canada, Vietnam
- Languages at home
- 49% English-only · Chinese 16% Other Indo-European 9% Spanish 9%
Political lean MEDSL · San Francisco
- 2024 margin
- Solid D (+64.8) · D 80.3% · R 15.5% · Other 4.1%
- 2008→2024 swing
- -5.7pp toward R · 2008: 70.5pp · 2024: 64.8pp
- All cycles
- 2024: D+64.8 2020: D+72.5 2016: D+76.1 2012: D+70.2 2008: D+70.5
Not yet ingested
- Civics
- —
Market trends
- HPI YoY
- ▲ 6.90%
- Current HPI
- 191.7034
- Rent YoY
- ▲ 21.00%
- Metro
- San Francisco-Oakland-Berkeley, CA
- State GDP YoY
- ▲ 3.21%
- F500 in state
- 116
Industry mix (Fortune 500 HQ in CA)
| Industry | F500 HQs | Revenue |
|---|---|---|
| Technology | 27 | $1,492B |
|
||
| Financial Services | 3 | $174B |
|
||
| Retail | 3 | $44B |
|
||
| Insurance | 3 | $26B |
|
||
| Media / Entertainment | 2 | $115B |
|
||
| Pharmaceuticals / Biotech | 2 | $62B |
|
||
Price history
+0.3% since first listed6 events — show timeline
- 2026-06-08 Sold (MLS) $763,000 San Francisco MLS
- 2026-05-22 Pending — San Francisco MLS
- 2026-05-08 Listed $775,000 San Francisco MLS
- 2014-12-19 Listed $760,900 San Francisco MLS
- 2014-12-16 Sold (Public Records) $761,000 Public Records
- 2014-12-09 Sold (MLS) $760,900 San Francisco MLS
Property tax history
+4.0%/yrLatest (2025): $8,626 · -12.5% YoY. Source: county tax records.
Cash-flow waterfall
monthlySold comps — $/sqft
last 12 mo · ≤1 miLoading sold comps…