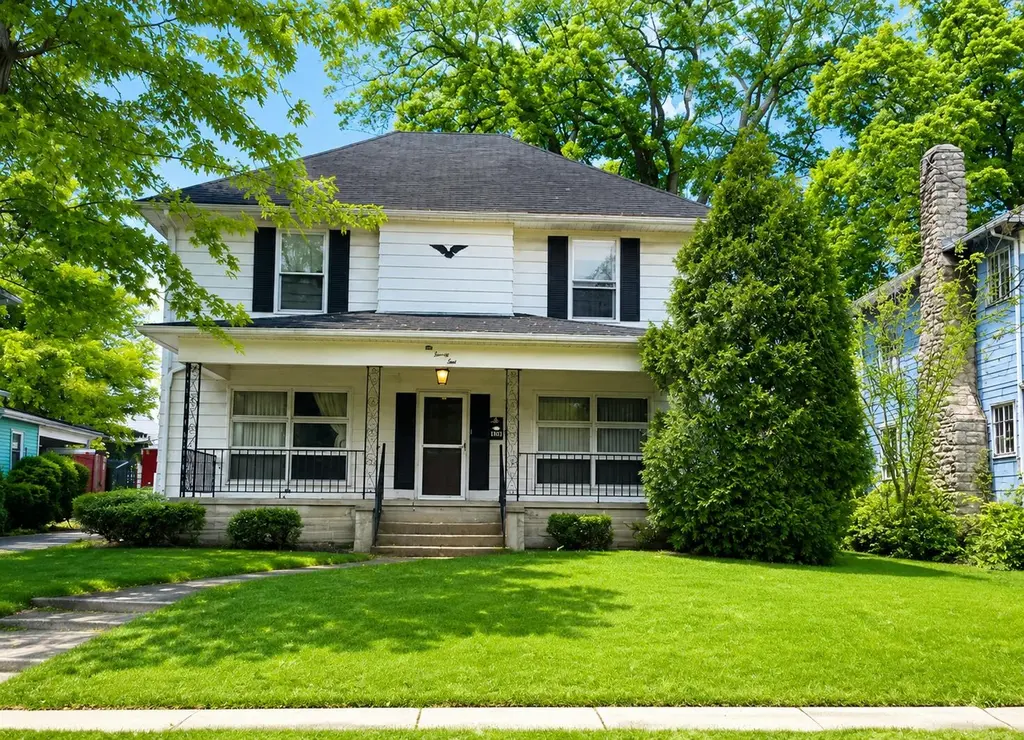
221 N Madriver St · Bellefontaine, OH
Flood risk 1/10 · Minimal
- FEMA flood zone
- X (unshaded)
- Chance of flooding over 30 yrs
- 0.0%
- Est. flood insurance / yr
- $473 – $860
Fire risk 1/10 · Minimal
- Est. fire insurance / yr
- $713 – $1,323
Heat risk 3/10 · Minor
- Hot days now (above 98°F)
- 7 days/yr
- Hot days in 30 yrs
- 18 days/yr
Wind risk 2/10 · Minimal
- Chance of severe wind over 30 yrs
- —
Air-quality risk 2/10 · Minimal
- Unhealthy air days now
- 1 days/yr
- Unhealthy air days in 30 yrs
- 2 days/yr
Risk factors via First Street. Map © Google.
Why this score? — see what drove the C- grade
The composite is a weighted blend of 9 inputs, each scored 0–100. Each bar is that input's sub-score; the figure is the points it added to the 100-point composite (weight × sub-score).
- Cash flow +15.1/30.0
- ARV discount +15.0/15.0
- Schools +4.8/10.0
- DSCR +4.6/10.0
- 1% rule +4.2/10.0
- Livability +3.8/5.0
- Rent growth +2.5/5.0
- Condition / age +2.5/5.0
- Appreciation +0.0/10.0
$184,900
🖨 Deal sheet (PDF) 📄 Offer letter ✓ Due diligence
Listing remarks
Unlock the potential of this timeless 1920s classic at 221 N. Madriver Street. Rich with character and opportunity, this spacious two-story home offers the perfect canvas for creating the home you've always envisioned. Whether your style leans toward the warm, sophisticated elegance of a Nancy Meyers-inspired interior or the enduring appeal of a modern Craftsman design. Inside, you'll find generously sized living spaces designed for both everyday living and entertaining. The main level features a formal living room, formal dining room, galley kitchen with an adjoining dining area, a large family room, and a full bath. Upstairs, four bedrooms and a second full bath provide ample space for fa
Key facts
- Large family room
- Formal dining room
- Galley kitchen
Tags
Property features AI
Exterior
- Parking: Carport; 1-car garage
- Utilities: Public sewer; Natural gas connected
- Home design: Single family residence; Residential property
- Construction: Built in 1920; Vinyl siding
- Exterior features: Residential lot; Lot dimensions approximately 55 x 220; Lot size about 0.27 acres; Supplied water
Interior
- Kitchen: Cooktop; Refrigerator
- Bedrooms: 4 bedrooms
- Flooring: Wood flooring
- Bathrooms: 2 full bathrooms
- Heating & cooling: Forced air heating; Natural gas
- Interior features: 12 total rooms; Entrance; Living room; Dining room; Family room; Breakfast area
- Laundry & utility: Crawl space/partial unfinished basement
Neighborhood map
What this means for you Summary
Snapshot
- This is a 4-bed/1.5-bath single-family listed at $185k.
Deal economics
- At list price, monthly cash flow is $61 ($736/yr) — positive.
- The deal already cash-flows at list — no discount required.
- To meet the 1% rule (rent ≥ 1% of price), the offer needs to be $170k (8.1% below list).
- Recommended offer: $170k (8.1% below list) — sets the bar for 1% rule.
- Cap rate 6.7% vs local median 3.7% in Bellefontaine — top-decile yield for the area; either an underpriced asset or a hidden risk that comps aren't pricing in. Stress-test before assuming the spread holds.
Location & tenants
- Location reads 76/100 on livability (#213 in OH, #3,316 nationally) — a middle-class / working-renter tenant base. Strengths: crime A+, cost of living A+, housing A+; Watch: employment D+, amenities F, commute F.
- Bellefontaine City (town): math 55% / reading 59% proficiency, ranked #348 of 656 in OH (top 53%) — acceptable for families but not a draw, mixed tenant base, ~2y average lease.
- Zoned schools: Bellefontaine Elementary School (557 students, 50% FRL); Bellefontaine Middle School (math 55% / reading 54%, grade B-, #342 of 654 statewide, top 54%, 494 students, 45% FRL); Bellefontaine High School (math 42% / reading 67%, grade C-, #303 of 781 statewide, top 42%, 692 students, 41% FRL) — zoned schools at 45% FRL track the district average.
- Market conditions: 152 active listings in the ZIP; 1 comparable units currently listed for rent nearby; 121 units permitted in Logan County in 2024 (0 in 5+ unit buildings).
- This rent runs 32% of the median local income ($64k/yr) — at the standard rent-burdened threshold; future hikes will face affordability resistance.
Forward outlook
- Local home prices are declining (-3.0%/yr); year-one equity from $1k of loan paydown is wiped out by about $6k of value loss. Plan a longer hold.
- Logan County population projected at -15% by 2050 — secular population decline; favor cash flow + early exit over multi-decade hold.
Negotiation context
- Only 5 days on market — expect competitive offers; lowballing is unlikely to land.
Risks & watch-outs
- Watch-outs: built in 1920 — expect roof / HVAC / electrical / plumbing capex.
Questions for the listing agent
- Built in 1920 — when were the roof, HVAC, electrical panel, plumbing, and water heater last replaced?
- Is there a deadline driving the sale (1031 exchange, divorce, estate, relocation)? That informs how much negotiation room exists.
- What's the average days-on-market for RENTAL listings here right now (not sales)? A rising rental-DOM trend means longer vacancies and softer asking-rent achievability than the comps imply.
- What's the recent tenant-quality profile in this submarket — average credit score on applications, eviction rate, late-payment / NSF rate, and stable-employment percentage? A property-management company in the area should have these aggregated.
- How much new for-sale + rental construction is in the pipeline within 1–3 miles? Heavy new supply typically softens prices + rents 12–24 months out; constrained supply supports both.
Investment metrics
- 1% rule
- 0.92% ✗
- Cap rate
- 6.69%
- Cash-on-cash
- 1.42%
- DSCR
- 1.06
- GRM
- 9.1
CMA / ARV
- ARV (on-the-fly)
- $246,400
- Comps found
- 12
Show comp detail 12 sales within ~0.75 mi
| Address | Dist | Beds/Ba | Sqft | Sold | Price | $/sf | Match |
|---|---|---|---|---|---|---|---|
| 612 N Detroit St | 0.39mi | 4/2.0 | 2,068 (-6%) | 2mo | $125,000 | $60 | 68 |
| 320 N Madriver St | 0.09mi | 4/2.0 | 2,378 (+8%) | 14mo | $275,000 | $116 | 68 |
| 301 N Elm St | 0.29mi | 5/2.0 (+1) | 2,024 (-8%) | 1mo | $222,000 | $110 | 65 |
| 436 E Columbus Ave | 0.36mi | 4/2.0 | 2,344 (+6%) | 11mo | $272,000 | $116 | 61 |
| 230 W Brown Ave | 0.27mi | 4/2.0 | 2,391 (+9%) | 12mo | $195,000 | $82 | 61 |
| 525 N Main St | 0.31mi | 5/3.0 (+1) | 2,448 (+11%) | 1mo | $290,000 | $118 | 55 |
| 508 Hamilton St | 0.57mi | 4/1.5 | 2,352 (+7%) | 12mo | $208,500 | $89 | 52 |
| 324 W Sandusky Ave | 0.20mi | 5/2.5 (+1) | 2,512 (+14%) | 10mo | $272,000 | $108 | 50 |
| 228 S Evansville St | 0.74mi | 3/1.0 (-1) | 2,105 (-4%) | 6mo | $170,000 | $81 | 46 |
| 560 N Park St | 0.38mi | 4/2.0 | 1,940 (-12%) | 20mo | $300,000 | $155 | 44 |
| 921 N Main St | 0.72mi | 4/2.0 | 1,920 (-13%) | 9mo | $215,000 | $112 | 36 |
| 523 Dakota Rd | 0.62mi | 3/2.5 (-1) | 1,948 (-12%) | 18mo | $334,900 | $172 | 28 |
Match score weights: distance 35% · size 25% · config 20% · recency 20%. Top-matched comps best support the ARV.
Projected returns pro-forma
-3.0% appreciation · 3.0% rent growth · sell at horizon
- IRR
- -14.0%
- Equity multiple
- 0.50×
- Total profit
- $-26,028
- Equity at exit
- $27,569
- IRR
- -5.2%
- Equity multiple
- 0.66×
- Total profit
- $-17,521
- Equity at exit
- $15,987
Cash invested: $51,772 (down + closing). Projections, not guarantees.
Landlord ↔ Tenant lean methodology
- Overall (STATE)
- 73 Landlord-Friendly
- State Ohio
- 73 Landlord-Friendly · R+6
- County
- — inherits STATE
- City
- — inherits STATE
ZIP-level market 43311
- Active inventory
- 152
- Price-to-rent
- 9.1×
Monthly cashflow live
- Estimated rent
- $1,700 medium interval (Pro) →
- Mortgage (P&I)
- −$970
- Tax from tax record
- −$235 /mo · $2,820/yr
- Insurance
- −$77
- HOA
- −$0
- Vacancy / Maint / Mgmt
- −$357
- Net cashflow
- $61
Break-even live
Sensitivity live
| Price | -10% $166 | -5% $114 | +0% $61 | +5% $9 | +10% $-43 |
|---|---|---|---|---|---|
| Rent | -10% $-73 | -5% $-6 | +0% $61 | +5% $128 | +10% $196 |
| Rate | -1.0pp $154 | -0.5pp $108 | base $61 | +0.5pp $13 | +1.0pp $-35 |
UW: 25.0% down · 7.5% · 30yr · 1.5% tax · 5.0% vac · 8.0% maint · 8.0% mgmt
Financing live
Cash to close
- Down payment
- $46,225
- Closing costs
- $5,547
- Reserves months
- —
- Total cash needed
- —
Loan-product check · same deal, 3 products live
Conventional
25% down · 7.5% · 30yr
- Down + closing
- —
- Monthly P&I
- —
- Monthly cashflow
- —
- DSCR
- —
- Eligible?
- —
Personal DTI + credit; lowest rate.
DSCR
20% down · 8.5% · 30yr
- Down + closing
- —
- Monthly P&I
- —
- Monthly cashflow
- —
- DSCR
- —
- Eligible?
- —
No personal income docs; deal must DSCR.
Hard money
10% down · 12.0% · 12mo
- Down + closing
- —
- Monthly P&I
- —
- Monthly cashflow
- —
- DSCR
- —
- Eligible?
- —
Short-term bridge; refi at stabilization.
Rent comps 1 comps
| Address | Beds | Baths | Sqft | Rent | $/sqft | DOM | Units | Dist |
|---|---|---|---|---|---|---|---|---|
| 520 N Madriver St Bellefontaine, OH | 4.0 | 1.5 | 1600 | $1,700 | $1.06 | 45d | 1 | 0.30mi |
Listing history 5 events
-
2026-06-22days on market $184,900 Active 5 DOM
-
2026-06-21days on market $184,900 Active 4 DOM
-
2026-06-21days on market $184,900 Active 3 DOM
-
2026-06-18remarks 699-char remark
-
2026-06-18$184,900 Active 1 DOM
ⓘ Source: listings_history table (triggers on properties + properties_extension) + one-shot
backfill from property_details.listing_events for pre-trigger history.
Tax reassessment forecast OH · Partial reset (capped growth)
- Current annual tax
- $2,820 · $235/mo
- Projected year-2 tax
- $2,852 · $238/mo
- Expected delta
- +$32/yr (+$3/mo · 1.1%)
ⓘ Screening estimate from a state-policy table — verify with the county assessor before closing.
Climate risk First Street
- Flood 1/10 Low FEMA zone X (unshaded) · 0% chance over 30 yrs
- Wildfire 1/10 Low
- Heat 3/10 Moderate 7 d/yr ≥98°F today · 18 d/yr by 30 yrs out
- Wind 2/10 Low
- Air quality 2/10 Low 1 unhealthy d/yr today · 2 by 30 yrs out
Nearby sold comps map
Loading sold comps map…
Walkable amenities ~0.75 mi
Loading nearby amenities…
Taxation est. · year 1
- Rental income
- $20,400
- − Mortgage interest
- −$10,357
- − Property taxes
- −$2,820
- − Insurance
- −$924
- − Repairs & maintenance
- −$1,632
- − Management
- −$1,632
- − Depreciation
- −$5,379
- Taxable loss
- −$2,345
- Est. tax savings @ 24.0%
- +$563
- After-tax cash flow
- $1,299/yr
For passive investors: Depreciation is non-cash, so a rental often shows a tax loss while cash-flowing — sheltering income. Rental losses are passive: they offset passive income freely, and up to $25,000/yr can offset ordinary (W-2) income if you actively participate and your MAGI is under $100k (phasing out to $0 by $150k); unused losses carry forward. On sale, claimed depreciation is recaptured at up to 25%, and gains may owe capital-gains tax (a 1031 exchange can defer both). Figures are a year-1 estimate at your 24.0% rate — not tax advice; consult a CPA.
Schools (NCES district)
- District
- Bellefontaine City
- NCES district ID
- 3904358
- Math proficiency
- 55% ▼ -10.00%
- Reading proficiency
- 59% ▼ -6.00%
- Median HH income
- $43,270
- Composite
- 47.94/100
- National rank
- #2207
- State rank
- #348 of 656 in OH
Livability — Bellefontaine
- Score
- 76/100
- State rank
- #213
- US rank
- #3316
Category grades
Schools grade is shown separately in the Schools card above.
Census & demographics
- Census place
- Bellefontaine, OH
- County
- Logan · 47,256 people
- City population
- 20,074
- Population (ZIP)
- 20,074
- Household income
- $64,217
- Rent vs Own
- Severe rent burden
- 10.1
Population outlook (Logan County) Hauer SSP2
- Today (2025)
- 44,240 people
- By 2030
- 43,166 · -2.4%
- By 2040
- 40,495 · -8.5%
- By 2050
- 37,511 · -15.2%
- By 2075
- 30,453 · -31.2%
- By 2100
- 23,081 · -47.8%
Race, ethnicity, and origin ACS 2023
- Neighborhood character
- Predominantly White (90%)
- Race & ethnicity
- White 90% Two or more races 5% Black 3% Hispanic / Latino 2%
- Common ancestry
- Italian 4% Slovak 4% Lithuanian 2%
- Foreign-born
- 2% · Canada
- Languages at home
- 98% English-only · Spanish 1%
Political lean MEDSL · Logan
- 2024 margin
- Solid R (+56.2) · D 21.5% · R 77.7%
- 2008→2024 swing
- -29.6pp toward R · 2008: -26.6pp · 2024: -56.2pp
- All cycles
- 2024: R+56.2 2020: R+55.2 2016: R+52.6 2012: R+31.8 2008: R+26.6
Not yet ingested
- Civics
- —
Market trends
- HPI YoY
- ▼ -182.18%
- Current HPI
- 243.9954
- Rent YoY
- —
- Metro
- —
- State GDP YoY
- ▲ 1.98%
- F500 in state
- 48
Industry mix (Fortune 500 HQ in OH)
| Industry | F500 HQs | Revenue |
|---|---|---|
| Insurance | 3 | $145B |
|
||
| Industrial Machinery | 3 | $49B |
|
||
| Financial Services | 3 | $24B |
|
||
| Consumer Goods | 2 | $93B |
|
||
| Aerospace / Defense | 2 | $47B |
|
||
| Utilities | 2 | $33B |
|
||
Price history
1 event — show timeline
- 2026-06-16 Listed $184,900 WRIST
Property tax history
+9.5%/yrLatest (2025): $2,820 · +34.8% YoY. Source: county tax records.
Cash-flow waterfall
monthlySold comps — $/sqft
last 12 mo · ≤1 miLoading sold comps…