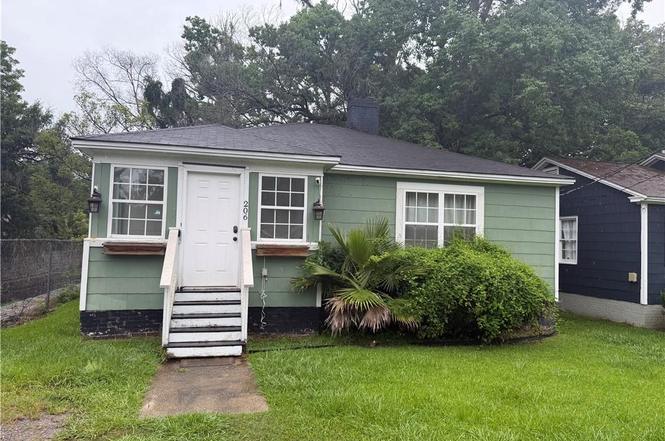
206 Morgan Ave · Mobile, AL
Flood risk 9/10 · Severe
- FEMA flood zone
- AE
- Chance of flooding over 30 yrs
- 0.99%
- Est. flood insurance / yr
- $1,737 – $8,500
Fire risk 1/10 · Minimal
- Est. fire insurance / yr
- $916 – $1,700
Heat risk 9/10 · Severe
- Hot days now (above 105°F)
- 7 days/yr
- Hot days in 30 yrs
- 19 days/yr
Wind risk 9/10 · Severe
- Chance of severe wind over 30 yrs
- 99.0%
Air-quality risk 2/10 · Minimal
- Unhealthy air days now
- 1 days/yr
- Unhealthy air days in 30 yrs
- 1 days/yr
Risk factors via First Street. Map © Google.
Why this score? — see what drove the C- grade
The composite is a weighted blend of 9 inputs, each scored 0–100. Each bar is that input's sub-score; the figure is the points it added to the 100-point composite (weight × sub-score).
- Cash flow +15.7/30.0
- ARV discount +15.0/15.0
- DSCR +4.9/10.0
- 1% rule +4.0/10.0
- Rent growth +3.8/5.0
- Livability +3.8/5.0
- Condition / age +2.5/5.0
- Schools +2.3/10.0
- Appreciation +0.0/10.0
$169,900
🖨 Deal sheet 📄 Offer letter ✓ Due diligence
Listing remarks
Welcome to 206 Morgan Ave, a charming cottage-style home located in the heart of Midtown Mobile, AL. This 2-bedroom, 1-bath home offers 922 square feet of inviting living space with classic character and functional updates throughout. Inside, you’ll find beautiful hardwood floors, a cozy fireplace, and a comfortable layout that makes the home feel warm and welcoming. The dedicated laundry room adds everyday convenience, while the covered and screened deck creates the perfect outdoor living space overlooking the fenced backyard. A durable metal roof and backyard storage building add long-term value and practicality. Currently operating as an Airbnb, this property is being sold furnishe
Key facts
- Durable metal roof
- Fenced backyard
- Cottage style home
Tags
Property features AI
Exterior
- Parking: Driveway
- Utilities: Electricity available (110 volts); Public sewer available; Water available
- Home design: Single family residence; Residential property
- Construction: Built in 1941; Asbestos, frame and wood siding construction; Shingle roof; Brick/mortar foundation
- Exterior features: Chain link fencing; Shed(s); View
Interior
- Kitchen: Stone countertops; Dishwasher; Electric oven; Microwave; Refrigerator
- Bedrooms: 3 bedrooms
- Flooring: Ceramic tile; Hardwood
- Bathrooms: 1 full bathroom; 1 half bathroom
- Heating & cooling: Central heating; Central air conditioning
- Interior features: Other interior features; Fireplace
Neighborhood map
What this means for you Summary
Snapshot
- This is a 3-bed/2.0-bath single-family listed at $170k.
Deal economics
- At list price, monthly cash flow is $-351 ($-4k/yr) — negative.
- To cash-flow at today's rent, offer at most $108k (36.5% below list).
- To meet the 1% rule (rent ≥ 1% of price), the offer needs to be $152k (10.4% below list).
- Recommended offer: $108k (36.5% below list) — sets the bar for cash-flow.
- Cap rate 6.8% vs local median 4.9% in Mobile — top-decile yield for the area; either an underpriced asset or a hidden risk that comps aren't pricing in. Stress-test before assuming the spread holds.
Location & tenants
- Location reads 75/100 on livability (#20 in AL, #4,262 nationally) — a middle-class / working-renter tenant base. Strengths: commute A+, cost of living A+, housing A+; Watch: schools D-, crime F, employment D-.
- Mobile County (urban): math 15% / reading 39% proficiency, ranked #81 of 129 in AL (top 63%) — low school quality limits family demand, transient renter base, plan for 1-2y turnover; 67% free/reduced lunch — lower-income household profile, screen leases tightly.
- Market conditions: Rents rising fast (+5.1%/yr); 174 active listings in the ZIP; 40 comparable units currently listed for rent nearby; rentals at typical pace (median 21d on market — plan ~3-4 weeks tenant-placement turnaround); 45% of comp listings sitting > 30 days — soft ceiling on asking rent; 1,678 units permitted in Mobile County in 2024 (264 in 5+ unit buildings).
- This rent runs 36% of the median local income ($51k/yr) — at the standard rent-burdened threshold; future hikes will face affordability resistance.
Forward outlook
- Local home prices are declining (-3.0%/yr); year-one equity from $1k of loan paydown is wiped out by about $5k of value loss. Plan a longer hold.
- Mobile County population projected to shrink 8% by 2050 — rents likely to lag national; underwrite the cash flow, not the appreciation.
Negotiation context
- Only 2 days on market — expect competitive offers; lowballing is unlikely to land.
- 5 sale attempts since 3y ago with the ask held roughly flat each time — persistent listings suggest the price (not the market) is what's stuck; bring a comps-based counter.
Risks & watch-outs
- Watch-outs: flood insurance adds $427/mo; built in 1941 — expect roof / HVAC / electrical / plumbing capex.
- Climate carrying-cost: in FEMA flood zone AE (mandatory federal flood insurance); severe wind risk, 99% chance of damaging wind over 30y; extreme-heat days projected 7→19/yr by 2055 (HVAC capex compounding) — expect insurance premiums to compound above CPI over the hold.
Questions for the listing agent
- What do current leases actually rent for vs. the listed asking? Can we see a recent rent roll and the last 12 months of T-12 income?
- Built in 1941 — when were the roof, HVAC, electrical panel, plumbing, and water heater last replaced?
- What's the actual annual flood-insurance premium (NFIP or private), and is the property in a SFHA with mandatory coverage?
- Is there a deadline driving the sale (1031 exchange, divorce, estate, relocation)? That informs how much negotiation room exists.
- Schools are D-rated, which usually means shorter tenancies and higher turnover. Who's the typical renter profile here, and what's been the actual vacancy rate?
- Crime grade is F in this area — have there been break-ins, vandalism, or insurance claims at this property in the last 3 years? What carrier currently insures it and at what premium?
- What's the average days-on-market for RENTAL listings here right now (not sales)? A rising rental-DOM trend means longer vacancies and softer asking-rent achievability than the comps imply.
- What's the recent tenant-quality profile in this submarket — average credit score on applications, eviction rate, late-payment / NSF rate, and stable-employment percentage? A property-management company in the area should have these aggregated.
- How much new for-sale + rental construction is in the pipeline within 1–3 miles? Heavy new supply typically softens prices + rents 12–24 months out; constrained supply supports both.
Investment metrics
- 1% rule
- 0.90% ✗
- Cap rate
- 6.83%
- Cash-on-cash
- 1.91%
- DSCR
- 1.09
- GRM
- 9.3
CMA / ARV
- ARV (on-the-fly)
- $216,968
- Comps found
- 12
Show comp detail 12 sales within ~0.75 mi
| Address | Dist | Beds/Ba | Sqft | Sold | Price | $/sf | Match |
|---|---|---|---|---|---|---|---|
| 160 Emogene Pl | 0.45mi | 3/2.0 | 1,520 (+4%) | 2mo | $195,000 | $128 | 71 |
| 2656 Foreman Cir | 0.55mi | 3/2.0 | 1,500 (+2%) | 2mo | $145,000 | $97 | 69 |
| 258 W Mount Island Dr | 0.23mi | 2/1.0 (-1) | 1,350 (-8%) | 2mo | $263,500 | $195 | 66 |
| 2757 S Sherwood Dr | 0.69mi | 3/1.5 | 1,510 (+3%) | 0mo | $218,000 | $144 | 60 |
| 1841 Woodcock Pl | 0.53mi | 3/2.0 | 1,327 (-10%) | 0mo | $195,000 | $147 | 59 |
| 1833 Woodcock Pl | 0.53mi | 3/2.0 | 1,317 (-10%) | 1mo | $195,000 | $148 | 58 |
| 53 Carlen St S | 0.74mi | 3/2.0 | 1,383 (-6%) | 1mo | $300,000 | $217 | 55 |
| 2663 Foreman Cir | 0.57mi | 4/2.0 (+1) | 1,587 (+8%) | 1mo | $185,000 | $117 | 54 |
| 1813 Woodcock St | 0.53mi | 3/2.0 | 1,269 (-13%) | 1mo | $195,000 | $154 | 52 |
| 2756 Jennings Dr | 0.71mi | 3/2.0 | 1,300 (-11%) | 0mo | $215,000 | $165 | 47 |
| 2667 Emogene St | 0.62mi | 4/3.0 (+1) | 1,591 (+8%) | 2mo | $55,000 | $35 | 46 |
| 2103 Upham Pl | 0.73mi | 3/2.0 | 1,667 (+14%) | 2mo | $289,750 | $174 | 41 |
Match score weights: distance 35% · size 25% · config 20% · recency 20%. Top-matched comps best support the ARV.
Projected returns pro-forma
-3.0% appreciation · 5.06% rent growth · sell at horizon
- IRR
- -28.5%
- Equity multiple
- 0.02×
- Total profit
- $-46,392
- Equity at exit
- $25,333
- IRR
- -18.9%
- Equity multiple
- -0.14×
- Total profit
- $-54,334
- Equity at exit
- $14,690
Cash invested: $47,572 (down + closing). Projections, not guarantees.
Landlord ↔ Tenant lean methodology
- Overall (STATE)
- 90 Strongly Landlord-Friendly
- State Alabama
- 90 Strongly Landlord-Friendly · R+15
- County
- — inherits STATE
- City
- — inherits STATE
ZIP-level market 36606
- Rents YoY
- 5.1%
- Active inventory
- 174
- Price-to-rent
- 9.3×
Monthly cashflow live
- Estimated rent
- $1,523 high interval (Pro) →
- Mortgage (P&I)
- −$891
- Tax from tax record
- −$165 /mo · $1,984/yr
- Insurance
- −$71
- Flood insurance flood zone
- −$427 /mo · $5,118/yr
- HOA
- −$0
- Vacancy / Maint / Mgmt
- −$320
- Net cashflow
- $-351
Break-even live
UW: 25.0% down · 7.5% · 30yr · 1.5% tax · 5.0% vac · 8.0% maint · 8.0% mgmt
Financing live
Cash to close
- Down payment
- $42,475
- Closing costs
- $5,097
- Reserves months
- —
- Total cash needed
- —
Loan-product check · same deal, 3 products live
Conventional
25% down · 7.5% · 30yr
- Down + closing
- —
- Monthly P&I
- —
- Monthly cashflow
- —
- DSCR
- —
- Eligible?
- —
Personal DTI + credit; lowest rate.
DSCR
20% down · 8.5% · 30yr
- Down + closing
- —
- Monthly P&I
- —
- Monthly cashflow
- —
- DSCR
- —
- Eligible?
- —
No personal income docs; deal must DSCR.
Hard money
10% down · 12.0% · 12mo
- Down + closing
- —
- Monthly P&I
- —
- Monthly cashflow
- —
- DSCR
- —
- Eligible?
- —
Short-term bridge; refi at stabilization.
Rent comps 40 comps
| Address | Beds | Baths | Sqft | Rent | $/sqft | DOM | Units | Dist |
|---|---|---|---|---|---|---|---|---|
| 2503 Richard Ave Mobile, AL | 2.0 | 1.0 | 928 | $805 | $0.87 | 13d | 1 | 0.17mi |
| 2507 Taylor Ave Mobile, AL | 3.0 | 1.0 | 1230 | $1,495 | $1.22 | 13d | 1 | 0.20mi |
| 104 Ellinor St Mobile, AL | 2.0 | 1.0 | 896 | $1,275 | $1.42 | 21d | 1 | 0.25mi |
| 200 S Florida St Unit 101 Mobile, AL | 2.0 | 2.0 | 1150 | $1,375 | $1.20 | 21d | 1 | 0.35mi |
| 209 S Fulton St Mobile, AL | 2.0 | 1.5 | 1255 | $1,750 | $1.39 | 21d | 1 | 0.39mi |
| 2656 Pathway Pl Mobile, AL | 2.0–3.0 | 1.0 | 778 | $1,261 | $1.62 | 13d | 9 | 0.42mi |
| 182 Williams St Unit 1043570P Mobile, AL | 3.0 | 1.0 | 1399 | $2,476 | $1.77 | 13d | 1 | 0.43mi |
| 562 Clarke St Mobile, AL | 2.0 | 1.0 | 1061 | $1,025 | $0.97 | 43d | 1 | 0.67mi |
| 2604 Dauphin St Mobile, AL | 2.0 | 1.0 | 950 | $1,072 | $1.13 | 43d | 2 | 0.69mi |
| 2604 Dauphin St #210 Mobile, AL | 2.0 | 1.0 | 950 | $1,150 | $1.21 | 21d | 1 | 0.69mi |
| 107 Grand Blvd Mobile, AL | 2.0 | 2.0 | 1200 | $1,295 | $1.08 | 21d | 1 | 0.69mi |
| 122 Demouy Ave Unit 1/2 Mobile, AL | 2.0 | 1.0 | 1300 | $1,530 | $1.18 | 43d | 1 | 0.73mi |
| 615 Mohawk St Mobile, AL | 3.0 | 1.0 | 1172 | $1,500 | $1.28 | 43d | 1 | 0.74mi |
| 418 Durande Dr Mobile, AL | 3.0 | 2.0 | 1456 | $1,350 | $0.93 | 13d | 1 | 0.75mi |
| 168 W Collins St Mobile, AL | 3.0 | 1.0 | 968 | $725 | $0.75 | 21d | 1 | 0.77mi |
| 618 Clarke St Mobile, AL | 3.0 | 1.0 | 1427 | $1,200 | $0.84 | 43d | 1 | 0.77mi |
| 2500 Dauphinwood Dr Mobile, AL | 2.0–3.0 | 1.0–2.0 | 1250 | $1,395 | $1.12 | 13d | 19 | 0.80mi |
| 561 Dauphin Island Pkwy Mobile, AL | 4.0 | 2.0 | 1389 | $1,050 | $0.76 | 43d | 1 | 0.83mi |
| 150 Dunn Ave Mobile, AL | 3.0 | 2.0 | 1455 | $1,250 | $0.86 | 21d | 1 | 0.87mi |
| 611 Dauphin Island Pkwy Mobile, AL | 3.0 | 2.0 | 1450 | $1,300 | $0.90 | 43d | 1 | 0.90mi |
| 315 Hadrian St Mobile, AL | 3.0 | 2.0 | 1843 | $1,800 | $0.98 | 43d | 1 | 0.90mi |
| 2855 Potter Dr Mobile, AL | 2.0 | 1.0 | 1127 | $1,050 | $0.93 | 43d | 1 | 0.93mi |
| 2859 Brierwood Dr Mobile, AL | 3.0 | 1.0 | 1057 | $1,500 | $1.42 | 13d | 1 | 0.94mi |
| 2861 Ralston Rd Mobile, AL | 3.0 | 2.0 | 1617 | $1,650 | $1.02 | 43d | 1 | 0.95mi |
| 713 Iris Ave Mobile, AL | 3.0 | 1.0 | 1617 | $1,300 | $0.80 | 21d | 1 | 0.95mi |
| 2861 Potter Dr Unit 1043844P Mobile, AL | 3.0 | 2.0 | 1496 | $2,492 | $1.67 | 21d | 1 | 0.96mi |
| 2863 Potter Dr Unit 1043693P Mobile, AL | 4.0 | 2.0 | 1496 | $3,049 | $2.04 | 13d | 1 | 0.98mi |
| 129 Shell Road Pl Unit 1043713P Mobile, AL | 4.0 | 2.0 | 1496 | $3,389 | $2.27 | 21d | 1 | 1.05mi |
| 1660 Laurel St Mobile, AL | 3.0 | 2.0 | 1768 | $2,200 | $1.24 | 13d | 1 | 1.06mi |
| 186 Stanton Rd Mobile, AL | 1.0–3.0 | 1.0–2.5 | 1263 | $2,450 | $1.94 | 43d | 1 | 1.08mi |
| 1704 McGill Ave Unit B Mobile, AL | 3.0 | 2.5 | 1500 | $1,750 | $1.17 | 43d | 1 | 1.09mi |
| 461 Magnolia Rd Unit A Mobile, AL | 2.0 | 1.0 | 989 | $825 | $0.83 | 43d | 1 | 1.09mi |
| 706 Cherokee St Mobile, AL | 3.0 | 1.0 | 1260 | $1,375 | $1.09 | 21d | 1 | 1.12mi |
| 107 Macy Pl Mobile, AL | 3.0 | 2.0 | 1800 | $2,250 | $1.25 | 43d | 1 | 1.23mi |
| 817 Hawkins St Mobile, AL | 3.0 | 1.0 | 1217 | $1,200 | $0.99 | 43d | 1 | 1.23mi |
| 2008 W Victory Dr Mobile, AL | 3.0 | 1.0 | 1011 | $1,200 | $1.19 | 43d | 1 | 1.25mi |
| 3060 Emogene St Mobile, AL | 3.0 | 1.0 | 1200 | $1,400 | $1.17 | 13d | 1 | 1.25mi |
| 900 Courtney St Mobile, AL | 2.0 | 1.0 | 1020 | $1,200 | $1.18 | 43d | 1 | 1.29mi |
| 2068 Victory Ct Mobile, AL | 4.0 | 1.0 | 1259 | $1,225 | $0.97 | 43d | 1 | 1.31mi |
| 305 Indian Creek Dr E Unit 1043809P Mobile, AL | 3.0 | 2.5 | 1496 | $3,985 | $2.66 | 13d | 1 | 1.32mi |
Listing history 3 events
-
2026-06-18days on market $169,900 Active 2 DOM
-
2026-06-17remarks 693-char remark
-
2026-06-17$169,900 Active 1 DOM
ⓘ Source: listings_history table (triggers on properties + properties_extension) + one-shot
backfill from property_details.listing_events for pre-trigger history.
Tax reassessment forecast AL · Resets to sale price
- Current annual tax
- $1,984 · $165/mo
- Projected year-2 tax
- $1,984 · $165/mo
- Expected delta
- $0/yr ($0/mo · -0.0%)
ⓘ Screening estimate from a state-policy table — verify with the county assessor before closing.
Climate risk First Street
- Flood 9/10 Extreme FEMA zone AE · 99% chance over 30 yrs
- Wildfire 1/10 Low
- Heat 9/10 Extreme 7 d/yr ≥105°F today · 19 d/yr by 30 yrs out
- Wind 9/10 Extreme 99% chance of damaging wind over 30 yrs
- Air quality 2/10 Low 1 unhealthy d/yr today · 1 by 30 yrs out
Nearby sold comps map
Loading sold comps map…
Walkable amenities ~0.75 mi
Loading nearby amenities…
Taxation est. · year 1
- Rental income
- $18,272
- − Mortgage interest
- −$9,517
- − Property taxes
- −$1,984
- − Insurance
- −$5,968
- − Repairs & maintenance
- −$1,462
- − Management
- −$1,462
- − Depreciation
- −$4,943
- Taxable loss
- −$7,063
- Est. tax savings @ 24.0%
- +$1,695
- After-tax cash flow
- $-2,514/yr
For passive investors: Depreciation is non-cash, so a rental often shows a tax loss while cash-flowing — sheltering income. Rental losses are passive: they offset passive income freely, and up to $25,000/yr can offset ordinary (W-2) income if you actively participate and your MAGI is under $100k (phasing out to $0 by $150k); unused losses carry forward. On sale, claimed depreciation is recaptured at up to 25%, and gains may owe capital-gains tax (a 1031 exchange can defer both). Figures are a year-1 estimate at your 24.0% rate — not tax advice; consult a CPA.
Schools (NCES district)
- District
- Mobile County
- NCES district ID
- 0102370
- Math proficiency
- 15% ▼ -28.00%
- Reading proficiency
- 39% ▬ 0.00%
- Median HH income
- $42,455
- Composite
- 22.9/100
- National rank
- #8002
- State rank
- #81 of 129 in AL
Livability — Mobile
- Score
- 75/100
- State rank
- #20
- US rank
- #4262
Category grades
Schools grade is shown separately in the Schools card above.
Census & demographics
- Census place
- Mobile, AL
- County
- Mobile County · 246,577 people
- City population
- 205,729
- Metro
- Mobile, AL
- Population (ZIP)
- 18,728
- Household income
- $51,303
- Rent vs Own
- Severe rent burden
- 999.0
Population outlook (Mobile County) Hauer SSP2
- Today (2025)
- 415,303 people
- By 2030
- 411,755 · -0.9%
- By 2040
- 399,670 · -3.8%
- By 2050
- 382,616 · -7.9%
- By 2075
- 337,353 · -18.8%
- By 2100
- 283,391 · -31.8%
Race, ethnicity, and origin ACS 2023
- Neighborhood character
- Majority Black (56%)
- Race & ethnicity
- Black 56% White 37% Two or more races 5% Hispanic / Latino 4%
- Common ancestry
- Italian 2% Scottish 2% Lithuanian 1%
- Foreign-born
- 3% · Canada
- Languages at home
- 96% English-only · Spanish 3%
Political lean MEDSL · Mobile
- 2024 margin
- R (+16.4) · D 41.3% · R 57.7%
- 2008→2024 swing
- -7.7pp toward R · 2008: -8.7pp · 2024: -16.4pp
- All cycles
- 2024: R+16.4 2020: R+11.9 2016: R+13.9 2012: R+9.3 2008: R+8.7
Not yet ingested
- Civics
- —
Market trends
- HPI YoY
- ▼ -232.19%
- Current HPI
- 145.9025
- Rent YoY
- ▲ 5.06%
- Metro
- Mobile, AL
- State GDP YoY
- ▲ 2.94%
- F500 in state
- 4
Industry mix (Fortune 500 HQ in AL)
| Industry | F500 HQs | Revenue |
|---|---|---|
| Financial Services | 1 | $8B |
|
||
| Healthcare | 1 | $5B |
|
||
Price history
+749.5% since first listed17 events — show timeline
- 2026-06-16 Listed $169,900 GCMLS AL
- 2025-11-26 Price Changed $185,000 BCAR
- 2025-09-29 Price Changed $199,900 BCAR
- 2025-04-29 Listed $205,000 BCAR
- 2025-02-04 Listed $205,000 BCAR
- 2024-08-20 Pending — BCAR
- 2024-07-31 Contingent — BCAR
- 2024-06-23 Price Changed $205,000 BCAR
- 2024-06-20 Price Changed $205,000 GCMLS AL
- 2024-04-11 Listed $215,000 BCAR
- 2023-11-18 Rental Removed $1,700 BUILDIUM
- 2023-11-10 Listed for Rent $1,700 BUILDIUM
- 2022-07-21 Sold (Public Records) $173,100 Public Records
- 2021-11-30 Sold (MLS) $183,000 GCMLS AL
- 2019-04-01 Sold (Public Records) $124,254 Public Records
- 2009-11-17 Sold (Public Records) $125,210 Public Records
- 2008-10-06 Sold (Public Records) $20,000 Public Records
Property tax history
+10.9%/yrLatest (2025): $1,984 · +3.0% YoY. Source: county tax records.
Cash-flow waterfall
monthlySold comps — $/sqft
last 12 mo · ≤1 miLoading sold comps…